Bonds Bond outlook: Strong yields offer upside as risks linger

Halfway through the year, bond markets are contending with the twists and turns of war in Iran, shifting labor market dynamics and heightened risks to economic growth. 


“Bond markets have been influenced by the inflationary impact of higher energy prices,” says Chitrang Purani, principal investment officer for CGCB — Capital Group Core Bond ETF and portfolio manager for The Bond Fund of America®. "But I’m increasingly concerned about how the war could weigh on economic growth as certain consumers have little buffer to absorb another inflation spike.”


While bond returns this year have been muted, this view suggests that ample starting yields could lead to a stronger second half as elevated rates either persist or drift down to boost total returns. The Bloomberg U.S. Aggregate Index, which delivered a 7% return in 2025, now offers a starting yield of 4.7%, up about 40 basis points (bps) from year-end. 

Bonds hit a sweet spot for income and diversification

Left chart: A line chart showing the Bloomberg U.S. Aggregate index yield to worst from December 2021 to May 2026. The index yield in May 2026 is about 2.7 times higher than in December 2021. Center chart: A line chart showing the Bloomberg U.S. Aggregate index duration from December 2021 to May 2026. The May 2026 index duration reflects nearly one year less interest rate sensitivity than in December 2021. Right chart: A line chart of the federal funds rate from December 2021 to May 2026. The upper bound of 3.75% in May 2026 suggests about 350 basis points more room to cut compared with December 2021.

Sources: Capital Group, Bloomberg. As of May 31, 2026. Duration is a measure of a bond’s price sensitivity to interest rate changes, expressed in years. Yield-to-worst is the lowest possible annualized return an investor could receive, assuming no default and that the bond is called, put or held to maturity. Fed funds target rate reflects upper bound of range.  

“We remain in this period of elevated yields, which is a great setup for forward returns,” says Damien McCann, principal investment officer of CGMS - Capital Group U.S. Multi-Sector Income ETF. “You’d have to go back about 17 years to find another period where forward return expectations are as attractive as they’ve been in recent years.”

Interest rate strategy comes into focus

Inflation concerns dominated bond market sentiment in the first half of the year, with the Consumer Price Index (CPI) rising from 2.4% in February to reach 4.2% in May, its highest level in three years. This has led the market to reprice Fed expectations toward seeing a rate hike more likely than a cut. 

Markets expect rate hikes, but we see a patient Fed as more likely

A line chart shows the federal funds rate as of June 17, 2026, compared with a market-implied rate for December 2026 from January to June 2026. A dashed horizontal line marks the actual federal funds rate at roughly 3.6% as of June 17, 2026. A solid line representing the market implied rate for December 2026 rises from near 3.1% in January, increases sharply in March, fluctuates in April, and ends near 4% in June, above the current policy rate.

Sources: Capital Group, Bloomberg. As of June 17, 2026. The federal funds rate shown is the midpoint of the upper and lower bounds of the Federal Reserve’s target range for the federal funds rate. Market-implied federal funds rates are derived from federal funds futures pricing and reflect market expectations. These expectations are subject to change and may differ from actual Federal Reserve decisions.

But several factors could help inflation stay more contained, especially when compared to past inflationary episodes. Money supply growth and bank lending are running at significantly lower levels than in prior surges, suggesting less fuel for sustained price pressures. The consumer also appears more constrained as the savings rate remains low and wage growth is tepid. These dynamics point to a more limited and potentially self-dampening inflation impulse.


History also shows that oil-driven inflation shocks have not translated into a consistent long-term path for Treasury yields. Yields have often risen in the near term, but over a one-year horizon there doesn’t appear to be a clear cause-and-effect relationship between the initial oil shock and where yields ultimately settle. 

Core inflation holds steady amid high energy prices

A stacked bar chart showing year over year CPI inflation contributions from core services, core goods, shelter, and food & energy from January 2021 to May 2026. Inflation surged in 2021–2022, driven mainly by food and energy and shelter, then cooled in 2023–2024. Shelter has been a steady contributor to inflation, while food and energy have been volatile. Inflation stabilized in 2025 but began to edge higher in early 2026.

Sources: Capital Group, Bureau of Labor Statistics, Bloomberg. Data shown is CPI for all items. Latest data available is for May 2026 as of June 10, 2026.

Inflation pressures within the core PCE Index — the Fed’s preferred inflation measure — remain muted. At the same time, real consumer income growth and spending growth have declined, while a key measure of consumer confidence1 dropped to an all-time low in May. We're watching inflation and labor market developments closely to monitor for changes in underlying consumer strength. We believe these factors may lead the Fed to stay on hold rather than hike rates over the next several quarters.


“Higher oil prices are pushing up the cost of living for consumers already under pressure from weak wage growth, depleted savings and softening economic sentiment,” says Timothy Ng, portfolio manager for American Funds® Strategic Bond Fund and American Funds Inflation Linked Bond Fund®.  


Against this backdrop, we find it favorable to extend duration within bond portfolios. The recent rise in rates, with 10-year Treasury yields hitting above 4.6% in May, has translated into strong starting yields and attractive valuations. The position also serves as a potential hedge against further economic softening.


Beyond geopolitics, longer term forces such as artificial intelligence may also support lower rates across a range of outcomes. Strong productivity gains could help dampen inflation, while potential disruption to labor markets or risk sentiment could accelerate the need for a Fed response. Additionally, a Fed helmed by chairman Kevin Warsh is anticipated to lean more dovish.


If economic prospects fade and the Fed resumes cuts, that could lead to a steepening of the Treasury yield curve as short-term yields fall and long-term yields rise. 

Strong fundamentals provide selective opportunity across credit sectors

The outlook for credit reflects a combination of attractive starting yields and largely resilient fundamentals. Elevated yields provide meaningful income support, and although spreads are tight, they can be justified by strengthening fundamentals. In this environment, we're finding value in a diversified and flexible approach to credit investing.


“The outlook for credit quality remains strong, and we expect that strength to continue,” says McCann. “Overall, this is a supportive environment for credit returns.”


With widening dispersion, broad-based exposure is less attractive. Rather, yield and spread differences across sectors and within rating cohorts are creating opportunities for issuer selection. 

Key credit sectors offer attractive yield

A series of bars compares yield-to-worst ranges across underlying bond constituents as represented by the Bloomberg Global Aggregate Index, Bloomberg U.S. Corporate Investment Grade Index, Bloomberg U.S. Corporate High Yield 2% Issuer Capped Index, Bloomberg Corporate Mortgage-Backed Securities (CMBS): ERISA Eligible Index, Bloomberg U.S. Asset-Backed Securities Index, and J.P. Morgan GBI-EM Global Diversified Index. Local currency emerging markets, CMBS and U.S. high yield debt have the widest ranges, while ABS has the narrowest. Current yields vary widely across sectors, highlighting how underlying security selection can impact overall yield.

Sources: Capital Group, Bloomberg, J.P. Morgan. As of May 31, 2026. Global aggregate is the Bloomberg Global Aggregate Index. U.S. investment-grade corporates is the Bloomberg Corporate Investment Grade Index. U.S. high-yield corporates is the Bloomberg U.S. Corporate High Yield 2% Issuer Capped Index, CMBS is the Bloomberg CMBS: Erisa Eligible Index, ABS is the Bloomberg ABS Index, Local currency emerging markets debt is the J.P. Morgan GBI-EM Global Diversified Index. 

Investment‑grade (BBB/Baa-rated and above) corporates remain supported by strong corporate balance sheets and disciplined capital allocation. Net leverage levels have held relatively steady, reflecting a measured approach to financing, including around merger and acquisitions activity.


One key area of interest is debt tied to AI and data center investment, where large issuers with well‑capitalized balance sheets, resilient cash flows and high credit ratings are helping drive what may be a record year for investment-grade issuance. “Most of the AI financing has come from the hyperscalers,” McCann says. “The resulting supply has widened spreads just enough to create opportunity in very high‑quality credit.” Areas such as pharmaceuticals, utilities and managed care also stand out, where factors ranging from new product launches to wildfire mitigation efforts and stronger underwriting may support further spread compression.


We have high conviction in the securitized debt universe, where valuations remain attractive relative to corporates and fundamentals remain positive. Although our outlook on mortgage-backed securities has faded somewhat in recent quarters as valuations look less attractive, other parts of the sector have our attention. A slow-motion recovery in commercial real estate is creating opportunities in commercial mortgage-backed securities as refinancing conditions improve and help drive sales transactions and price discovery. Asset‑backed securities are benefiting from robust structural protections that are helping insulate investors from mixed consumer balance sheets.


Within the high-yield universe, fundamentals also appear relatively solid. Leverage has risen only modestly from recent lows while cash balances and interest coverage ratios remain healthy. The impact from tariffs has been manageable, and elevated operating costs have largely flowed through to consumers. High-yield spreads may look a little tight relative to other sectors, making security selection key in industries such as media and commercial real estate. Across the sector, an improvement in credit quality and a short duration help explain why spreads are tight relative to history.


Private credit has seen notable withdrawals, rising defaults and AI-related disruptions, but the headlines often overlook the sector’s diversity across lending structures and risk profiles. Selectivity and an up-in-quality bias may aid investors in capturing better risk-adjusted income while the broader market faces late-cycle pressure. Opportunities can be found in direct lending to upper middle market companies, where larger companies may be better able to absorb relatively elevated financing costs, and asset-based finance, where loans are secured by hard collateral such as equipment and may offer higher recovery rates in a downturn.


In emerging markets debt, robust yields paired with healthy fundamentals are creating compelling opportunities. A number of sovereign issuers offer higher real yields and relatively lower debt levels than many developed markets, including the United States. Positioning is highly differentiated by region, with greater conviction in parts of Latin America and a more cautious stance towards areas that are more sensitive to energy prices or geopolitical risk. Local currency bond markets also stand out, offering both income potential and a possible hedge against a weaker U.S. dollar. 

Robust yields paired with healthy fundamentals drive emerging markets debt

This scatter chart shows real yields versus debt to GDP, divided into four quadrants by reference lines near the U.S. with 1.4 percent real yield and around 125 percent debt-to-GDP. The upper left quadrant, indicating lower debt and higher real yields, includes Brazil, Colombia, South Africa, Mexico, Indonesia, Chile, the Czech Republic, Poland, Hungary, India, Malaysia, and Thailand. China falls in the lower left quadrant, with lower debt but real yields around 0.6 percent. Romania is also in the lower left quadrant, showing lower debt and negative real yields.

Sources: Bloomberg, International Monetary Fund, J.P. Morgan. Real yields data as of May 31, 2026. Real yields represent country yield components of the J.P. Morgan GBI-EM Global Diversified Index minus core inflation. U.S. real yields represent 5-year Treasury yields minus U.S. core inflation. Debt-to-GDP represents general government gross debt as a percent of GDP and is sourced from the IMF's World Economic Outlook report from April 2026. 

Overall, the case for credit is less about chasing spread compression and more about obtaining income from fundamentally sound issuers in an elevated rate environment. 

Income and ballast in a shifting landscape

Elevated yields have strengthened the opportunity set in fixed income, creating a more favorable entry point. Duration positioning and an emphasis on diversification and flexibility across credit sectors can help investors target attractive returns. Should economic conditions weaken, bonds are also in a position to play their historically critical role in providing diversification from equities and other risk assets. That ballast may prove especially valuable as markets navigate geopolitical uncertainty and downside risks to growth in the second half of the year. 

Chitrang Purani is a fixed income portfolio manager with 22 years of investment industry experience (as of 12/31/2025). He holds an MBA from the University of Chicago and a bachelor's degree in finance from Northern Illinois University. He also holds the Chartered Financial Analyst® designation.

Damien McCann is a fixed income portfolio manager with 26 years of investment industry experience (as of 12/31/2025). He holds a bachelor’s degree in business administration with an emphasis on finance from California State University, Northridge. He also holds the Chartered Financial Analyst® designation.

Timothy Ng is a fixed income portfolio manager with 19 years of investment industry experience (as of 12/31/2025). He holds a bachelor's degree in computer science from the University of Waterloo, Ontario.

1The University of Michigan Consumer Sentiment Index fell to 44.8 in May, down from 49.8 in April, and the lowest level on record.


Past results are not predictive of results in future periods.


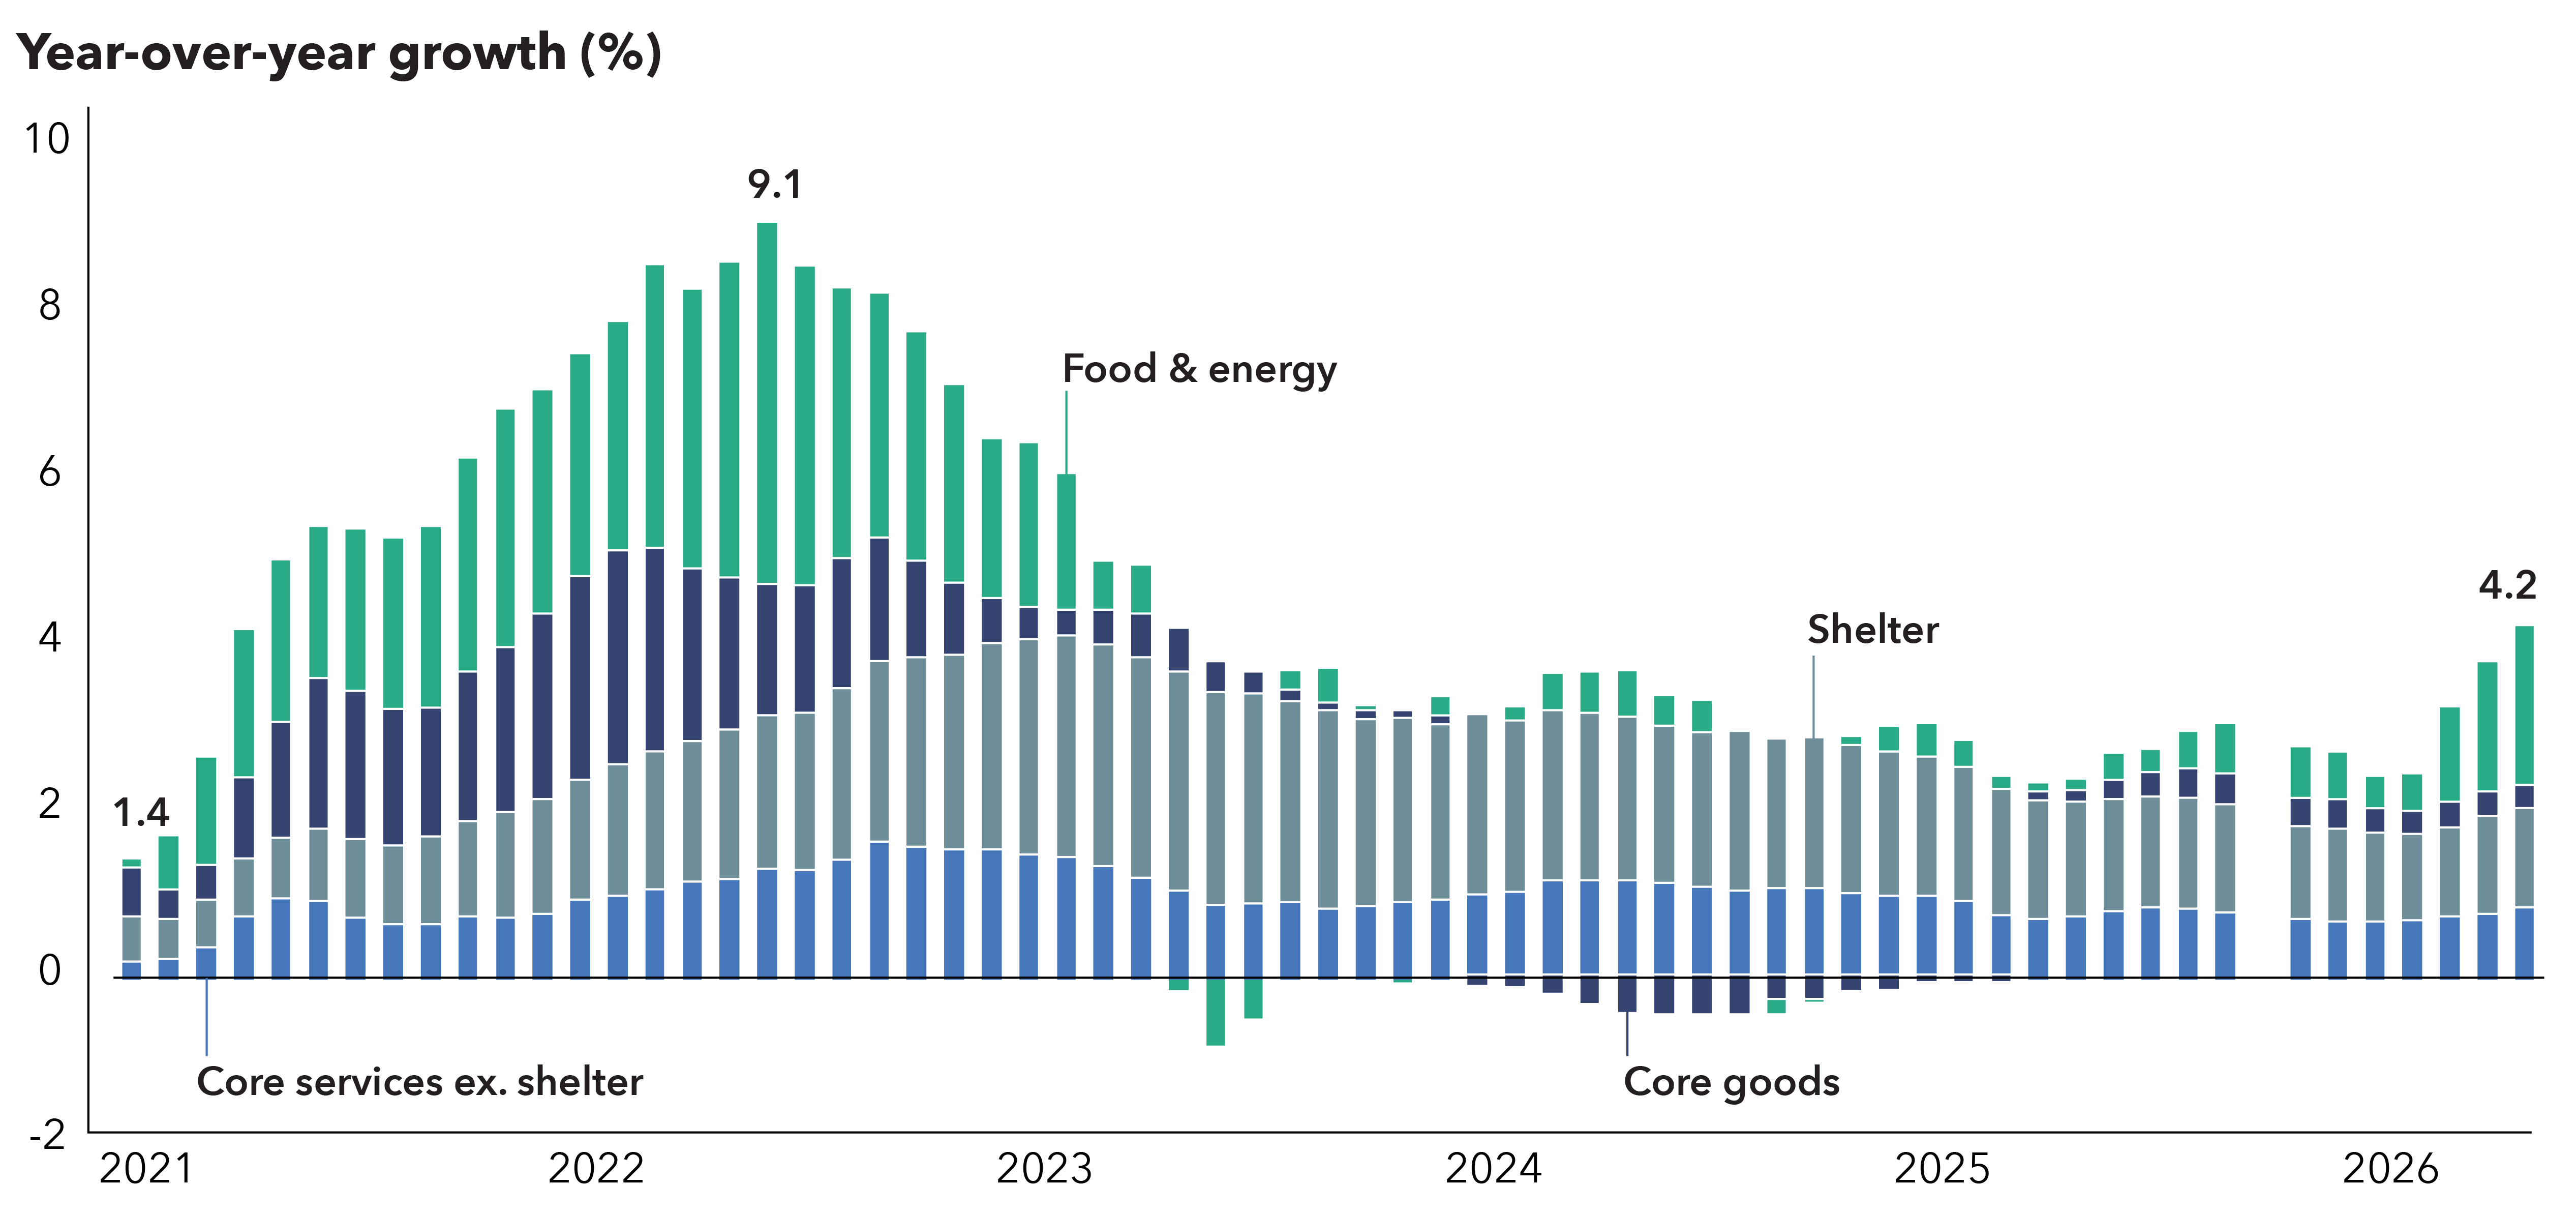
Consumer Price Index (CPI) is a measure of the average change over time in the prices paid by urban consumers for a market basket of consumer goods and services.


Bond ratings, which typically range from AAA/Aaa (highest) to D (lowest), are assigned by credit rating agencies such as Standard & Poor's, Moody's and/or Fitch, as an indication of an issuer's creditworthiness.


A spread over Treasuries is the difference between the yield of a bond and the yield of a similar maturity Treasury bond.


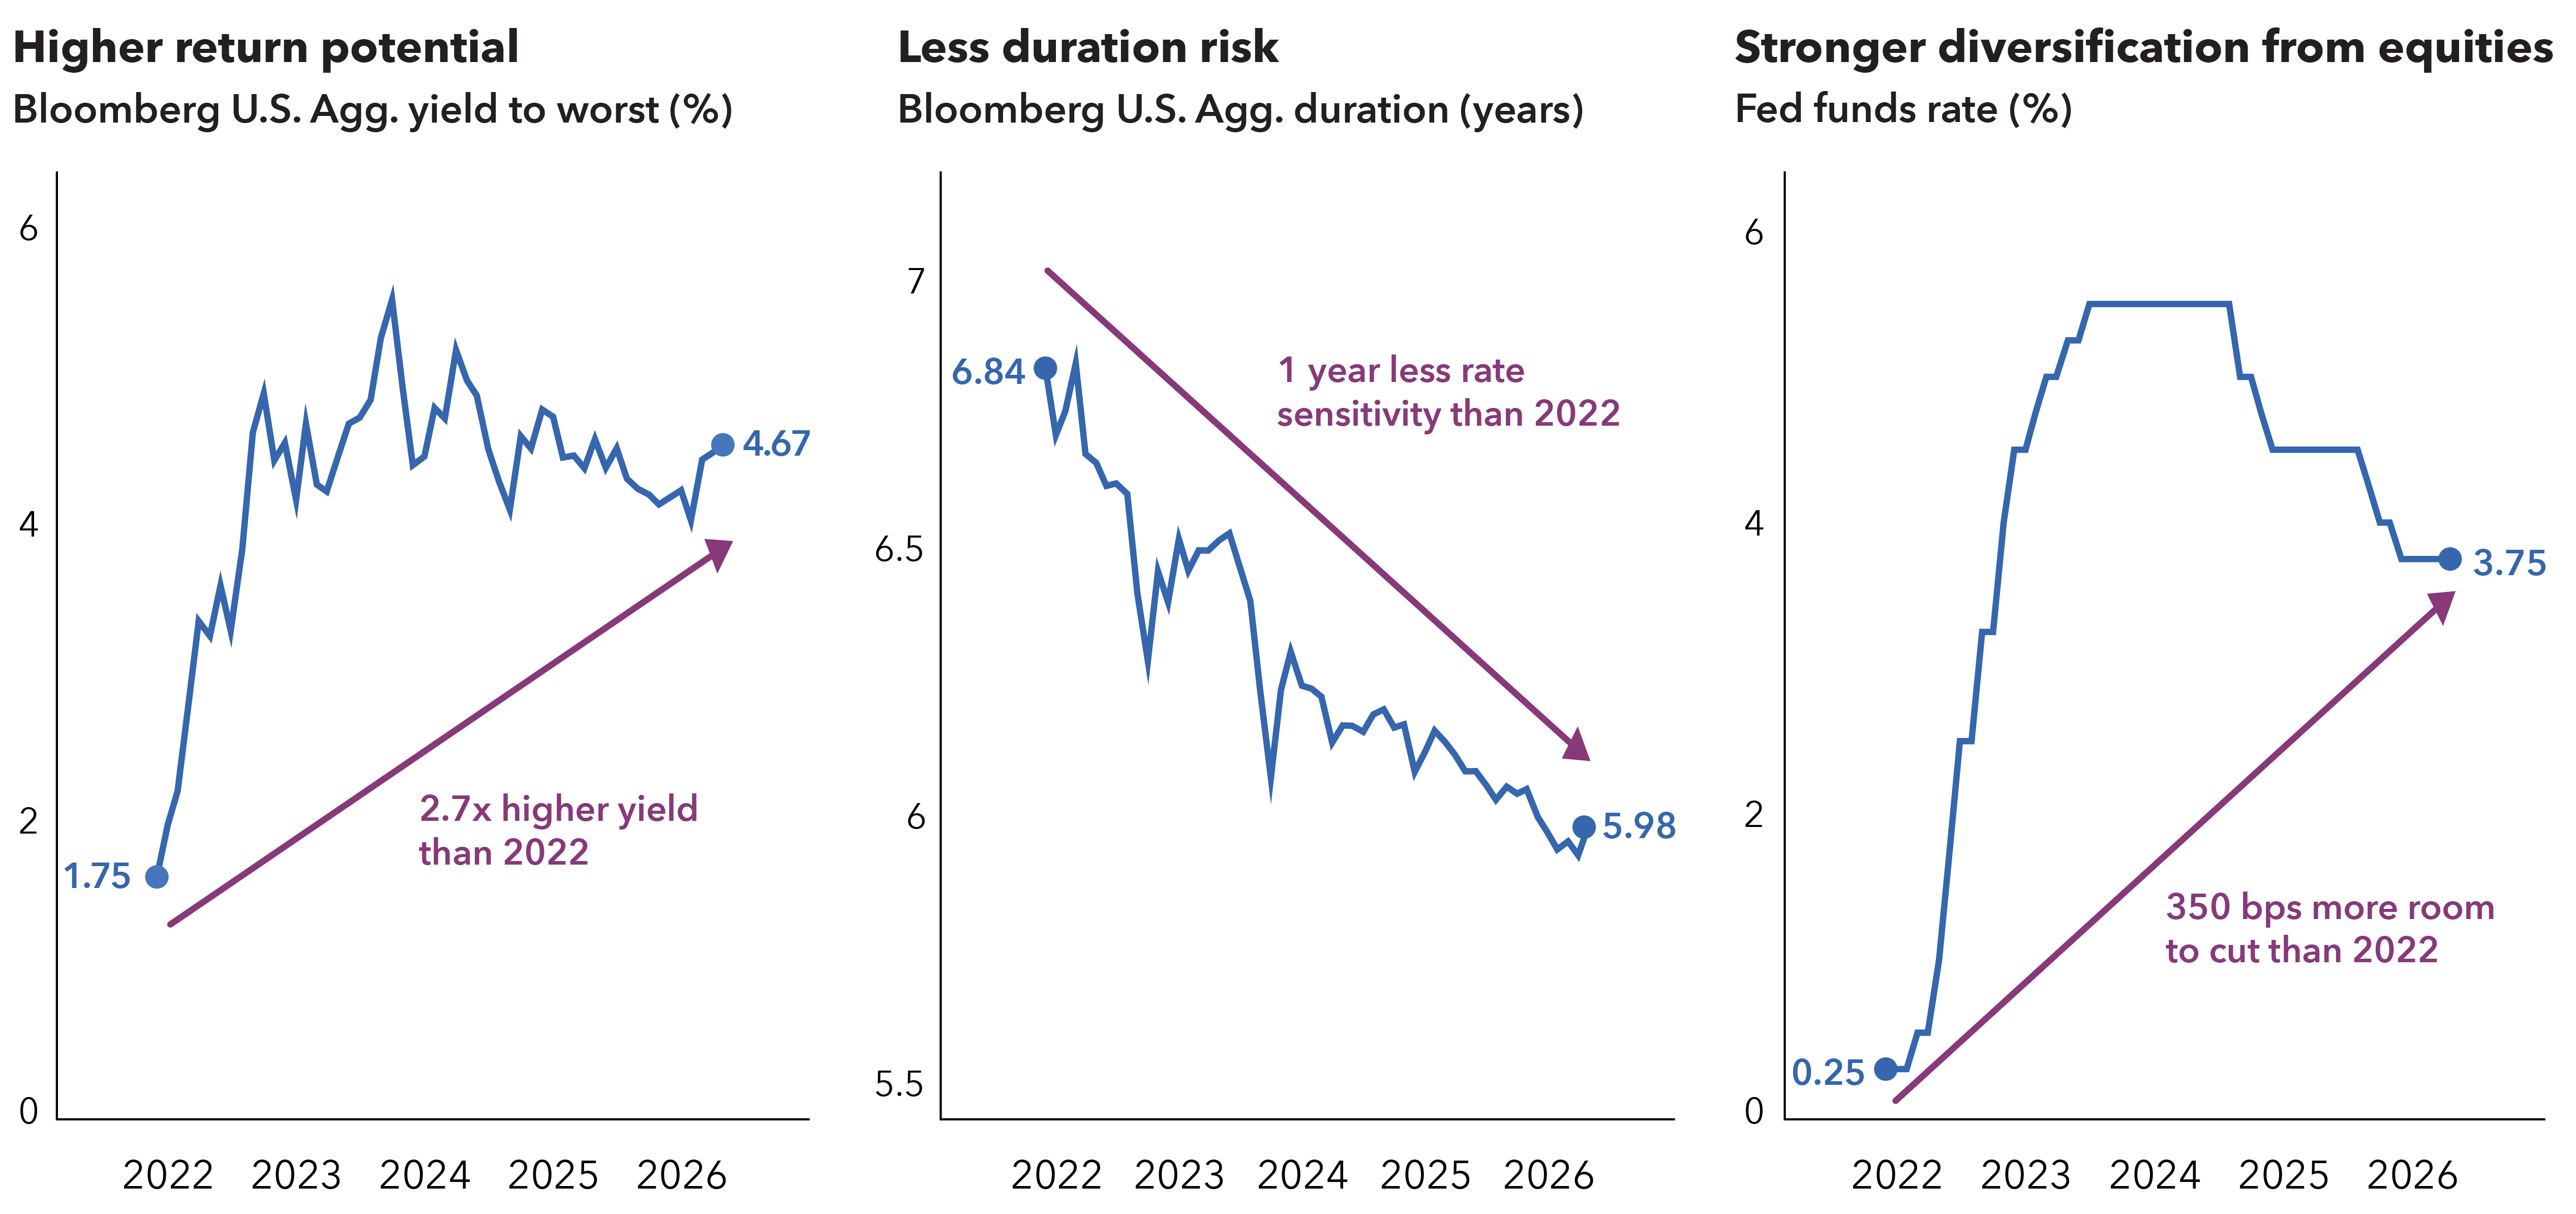
Duration measures a bond’s sensitivity to changes in interest rates. Generally speaking, a bond's price will go up 1% for every year of duration if interest rates fall by 1% or down 1% for every year of duration if interest rates rise by 1%.


Hyperscalers are large-scale cloud service providers that offer computing power and storage to organizations and individuals globally.


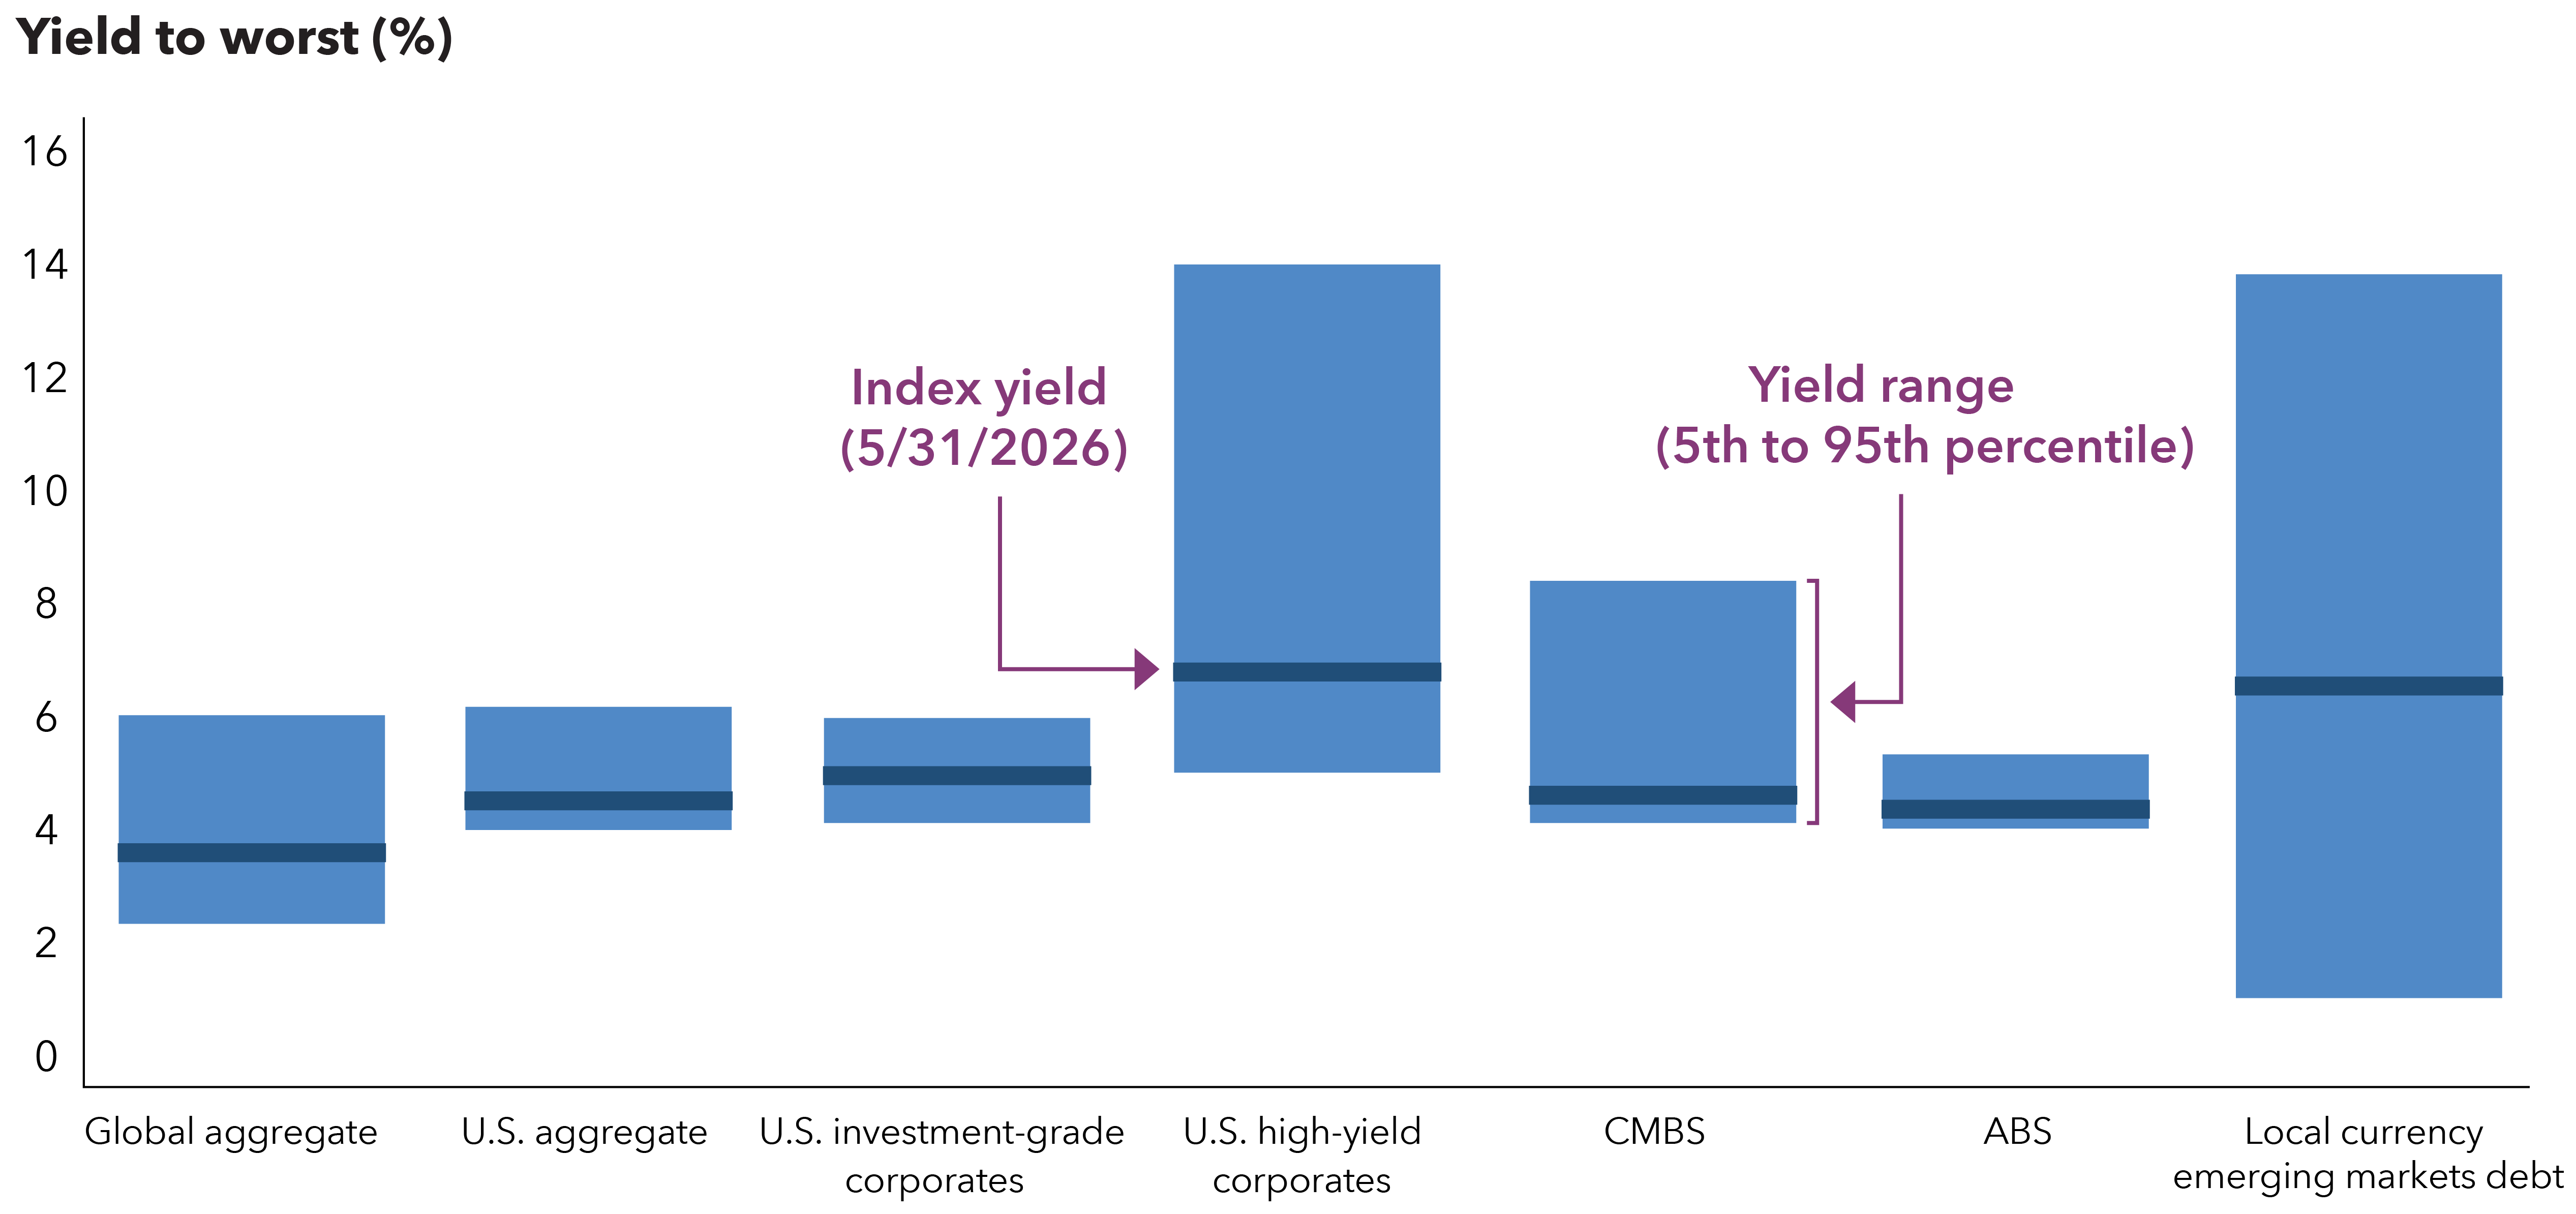
Bloomberg U.S. Aggregate Index represents the U.S. investment-grade fixed-rate bond market.


Bloomberg U.S. Corporate High Yield 2% Issuer Capped Index covers the universe of fixed-rate, non-investment-grade debt. The index limits the maximum exposure of any one issuer to 2%.


Bloomberg U.S. Corporate Investment Grade Index represents the universe of investment-grade, publicly issued U.S. corporate and specified foreign debentures and secured notes that meet the specified maturity, liquidity and quality requirements.


Bloomberg CMBS Index represents the universe of U.S. commercial mortgage-backed securities. 


Bloomberg ABS Index represents the universe of U.S. asset-backed securities.  


JP Morgan Government Bond Index – Emerging Markets (GBI-EM) Global Diversified covers the universe of regularly traded, liquid fixed-rate, domestic currency emerging market government bonds to which international investors can gain exposure. 


Investments in private credit and related strategies involve significant risks, including limited liquidity and potential loss of capital. These strategies may include exposure to low and unrated credit instruments, structured products, and derivatives, all of which carry heightened credit, market, valuation, and liquidity risks. Investors should consult with their financial professional when considering such strategies for their portfolios.


There have been periods when the results lagged the index(es) and/or average(s). The indexes are unmanaged and, therefore, have no expenses. Investors cannot invest directly in an index.


This report, and any product, index or fund referred to herein, is not sponsored, endorsed or promoted in any way by J.P. Morgan or any of its affiliates who provide no warranties whatsoever, express or implied, and shall have no liability to any prospective investor, in connection with this report. J.P. Morgan disclaimer: https://www.jpmm.com/research/disclosures.


Source: Bloomberg Index Services Limited. BLOOMBERG® is a trademark and service mark of Bloomberg Finance L.P. and its affiliates (collectively "Bloomberg"). Bloomberg or Bloomberg's licensors own all proprietary rights in the Bloomberg Indices. Neither Bloomberg nor Bloomberg's licensors approves or endorses this material, or guarantees the accuracy or completeness of any information herein, or makes any warranty, express or implied, as to the results to be obtained therefrom and, to the maximum extent allowed by law, neither shall have any liability or responsibility for injury or damages arising in connection therewith.

Investments are not FDIC-insured, nor are they deposits of or guaranteed by a bank or any other entity, so they may lose value.
Investors should carefully consider investment objectives, risks, charges and expenses. This and other important information is contained in the mutual fund prospectuses and summary prospectuses, which can be obtained from a financial professional and should be read carefully before investing.
Statements attributed to an individual represent the opinions of that individual as of the date published and do not necessarily reflect the opinions of Capital Group or its affiliates. This information is intended to highlight issues and should not be considered advice, an endorsement or a recommendation.
All Capital Group trademarks mentioned are owned by The Capital Group Companies, Inc., an affiliated company or fund. All other company and product names mentioned are the property of their respective companies.
Use of this website is intended for U.S. residents only. Use of this website and materials is also subject to approval by your home office.
Capital Client Group, Inc.
This content, developed by Capital Group, home of American Funds, should not be used as a primary basis for investment decisions and is not intended to serve as impartial investment or fiduciary advice.