Capital Group U.S. Equity
- Vehicle
- SMA
- Objective
- Growth
WHY CAPITAL GROUP?
Our separately managed accounts are backed by the same deep experience and long-term investment approach that have made Capital Group a trusted leader.
▉ Composite "pure" gross
▉ S&P 500 Index
○ Composite net of fees
◆ Index with equivalent deduction*
Data as of December 31, 2025.

All seven of Capital Group's U.S. equity SMAs have lifetime results that exceeded their benchmark on a gross basis.
*The equivalent deduction is a comparison provided for illustrative purposes only. It reflects the index return if a monthly hypothetical deduction (equivalent to 3% annual) were applied. The indexes are unmanaged and, therefore, have no expenses.
▉ Composite "pure" gross
▉ Index
○ Composite net of fees
◆ Index with equivalent deduction*
Data as of December 31, 2025.

Four of Capital Group's five international and global SMAs have lifetime results that exceeded their benchmark on a gross basis.
*The equivalent deduction is a comparison provided for illustrative purposes only. It reflects the index return if a monthly hypothetical deduction (equivalent to 3% annual) were applied. The indexes are unmanaged and, therefore, have no expenses.
Results are essential — but insight sets us apart. With decades of experience serving high net worth investors, we understand their priorities and expectations.

James Robelotto
Wealth Management Consultant
2 MIN VIDEO
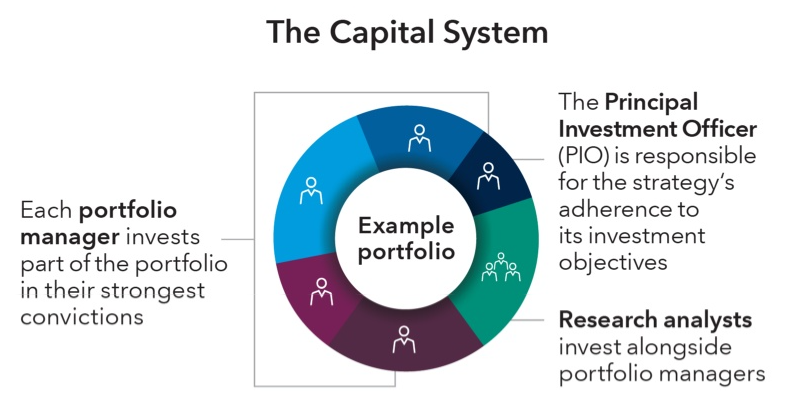
Our SMAs are powered by the same experienced teams, resources and institutional scale as our American Funds.
Years of investment experience
Investment
professionals
Total assets under management
Portfolio managers' average years of experience
Data as of December 31, 2025.
PRODUCTS
Deliver clients customizable† portfolios backed by active management with a long-term focus.
Seeking tax‑exempt income with the flexibility of an SMA? Our national and state‑focused portfolios are backed by a risk‑aware approach designed to capture the upside and limit the downside of the muni market.

Received a Morningstar Medalist Rating™ of Gold*** as of 4/27/26
The Morningstar Medalist Rating is a forward-looking assessment assigned by Morningstar’s research analysts. It reflects their qualitative evaluation of an investment strategy’s potential to outpace its category benchmark over a full market cycle on a risk-adjusted basis and net of fees. Morningstar bases its ratings on three key pillars — People, Parent and Process — alongside a fee assessment. The Medalist Rating does not reference a specific time period but is based on qualitative and select quantitative data through April 27, 2026. Capital Group has paid Morningstar a licensing fee to access and publish its ratings data.
WHY CHOOSE AN SMA?
SMAs hold actual securities — not just shares of a fund. That puts your client in control.
Use investment losses to offset gains — now or later, in or outside the portfolio — to boost tax efficiency.
(2.5 MIN VIDEO)
Achieve goals more efficiently. Donate appreciated shares to cut taxes, eliminate capital gains and rebalance a portfolio.
(2.5 MIN VIDEO)
Skip liquidation. Transfer securities easily, gain tax advantages and potentially avoid probate.
(2.5 MIN VIDEO)
There may be investments your client doesn’t want to hold. We may be able to exclude them from the SMA.†
Exclusionary screening
Available for business involvement in certain industries, like fossil fuels or tobacco.
Ticker restrictions
To exclude one or more individual companies.

In addition to federal income tax, municipal bond income from your client’s state of residence may be exempt from state and local taxes as well.
A triple-tax advantage can be especially beneficial for:

Thoughtful onboarding and support from our specialized professionals can better meet your client's needs.
In-kind transitions
Existing holdings can be transferred into an account or sold on behalf of your client for a more tax-efficient transition.
Muni SMA Portfolio Analysis
A detailed custom report and buy-sell analysis can show the impact of transitioning to a Capital Group SMA.

FREQUENTLY ASKED QUESTIONS
We share the latest questions our specialists are answering for financial professionals.
New to SMAs? Discover the potential of this powerful vehicle.

Ryan Gundrum
Director of ETF and SMA sales
2 MIN VIDEO
A separately managed account (SMA) is a professionally managed portfolio of securities selected by an investment manager and owned by the end investor.
The primary difference is that with an SMA, your client directly owns the stocks and bonds. With a mutual fund or ETF, your client owns shares of the fund, which in turn invests in stocks and bonds.
Minimums differ by sponsor firm, but Capital Group minimums are typically $100K for equity SMAs and $250K for fixed income SMAs.
It’s a technique to manage capital gains and losses to help limit tax liability. If an investment that’s lost value is sold, that realized loss can be used to offset gains at another time or in a different investment. In certain cases, holdings that have appreciated in value can also be harvested — for example, to take advantage of embedded losses elsewhere, increase cost basis or reduce concentrated positions.
Yes. Speak with your home office representative to understand how to pursue your client’s desired tax gain/loss harvesting objectives. Discretionary services may be offered by the financial intermediary, depending on the platform.
In many cases, yes. If your client is considering this option, Capital Group offers an in-kind portfolio analysis to identify which securities would be kept (because they align with the investment strategy) and which would be liquidated. Contact your sales representative for more information.
Fees differ by sponsor firm, asset class and other factors. Your sales representative can help you understand the fee structure for your client.
To get started, contact your sales representative or call (800) 421-0180, option 1.
†Industry exclusion availability and other customization options vary by sponsor and program. Please check with your home office.
**Holdings may fall below these amounts due to various factors including, but not limited to, market conditions, availability of the securities and investment conviction.
***The Morningstar Medalist Rating™ is the summary expression of Morningstar's forward-looking analysis of investment strategies as offered via specific vehicles using a rating scale of Gold, Silver, Bronze, Neutral, and Negative. The Medalist Ratings indicate which investments Morningstar believes are likely to outperform their Morningstar Category average on a risk-adjusted basis over time. Investment products are evaluated on three fundamental pillars (People, Parent, and Process) and the Medalist Rating Price Score, which forms the basis for Morningstar's conviction in those products' investment merits and determines the Medalist Rating they are assigned. Pillar ratings take the form of Low (-2), Below Average (-1), Average (0), Above Average (+1), and High (+2). Pillars may be evaluated via an analyst's qualitative assessment (either directly to a vehicle the analyst covers or indirectly when the pillar ratings of a covered vehicle are mapped to a related uncovered vehicle) or using algorithmic techniques. The cost of an investment product is evaluated using the Medalist Rating Price Score, which is a continuous score running from negative 2.5 to positive 2.5 based on the percentile rank of a vehicle's expense ratio within its Morningstar Category. Morningstar combines the pillar scores and Medalist Rating Price Score using predetermined weights for actively and passively managed vehicles to calculate a weighted score. The weighted score is then compared to a set of fixed numeric thresholds employed consistently across Morningstar Categories and regions, with separate thresholds for actively and passively managed investments. Rating thresholds are reviewed at least annually. Buffers and ratings caps are employed to prevent frequent ratings changes. When analysts directly cover a vehicle, they assign the fundamental pillar ratings based on their qualitative assessment, subject to the oversight of the Analyst Rating Committee, and monitor and reevaluate them approximately once a year. When vehicles are covered either indirectly by analysts or by algorithm, the ratings are assigned monthly. The Morningstar Medalist Ratings are not statements of fact, nor are they credit or risk ratings. The Morningstar Medalist Rating (i) should not be used as the sole basis in evaluating an investment product, (ii) involves unknown risks and uncertainties which may cause expectations not to occur or to differ significantly from what was expected, (iii) is not guaranteed to be based on complete or accurate assumptions or models when determined algorithmically, (iv) involves the risk that return targets will not be met due to unforeseen changes in management, technology, economic development, interest rate development, operating and/or material costs, competitive pressure, supervisory law, exchange rates, tax rates, or political and social conditions, and (v) should not be considered an offer or solicitation to buy or sell the investment product. A change in the fundamental factors underlying the Morningstar Medalist Rating may result in the rating no longer being accurate. Analysts do not have any other material conflicts of interest at the time of publication. Users wishing to obtain further information should contact their local Morningstar office. Capital Group did not compensate Morningstar for the ratings and comments contained in this material. However, the firm has paid Morningstar a licensing fee to access and publish its ratings data.
For registered investment advisors only.
Important investment disclosure
Source: Capital Group. ACWI = All Country World Index; EAFE = Europe, Australasia, Far East. For Global Growth SMA vs. benchmark comparison, previous to 9/30/11, benchmark returns reflect MSCI World Index. For International Growth SMA vs. benchmark comparison, previous to 3/31/07, returns reflect MSCI EAFE Index.
Total returns (%)1,2,3,4,5,6
as of December 31, 2025
| Cumulative | Average annual | ||
|---|---|---|---|
| 1 year | 5 years | 10 years | |
| Capital Group U.S. Conservative Growth and Income | |||
| "Pure" gross | 16.59 | 12.10 | 11.78 |
| Net of fees | 13.18 | 8.81 | 8.50 |
| Capital Group U.S. Core | |||
| "Pure" gross | 22.19 | 16.40 | 14.78 |
| Net of fees | 18.63 | 13.00 | 11.42 |
| Capital Group U.S. Equity | |||
| "Pure" gross | 17.92 | 13.29 | 14.37 |
| Net of fees | 14.48 | 9.97 | 11.02 |
| Capital Group U.S. Flexible Growth | |||
| "Pure" gross | 17.71 | 11.41 | 15.40 |
| Net of fees | 14.27 | 8.14 | 12.02 |
| Capital Group U.S. Flexible Growth and Income | |||
| "Pure" gross | 23.85 | 15.44 | 14.84 |
| Net of fees | 20.25 | 12.07 | 11.48 |
| Capital Group U.S. Growth | |||
| "Pure" gross | 18.66 | 11.51 | 13.63 |
| Net of fees | 15.20 | 8.24 | 10.30 |
| Capital Group U.S. Income and Growth | |||
| "Pure" gross | 19.82 | 14.66 | 13.94 |
| Net of fees | 16.32 | 11.30 | 10.60 |
| Capital Group International Equity | |||
| "Pure" gross | 27.87 | 7.38 | 9.49 |
| Net of fees | 24.16 | 4.22 | 6.27 |
| Capital Group International Growth | |||
| "Pure" gross | 24.67 | 5.37 | 9.31 |
| Net of fees | 21.05 | 2.26 | 6.09 |
| Capital Group Global Equity | |||
| "Pure" gross | 25.65 | 10.90 | 12.51 |
| Net of fees | 22.00 | 7.64 | 9.21 |
| Capital Group Global Growth | |||
| "Pure" gross | 22.09 | 10.15 | 14.05 |
| Net of fees | 18.53 | 6.91 | 10.71 |
| Capital Group World Dividend Growers | |||
| "Pure" gross | 24.39 | 10.69 | 10.51 |
| Net of fees | 20.77 | 7.44 | 7.26 |
Index total returns (%)4
as of December 31, 2025
| Cumulative | Average annual | ||
|---|---|---|---|
| 1 year | 5 years | 10 years | |
| S&P 500 Index | |||
| 17.88 | 14.42 | 14.82 | |
| MSCI EAFE Index | |||
| 31.22 | 8.92 | 8.18 | |
| MSCI ACWI ex USA | |||
| 32.39 | 7.91 | 8.41 | |
| MSCI World Index | |||
| 21.09 | 12.15 | 12.17 | |
| MSCI ACWI | |||
| 22.34 | 11.19 | 11.72 | |