* As of January 25, 2022
Target date funds have a lot in common. But the American Funds Target Date Series takes a distinctive approach that has delivered uncommon investment outcomes and helped thousands of participants come closer to achieving their financial dreams.
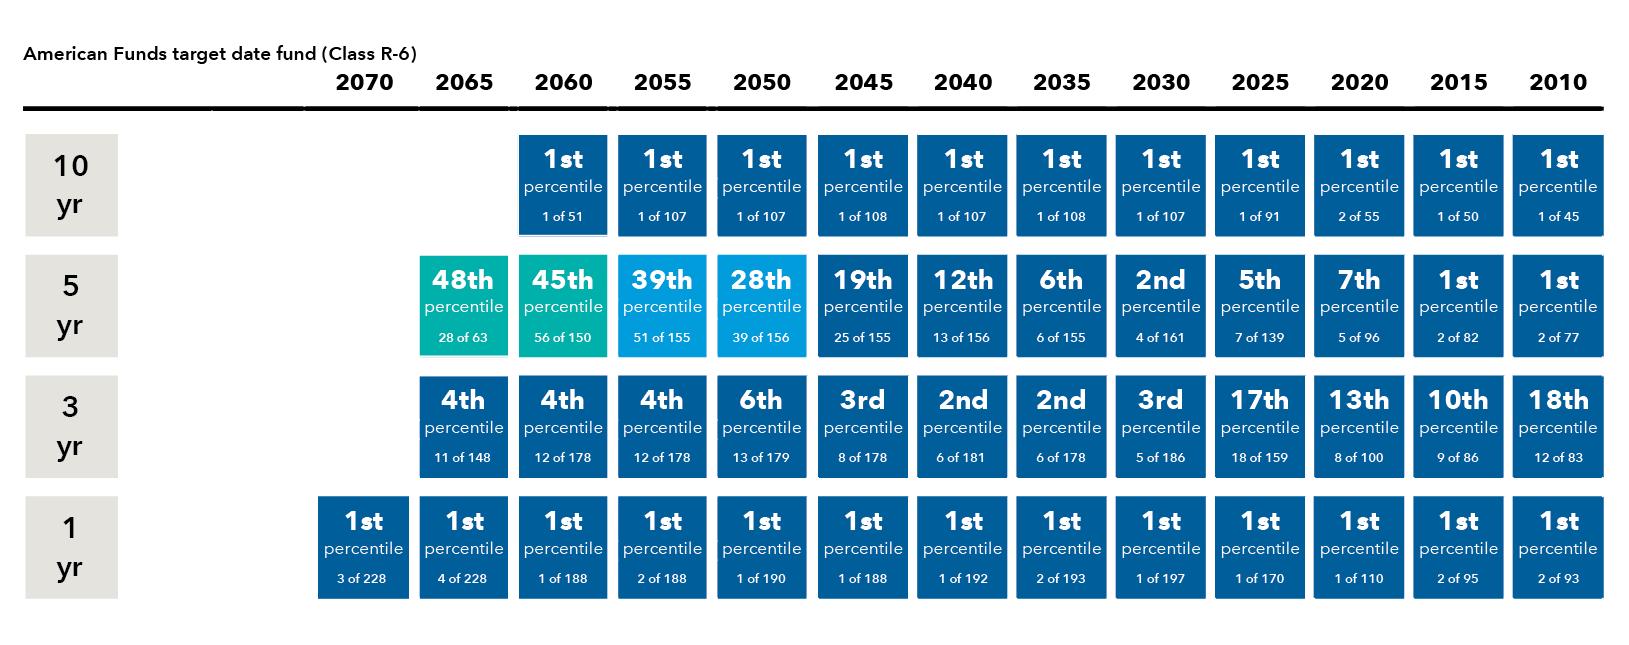
Our Series has outpaced its peers over the long haul.
Retirement takes a lifetime to earn. Our Series focuses on building and preserving wealth over the long term.
(with absolute rank and number of funds in category indicated)
Source: Capital Group, using Morningstar data as of December 31, 2022. Percentile rankings are calculated by Morningstar and reflect relative performance versus peers. A lower number is better: First percentile indicates a fund’s performance was in the top 1% of its peer group.
All funds began on February 1, 2007, except for 2055 (February 1, 2010), 2060 (March 27, 2015) and 2065 (March 27, 2020). Rankings are based on the funds’ average annual total returns (Class R-6 shares at net asset value) within the applicable Morningstar categories and don’t reflect the effects of sales charges, account fees or taxes. Past results are not predictive of results in future periods. Category averages include all share classes for the funds in the category. While American Funds R-6 shares don’t include fees for advisor compensation and service provider payments, the share classes represented in the Morningstar category have varying fee structures and can include these and other fees and charges, resulting in higher expenses and lower returns.
For a list of each fund’s Morningstar category, please see the “Morningstar categories” section. Categories include active, passive and hybrid target date funds, as well as those that are managed both “to” and “through” retirement. Approximately one-third of the funds within the 2000–2010 category have a target date of 2005. In an effort to manage the risk of investors outliving their savings while managing volatility, our approach to allocating between stocks and bonds puts more emphasis on stocks (particularly on dividend-paying stocks) than some other target date funds. Investment results assume all distributions are reinvested and reflect applicable fees and expenses. When applicable, results reflect expense reimbursements, without which they would have been lower.
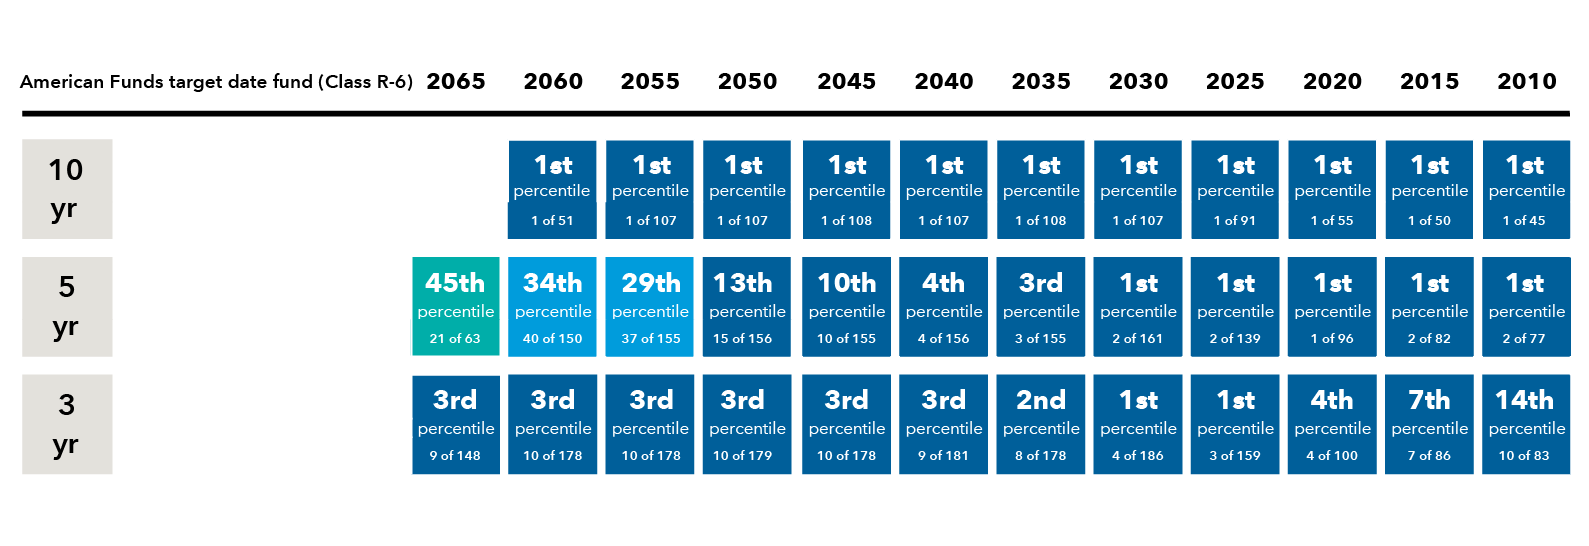
On a risk-adjusted basis, our Series’ results have been particularly strong thanks to a history of dampening exposure to market swings.
(with absolute rank and number of funds in category indicated)
*Sharpe ratio uses standard deviation (a measure of volatility) and returns to determine the reward per unit of risk. The higher the ratio, the better the portfolio’s historical risk-adjusted performance.
Source: Capital Group, using Morningstar data as of December 31, 2022. Percentile rankings are calculated by Morningstar and reflect relative performance versus peers. A lower number is better: First percentile indicates a fund’s performance was in the top 1% of its peer group.
All funds began on February 1, 2007, except for 2055 (February 1, 2010), 2060 (March 27, 2015) and 2065 (March 27, 2020). Rankings are based on the funds’ average annual total returns (Class R-6 shares at net asset value) within the applicable Morningstar categories and don’t reflect the effects of sales charges, account fees or taxes. Past results are not predictive of results in future periods. Category averages include all share classes for the funds in the category. While American Funds R-6 shares don’t include fees for advisor compensation and service provider payments, the share classes represented in the Morningstar category have varying fee structures and can include these and other fees and charges, resulting in higher expenses and lower returns.
For a list of each fund’s Morningstar category, please see the “Morningstar categories” section. Categories include active, passive and hybrid target date funds, as well as those that are managed both “to” and “through” retirement. Approximately one-third of the funds within the 2000–2010 category have a target date of 2005. In an effort to manage the risk of investors outliving their savings while managing volatility, our approach to allocating between stocks and bonds puts more emphasis on stocks (particularly on dividend-paying stocks) than some other target date funds. Investment results assume all distributions are reinvested and reflect applicable fees and expenses. When applicable, results reflect expense reimbursements, without which they would have been lower.
Our Series adapts to changing participant needs by adjusting both its stock/bond mix and the types of assets held through each stage of life.
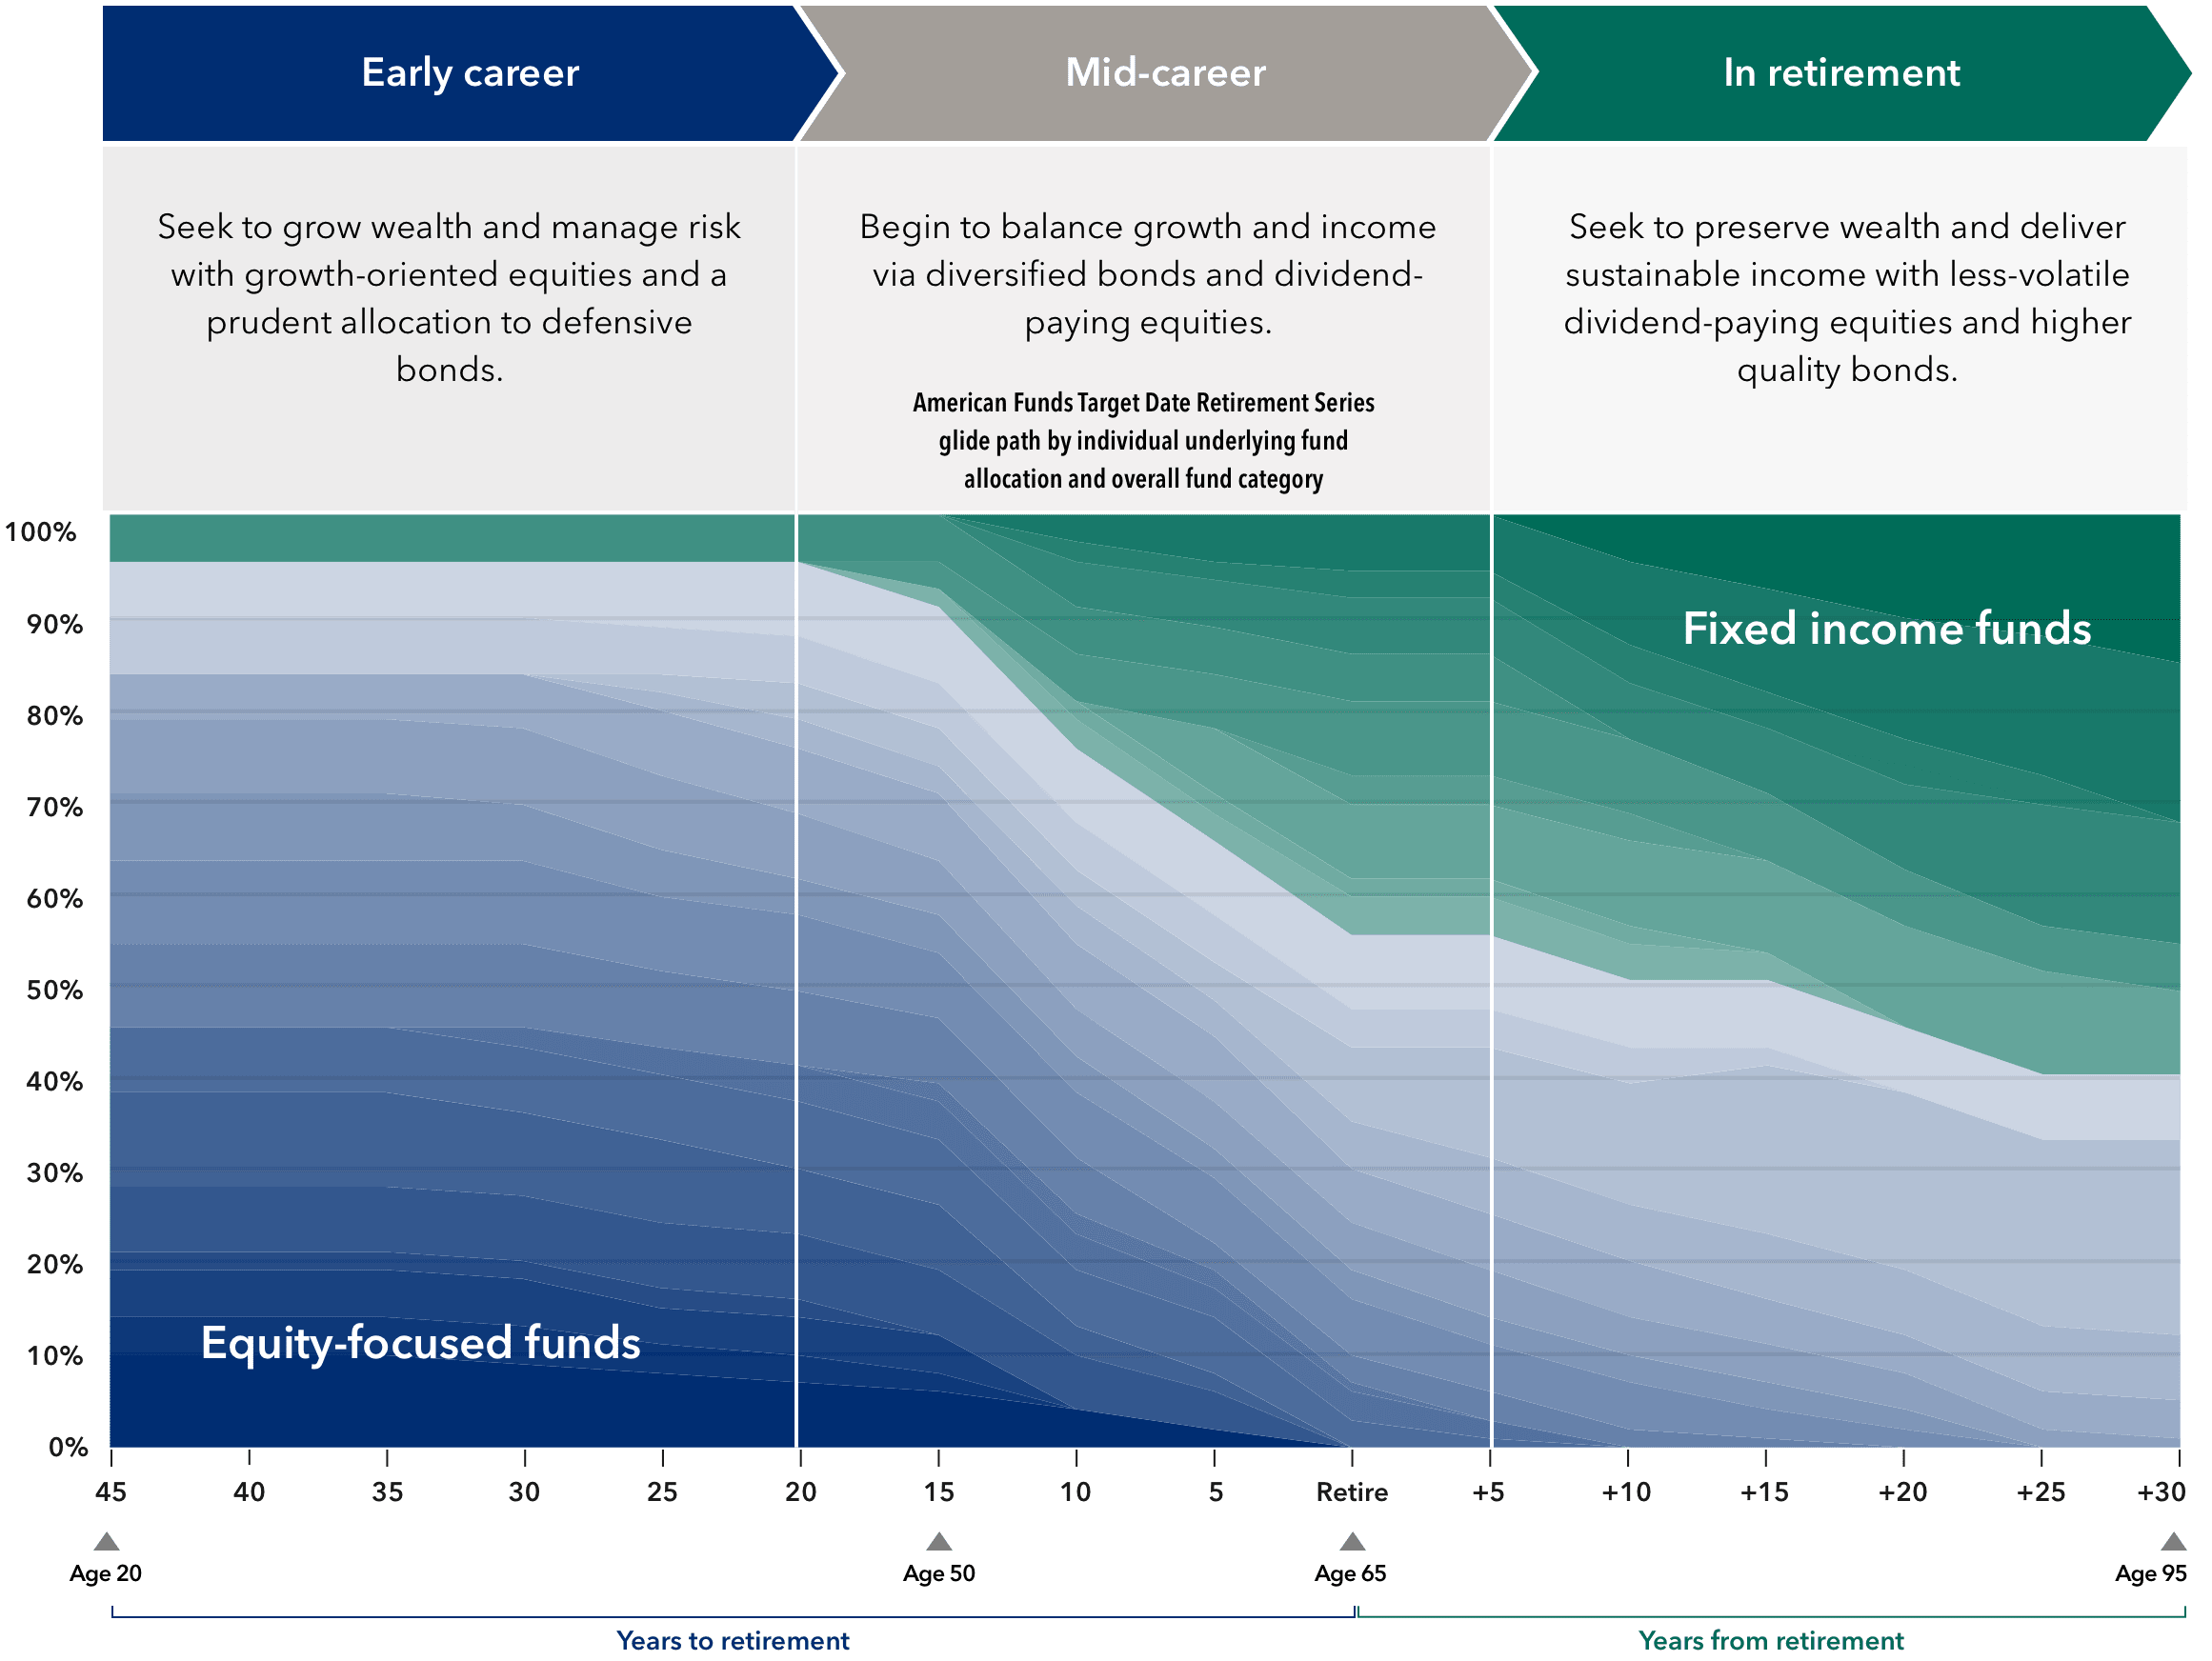
Early career
(roughly 45 to 20 years before retirement)
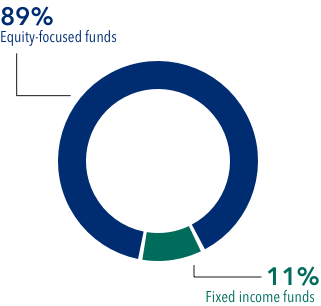
Seek to grow wealth and manage risk with predominantly growth-oriented equities and a prudent allocation to defensive bonds.
American Funds Target Date Retirement Series glide path approximation
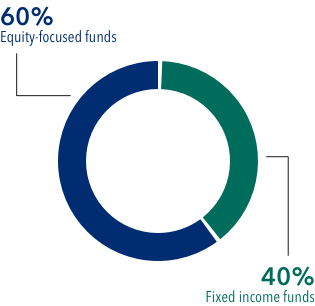
Mid-career
(roughly 20 years before retirement to 5 years after retirement)
Begin to balance growth and income via diversified fixed income and dividend-paying equities.
American Funds Target Date Retirement Series glide path approximation
In retirement
(Roughly 5 to 30 years after retirement)
Seek to preserve wealth and deliver sustainable income with less-volatile dividend-paying equities and higher quality bonds.
American Funds Target Date Retirement Series glide path approximation
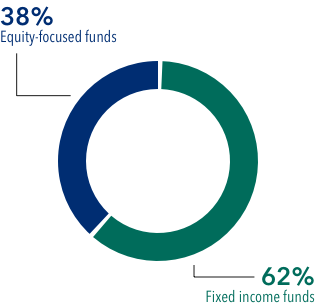
The target allocations shown are as of December 31, 2022, and are subject to the oversight committee’s discretion. The investment adviser anticipates assets will be invested within a range that deviates no more than 10% above or below the allocations shown in the prospectus/characteristics statement. Underlying funds may be added or removed during the year. Visit capitalgroup.com for current allocations.
The target allocations shown are as December 31, 2022, and are subject to the oversight committee‘s discretion. The investment adviser anticipates assets will be invested within a range that deviates no more than 10% above or below the allocations shown in the prospectus. Underlying funds may be added or removed during the year. Visit capitalgroup.com for current allocations.
The illustration below shows funds that have generated market-beating results for a range of target retirement dates.
For younger participants focused on long-term growth, our 2050 vintage has delivered an average annual excess return of 1.11%.
Scenario philosophy:
This simulation approximates the experience of an early-career participant who invested in the Series at its inception in February 2007 and expects to retire in 2050.
Assumptions:
Salary: $40,000 per year initially growing by 3% annually
Contribution rate: 10% annual contribution starting February 1, 2007
Source: Capital Group. Results are over fund lifetime through December 31, 2022 (inception date: February 1, 2007).
AFTD excess return is calculated as the difference in return between the American Funds 2050 Target Date Retirement Fund and S&P Target Date 2050 Index. Returns are time-weighted (adjusted for cash flows). Market indexes are unmanaged and, therefore, have no expenses. Investors cannot invest directly in an index. There have been periods when the fund has lagged the index. Past results are not predictive of results in future periods. For additional American Fund results compared to its benchmark, click here.
For those in transition, our 2030 vintage has delivered an impressive 1.16% in average annual excess return.
Scenario philosophy:
This simulation approximates the experience of a mid-career participant who invested in the Series at its inception in February 2007 and expects to retire in 2030.
Assumptions:
Salary: $65,000 per year initially growing by 3% annually
Initial investment: $150,000 on February 1, 2007
Contribution rate: 10% annual contribution starting February 1, 2007
Source: Capital Group. Results are over fund lifetime through December 31, 2022 (inception date: February 1, 2007).
AFTD excess return is calculated as the difference in return between the American Funds 2030 Target Date Retirement Fund and S&P Target Date 2030 Index. Returns are time-weighted (adjusted for cash flows). Market indexes are unmanaged and, therefore, have no expenses. Investors cannot invest directly in an index. There have been periods when the fund has lagged the index. Past results are not predictive of results in future periods. For additional American Fund results compared to its benchmark, click here.
For those in retirement, our 2010 vintage has delivered an average annual excess return of 0.65%.
Scenario philosophy:
This simulation approximates the experience of a late-career participant who invested in the Series at its inception in February 2007 before retiring in 2010.
Assumptions:
Salary: $100,000 per year initially growing by 3% annually until retirement on January 1, 2010
Initial investment: $800,000 on February 1, 2007
Contribution rate: 10% annual contribution starting February 1, 2007 until retirement on January 1, 2010
Withdrawal rate: 4% withdrawal of $800,000 increasing by 2% per year
Source: Capital Group. Results are over fund lifetime through December 31, 2022 (inception date: February 1, 2007).
AFTD excess return is calculated as the difference in return between the American Funds 2010 Target Date Retirement Fund and S&P Target Date 2010 Index. Returns are time-weighted (adjusted for cash flows). Market indexes are unmanaged and, therefore, have no expenses. Investors cannot invest directly in an index. There have been periods when the fund has lagged the index. Past results are not predictive of results in future periods. For additional American Fund results compared to its benchmark, click here.
Our funds have delivered peer-beating results and held up well in down markets.
We encourage a focus not just on expenses but on value delivered to participants.
Our glide path is different. While our Series changes the mix between stocks and bonds, it also changes the types of assets held. This is designed to better align with participant needs over time.
Our Target Date Solutions Committee, which oversees the Series, brings a diversity of experience and draws on the fundamental research and quantitative resources of the global Capital Group team.
Years of experience as of December 31, 2022.
Global research offices
Capital Group has a distinctive, long-term global investment approach that relies on fundamental research. Privately held since its founding in 1931 and with more than $2.2 trillion under management, the firm has more than 472 investment professionals worldwide.*
Global research offices
Global research offices:
Los Angeles |
Geneva |
San Francisco |
Mumbai |
New York |
Hong Kong |
Washington, D.C. |
Tokyo |
Toronto |
Singapore |
London |
|
Our team is ready to help you help participants.
Important investment disclosures
Figures shown are past results and are not predictive of results in future periods. Current and future results may be lower or higher than those shown. Investing for short periods makes losses more likely. Prices and returns will vary, so investors may lose money. View mutual fund expense ratios and returns.
Investments are not FDIC-insured, nor are they deposits of or guaranteed by a bank or any other entity, so they may lose value.
Investors should carefully consider investment objectives, risks, charges and expenses. This and other important information is contained in the fund prospectuses and summary prospectuses, which can be obtained from a financial professional and should be read carefully before investing.
Investments in mortgage-related securities involve additional risks, such as prepayment risk.
The use of derivatives involves a variety of risks, which may be different from, or greater than, the risks associated with investing in traditional securities, such as stocks and bonds.
Fund shares of U.S. Government Securities Fund are not guaranteed by the U.S. government.
Allocations may not achieve investment objectives. The portfolios' risks are directly related to the risks of the underlying funds.
Lower rated bonds are subject to greater fluctuations in value and risk of loss of income and principal than higher rated bonds.
The return of principal for bond funds and for funds with significant underlying bond holdings is not guaranteed. Fund shares are subject to the same interest rate, inflation and credit risks associated with the underlying bond holdings.
While not directly correlated to changes in interest rates, the values of inflation-linked bonds generally fluctuate in response to changes in real interest rates and may experience greater losses than other debt securities with similar durations.
Although the target date portfolios are managed for investors on a projected retirement date time frame, the allocation strategy does not guarantee that investors' retirement goals will be met. Investment professionals manage the portfolio, moving it from a more growth-oriented strategy to a more income-oriented focus as the target date gets closer. The target date is the year that corresponds roughly to the year in which an investor is assumed to retire and begin taking withdrawals. Investment professionals continue to manage each portfolio for approximately 30 years after it reaches its target date.
Investing outside the United States involves risks, such as currency fluctuations, periods of illiquidity and price volatility. These risks may be heightened in connection with investments in developing countries.
Small-company stocks entail additional risks, and they can fluctuate in price more than larger company stocks.
Capital Group offers a range of share classes designed to meet the needs of retirement plan sponsors and participants. The different share classes incorporate varying levels of financial professional compensation and service provider payments. Because Class R-6 shares do not include any recordkeeping payments, expenses are lower and results are higher. Other share classes that include recordkeeping costs have higher expenses and lower results than Class R-6.
There may have been periods when the results lagged the index(es). The indexes are unmanaged and, therefore, have no expenses. Investors cannot invest directly in an index.
Each S&P Index ("Index") shown is a product of S&P Dow Jones Indices LLC and/or its affiliates and has been licensed for use by Capital Group. Copyright © 2023 S&P Dow Jones Indices LLC, a division of S&P Global, and/or its affiliates. All rights reserved. Redistribution or reproduction in whole or in part is prohibited without written permission of S&P Dow Jones Indices LLC.
Statements attributed to an individual represent the opinions of that individual as of the date published and do not necessarily reflect the opinions of Capital Group or its affiliates. This information is intended to highlight issues and should not be considered advice, an endorsement or a recommendation.
All Capital Group trademarks mentioned are owned by The Capital Group Companies, Inc., an affiliated company or fund. All other company and product names mentioned are the property of their respective companies.
Investment results assume all distributions are reinvested and reflect applicable fees and expenses.
When applicable, results reflect fee waivers and/or expense reimbursements, without which they would have been lower and net expenses higher. Please see capitalgroup.com for more information. Read details about how waivers and/or reimbursements affect the results for each fund. View results and yields without fee waiver and/or expense reimbursement.
Certain share classes were offered after the inception dates of some funds. Results for these shares prior to the dates of first sale are hypothetical based on the original share class results without a sales charge, adjusted for typical estimated expenses.
Use of this website is intended for U.S. residents only. Use of this website and materials is also subject to approval by your home office.
American Funds Distributors, Inc., member FINRA.
This content, developed by Capital Group, home of American Funds, should not be used as a primary basis for investment decisions and is not intended to serve as impartial investment or fiduciary advice.
©2023 Morningstar, Inc. All Rights Reserved. Some of the information contained herein: (1) is proprietary to Morningstar and/or its content providers; (2) may not be copied or distributed; and (3) is not warranted to be accurate, complete or timely. Neither Morningstar, its content providers nor Capital Group are responsible for any damages or losses arising from any use of this information. Past performance is no guarantee of future results. Information is calculated by Morningstar. Due to differing calculation methods, the figures shown here may differ from those calculated by Capital Group.
Morningstar categories
American Funds Target Date 2010 |
Morningstar Target Date 2000–2010 |
American Funds Target Date 2015 |
Morningstar Target Date 2015 |
American Funds Target Date 2020 |
Morningstar Target Date 2020 |
American Funds Target Date 2025 |
Morningstar Target Date 2025 |
American Funds Target Date 2030 |
Morningstar Target Date 2030 |
American Funds Target Date 2035 |
Morningstar Target Date 2035 |
American Funds Target Date 2040 |
Morningstar Target Date 2040 |
American Funds Target Date 2045 |
Morningstar Target Date 2045 |
American Funds Target Date 2050 |
Morningstar Target Date 2050 |
American Funds Target Date 2055 |
Morningstar Target Date 2055 |
American Funds Target Date 2060 |
Morningstar Target Date 2060 |
American Funds Target Date 2065 |
Morningstar Target Date 2065+ |
Index definitions
The S&P Target Date Series comprises 12 multi-asset class indexes, each corresponding to a particular target retirement date. Each index provides varying levels of exposure to equities and fixed income. Each target date allocation is created and retired according to a predetermined schedule related to the respective target date.
For quarterly updates of fund allocations, click here.