Risk What nearly 2,400 advisor portfolios reveal about risk

5 MIN ARTICLE

KEY TAKEAWAYS

  • Market broadening calls for a selective approach to U.S. growth
  • Non-U.S. stocks may offer diversification and upside
  • Core bonds may be poised for strong results
  • Municipal bonds appear positioned for a strong rebound

It’s challenging to determine where markets are headed in the current environment. Record-high domestic equity markets, elevated oil prices and economic uncertainty — all impacted by rapidly evolving and unstable geopolitical conflicts — have created a volatile investment climate. Are advisors’ portfolios positioned to protect against potential downside while also being able to take advantage of new opportunities?


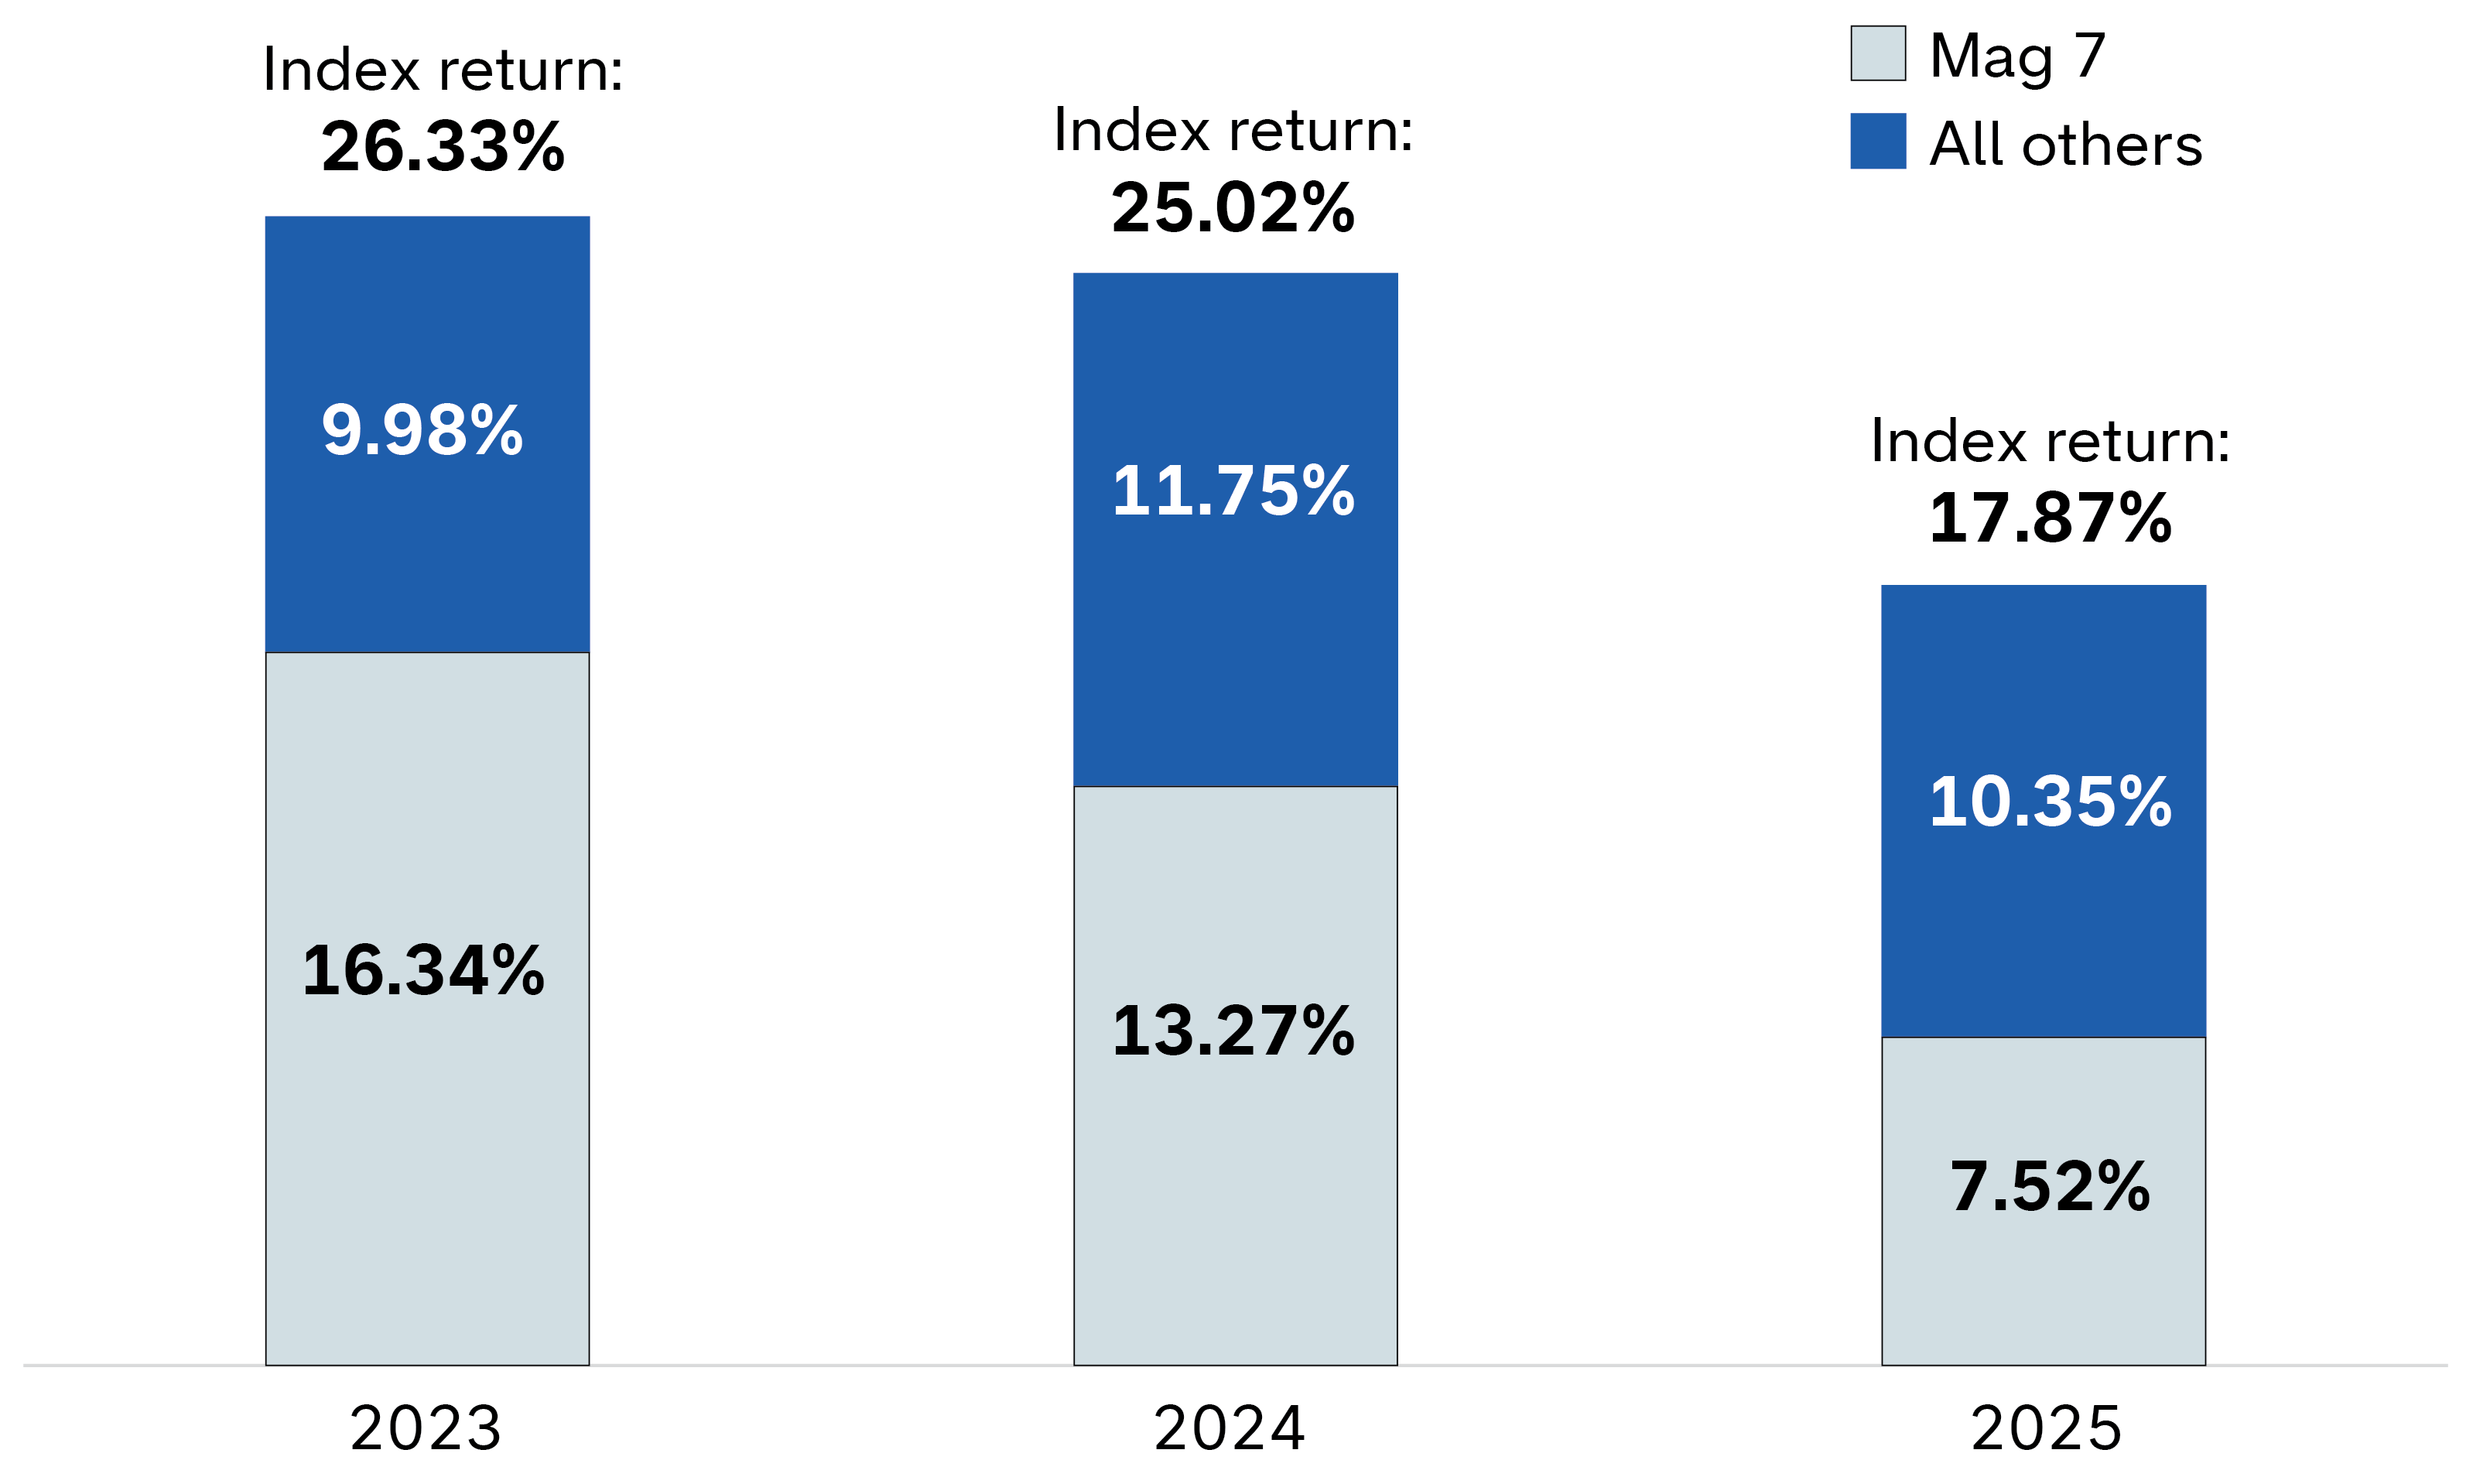
Our analysis of nearly 2,400 advisor portfolios as of March 31, 2026, suggests that investors with large weightings in U.S. passive indexes may not be sufficiently diversified to withstand increasing market volatility. However, this may be reduced by the continued broadening of S&P 500 returns beyond the Magnificent Seven and opportunities for investors to diversify their portfolios through international equities and core and municipal bonds. Advisors should consider a more active approach to capitalize on these opportunities. 


Here are four trends that make the case for taking a stronger active approach in portfolios: 

1. Market broadening calls for taking a selective approach to U.S. growth


We continue to see greater flows into U.S. passive equities than into active, but portfolios focused on top-heavy U.S. equity indexes may be taking on too much risk and missing opportunities. “The Magnificent Seven continue to account for a significant part of the index, leaving investors vulnerable to potential pullbacks. At the same time, we’re seeing Mag Seven dominance continue to diminish, as investors find greater opportunities in other stocks,” says Mark Barile, a senior manager on the Capital Group Portfolio Consulting and Analytics team. 

Mag Seven dominance is diminishing

Contribution to total return of S&P 500: Mag Seven vs. all other stocks

Stacked bar chart shows the contribution to total return of S&P 500 of the Magnificent 7 and all other stocks in 2023, 2024 and 2025. In 2023, the index return of 26.33% includes 16.34% from the Magnificent 7 and 9.98% from all other stocks. In 2024, the 25.02% return includes 13.27% from the Magnificent 7 and 11.75% from all others. In 2025, the 17.87% return includes 7.52% from the Magnificent 7 and 10.35% from all other stocks.

Source: Capital Group, Factset. As of December 31, 2025. Magnificent Seven is composed of: Alphabet (Google), Amazon, Apple, Meta, Microsoft, NVIDIA and Tesla. “All others” includes all remaining companies in the S&P 500 Index. Totals may not reconcile due to rounding.

Changing patterns of industry returns also suggest broadening. “We’ve seen greater variance in sector returns, with the materials and health care sectors offering diversification benefits in the face of weak technology hardware and software returns,” Barile says.

Changing patterns of industry returns also suggest broadening

Total returns for S&P 500 Index and select S&P 500 sectors/industries (%)

Line chart shows total returns for the S&P 500 Index and select S&P 500 sectors and industries from November 2025 through March 2026. The S&P 500 Index trends slightly downward, similar to the semiconductor and semiconductor equipment sector, with returns of roughly negative 5%. The energy and materials sectors rise more than the other industries shown, with energy at nearly 45% and materials at roughly 10% in total returns. The health care sector trends upward until March 2026 and levels off at roughly 0% total return. The software sector declines over the period and ends with total returns of roughly negative 30%.

Source: Capital Group, Morningstar. As of March 31, 2026. 

2. Seek to grow and diversify with non-U.S. stocks


“Non-U.S. equities may be poised for further gains,” says Jan Gundersen, head of Wealth Solutions. “We see a number of catalysts that could fuel additional increases. Amid a shift in regulatory mindset and broader unity in Europe, European fiscal stimulus and defense spending should benefit industrial stocks. Meanwhile, corporate governance reform in Asia could mean firms return more capital to shareholders and non-U.S. companies with significant revenue exposure outside the U.S. may be less affected by tariffs,” adds Gundersen.  

After years of lagging the U.S., international stocks soared above U.S. markets last year

Relative equity returns over rolling one-year periods

The area chart compares relative performance of international stocks versus U.S. stocks from 2016 through March 31, 2026, with the U.S. dollar index shown for context. The shaded areas below the U.S. sparkline and above zero on the x-axis show periods when U.S. stocks outperformed, while shaded areas below zero on the x-axis show international outperformance. The chart shows frequent shifts in leadership over time, with several periods of U.S. outperformance, particularly around 2024–2025, followed by renewed international outperformance in the latter stages of 2025 to the present.

Source: Capital Group, Intercontinental Exchange (ICE), MSCI, Standard & Poor’s. U.S. relative returns are represented by the S&P 500 Index; international relative returns are represented by the MSCI All Country World ex USA Index. Relative returns are measured on a rolling one-year monthly total return basis in USD. As of March 31, 2026. 

Investors looking for growth and diversification from U.S. assets should consider increasing their exposure to international equities. The wide range of potential markets to invest in abroad offers opportunities for active management to add value. And while passive international equity ETFs continue to be the top destination for investor flows, investors may be overlooking potential opportunities offered by an active approach.  


“The size and complexity of international markets create opportunities for discerning active managers,” Gundersen says.


Increasing exposure to developed international stocks can diversify U.S. exposure. “You can get very different sector exposures investing in developed non-U.S. equity,” Gundersen says. “Looking at the MSCI EAFE Index, for example, we can see that the top three sectors account for almost the exact same weight as the top three sectors in the S&P 500, but two of the three sectors are different, offering investors opportunities for diversification.” 

Non-U.S. sector composition can diversify U.S. exposure

Concentration (% of index) of top three sectors in U.S. and non-U.S. indices

Two donut charts compare sector concentration in the MSCI EAFE Index and the S&P 500 Index. The top three sectors account for 55% of the MSCI EAFE Index and include financials, industrials and health care. In the S&P 500 Index, the top three sectors represent 56% and include information technology, financials and communication services.

Source: Capital Group, as of March 31, 2026.

3. Core bonds may be poised for strong results


Amid rising volatility, advisors shouldn’t overlook core bonds as a source of diversification and return potential. While passive international equity ETF funds were the most popular destination for ETF flows in the first quarter of the year, passive bonds and active bonds were second and third, respectively. Historically, today’s yield levels have been associated with strong subsequent returns. 


"With a current yield of 4.6% (as of March 31), investors may be looking at attractive potential returns," Barile says, noting that when index starting yields were in a range of 4% to 6% from 1980 through 2020, the Bloomberg U.S. Aggregate Index returned 5.65% on average over the subsequent five years. "Active managers have the potential to boost returns even further," he adds. 

Current core bond yields suggest relatively high return potential

Average annualized 5-year forward return relative to average starting yield-to-worst for the U.S. Bloomberg Aggregate Index (%)

Bar chart shows average annualized five-year forward return relative to the average starting yields-to-worst for the U.S. Bloomberg Aggregate Index by percentage. Returns increase as starting yields rise, from about 1.1% for yields of 0% to 2% up to about 7.35% for yields of 6% to 8%. A dashed line marks the current yield of 4.6% as of March 31, 2026.

Sources: Capital Group, Bloomberg. Based on monthly yield-to-worst data from 1980 through 2020, as of March 31, 2026. Yields to worst were bucketed into four ranges, and the subsequent five-year annualized returns within each bucket were averaged. Not all available ranges are shown here. “N” indicates the number of observations in each range. Current yield as of March 31, 2026.

Investors should consider using core bonds as ballast and to help ground core-plus allocations. “It’s important to be selective investing in core-plus, as the average core-plus fund can contain unintentional levels of portfolio risk,” Barile says. “A strong core-plus allocation or core/multisector combination has provided a stronger risk-return profile than investing in an average core-plus fund alone.” 

Core-plus funds can differ meaningfully in their risk-return profiles

Read important information.*

Scatter plot shows the three-year annualized return versus three-year standard deviation for the Capital Group Core Plus Income ETF and the core-plus category average. The Capital Group Core Plus Income ETF shows a higher return, at nearly 4.65%, with a lower three-year standard deviation of about 5.45. The core-plus category average had a higher risk, at just above 5.5, and a lower three-year annualized return, at roughly 4.30%.

Sources: Capital Group, Morningstar, as of March 31, 2026. Results for the ETF are net asset value. Core-Plus average reflects the Morningstar Intermediate Core-Plus Bond Category Average. Results and standard deviation for the Morningstar Intermediate Core-Plus Bond Category Average are as follows for these periods ended March 31, 2026: Annualized return: 1-year, 4.51%; 5-year, 0.70%; 10-year, 2.30%. Standard deviation: 5-year, 6.31%; 10-year, 5.33%. Annualized standard deviation (based on monthly returns) is a common measure of absolute volatility that tells how returns over time have varied from the mean. A lower number signifies lower volatility. 

Funds

Inception date

1 year

5 years

10 years

Lifetime

Gross expense ratio (%)

CGCP — Capital Group Core Plus Income ETF

2/22/2022

0.34

— NAV returns


4.68

1.67

— Market price returns


4.73

1.68

4. Municipal bonds appear positioned for a strong rebound 


Tax-equivalent yields are attractive even for investors in lower tax brackets. “Current muni yields are appealing. Investors should be considering them as a key part of their fixed income portfolio, regardless of their tax bracket,” Gundersen says. 

Tax-equivalent yields are attractive

Bloomberg Municipal Bond Index
Tax-equivalent yield (%)

Bar chart shows tax‑equivalent yield across three tax scenarios, highlighting the breakeven tax rate. The no‑tax‑impact scenario shows a yield of 3.8%. At a 17.0% federal tax rate, the yield increases to 4.6%. At the highest federal tax rate of 40.8%, the yield rises to 6.4%. Reference lines show a cash proxy, represented by the 3‑month Treasury bill, at about 3.7%, and a core taxable yield for the Bloomberg U.S. Aggregate Index at about 4.6%, indicating that tax-equivalent yields are attractive.

Sources: Capital Group, Bloomberg Index Services, Ltd. As of March 31, 2026. The after-tax (or tax-equivalent) yield of a municipal bond investment is used to assess its attractiveness relative to taxable bonds; put simply, it’s the answer to the question: What yield would a taxable bond have to offer in order for it to offer the same amount as this municipal bond investment, after tax? Tax-equivalent yield calculation is yield to worst /(1-(federal tax rate)). The federal tax rate consists of an income tax rate and Medicare tax rate of up to 37% and 3.8%, respectively. 

Keep in mind that periods of lagging municipal bond performance have often set the stage for strong excess returns. “If historical patterns hold true, weaker performance in 2025 may bode well for 2026 and beyond,” he adds.

Munis have outpaced taxable bonds in two-year periods following calendar years when they lagged

Cumulative excess return of munis vs. Bloomberg U.S. Aggregate Index (bps)

Bar chart shows recent calendar years when municipal bonds, as represented by the Bloomberg Municipal Bond Index, underperformed relative to taxable bonds, as measured by the Bloomberg U.S. Aggregate Index. In each case, municipals went on to outpace taxable bonds for the following two-year period. Years shown are 2010, 2013, 2016, 2019 and 2020, with subsequent cumulative two-year excess returns ranging from 96 to 721 basis points and municipal underperformance ranging from negative 53 to negative 416 basis points. A final bar for 2025 shows municipal underperformance of negative 306 basis points, with future two-year results not yet available and represented in the chart with a question mark.

Sources: Capital Group, Bloomberg Index Services, Morningstar. As of 12/31/25. Data shown for the last five calendar years when the Bloomberg U.S. Aggregate Index outpaced the Bloomberg Municipal Bond Index (dark blue) and the Bloomberg Municipal Bond excess return over the Bloomberg U.S. Aggregate Index for the two calendar years that followed (light blue). 

Municipal bonds are an asset class well-suited to active management. “Structural issues mean that active management can potentially add value in municipal bonds in diverse market environments,” Gundersen says. “And strong municipal bond issuance in recent years has created additional opportunities for active investment,” he adds. Despite this, flows into passive muni strategies continue to slightly outpace flows into active muni strategies, according to Morningstar.

Bottom line


Our analysis of nearly 2,400 advisor portfolios suggests that many have too much passive U.S. exposure, leaving them vulnerable to unintended risks while also missing out on new opportunities. A more active approach — focused on security selection and diversification across U.S. and non U.S. equities, core bonds and municipals — may help portfolios navigate volatility while staying aligned with long-term objectives. In an environment defined by uncertainty and change, portfolio construction decisions may matter more than ever.

Want to talk about how to diversify your portfolio?

Mark Barile is a Senior Manager, Portfolio Consulting and Analytics with 20 years of industry experience as of 12/31/2025. He holds a bachelor's degree in studio art from Trinity University. He also holds the Certified Investment Management Analyst® designation.

Jan Gundersen is head of Wealth Solutions with 27 years of investment industry experience. He holds a master’s degree in oceanography from Texas A&M University and a bachelor’s degree in geology from Colgate University. He also holds the Chartered Financial Analyst® designation.

*Figures shown are past results and are not predictive of results in future periods. Current and future results may be lower or higher than those shown. Prices and returns will vary, so investors may lose money. Investing for short periods makes losses more likely. For exchange traded funds (ETFs), price returns are determined using the official closing price of the fund’s shares and do not represent the returns you would receive if you traded shares at other times. View ETF expense ratios and returns.


This content is intended for financial professionals only. Not for use with the public.

Investments are not FDIC-insured, nor are they deposits of or guaranteed by a bank or any other entity, so they may lose value.
Investors should carefully consider investment objectives, risks, charges and expenses. This and other important information is contained in the ETF prospectuses and summary prospectuses, which can be obtained from a financial professional and should be read carefully before investing.
Capital Group exchange-traded funds (ETFs) are actively managed and do not seek to replicate a specific index. ETF shares are bought and sold through an exchange at the then current market price, not net asset value (NAV), and are not individually redeemed from the fund. Shares may trade at a premium or discount to their NAV when traded on an exchange. Brokerage commissions will reduce returns. There can be no guarantee that an active market for ETFs will develop or be maintained, or that the ETF's listing will continue or remain unchanged.
Investments in mortgage-related securities involve additional risks, such as prepayment risk.
The use of derivatives involves a variety of risks, which may be different from, or greater than, the risks associated with investing in traditional securities, such as stocks and bonds.
Lower rated bonds are subject to greater fluctuations in value and risk of loss of income and principal than higher rated bonds.
The return of principal for bond portfolios and portfolios with significant underlying bond holdings is not guaranteed. Investments are subject to the same interest rate, inflation and credit risks associated with the underlying bond holdings.
Frequent and active trading of portfolio securities may occur, which may involve correspondingly greater transaction costs, adversely affecting the results.
Investing outside the United States involves risks, such as currency fluctuations, periods of illiquidity and price volatility. These risks may be heightened in connection with investments in developing countries.
Statements attributed to an individual represent the opinions of that individual as of the date published and do not necessarily reflect the opinions of Capital Group or its affiliates. This information is intended to highlight issues and should not be considered advice, an endorsement or a recommendation.
All Capital Group trademarks mentioned are owned by The Capital Group Companies, Inc., an affiliated company or fund. All other company and product names mentioned are the property of their respective companies.
Use of this website is intended for U.S. residents only.
Advisory services offered through Capital Research and Management Company (CRMC) and its RIA affiliates.
This content, developed by Capital Group, home of American Funds, should not be used as a primary basis for investment decisions and is not intended to serve as impartial investment or fiduciary advice.

Capital Group exchange-traded funds (ETFs) are actively managed and do not seek to replicate a specific index. ETF shares are bought and sold through an exchange at the then current market price, not net asset value (NAV), and are not individually redeemed from the fund. Shares may trade at a premium or discount to their NAV when traded on an exchange. Brokerage commissions will reduce returns. There can be no guarantee that an active market for ETFs will develop or be maintained, or that the ETF's listing will continue or remain unchanged.


For CGCP, the return of principal for bond portfolios and portfolios with significant underlying bond holdings is not guaranteed. Investments are subject to the same interest rate, inflation and credit risks associated with the underlying bond holdings. The use of derivatives involves a variety of risks, which may be different from, or greater than, the risks associated with investing in traditional securities, such as stocks and bonds. Lower rated bonds are subject to greater fluctuations in value and risk of loss of income and principal than higher rated bonds. Investing outside the United States involves risks, such as currency fluctuations, periods of illiquidity and price volatility. These risks may be heightened in connection with investments in developing countries. Investments in mortgage-related securities involve additional risks, such as prepayment risk. Frequent and active trading of portfolio securities may occur, which may involve correspondingly greater transaction costs, adversely affecting the results.