Risk 4 charts that expose market concentration risks

KEY TAKEAWAYS

  • Markets are now among the most concentrated in recent history.
  • AI concentration is a global phenomenon.
  • U.S. GDP relies heavily on AI spending.
  • AI fatigue is hitting the bond market.

Since ChatGPT launched in 2022, some AI-related stocks have soared to record highs despite elevated inflation, sweeping tariffs and war in the Middle East. A small group of companies now make up an outsized share of the market, pushing concentration to levels not seen in decades.


That means investors in some index funds may be holding unintended risks in their portfolios, since market capitalization-weighted funds, which weight companies based on their market value, are not as broadly diversified as many expect. The following four charts help put today’s market concentration in perspective and underscore the need for greater diversification.

1. Today’s markets are among the most concentrated in history

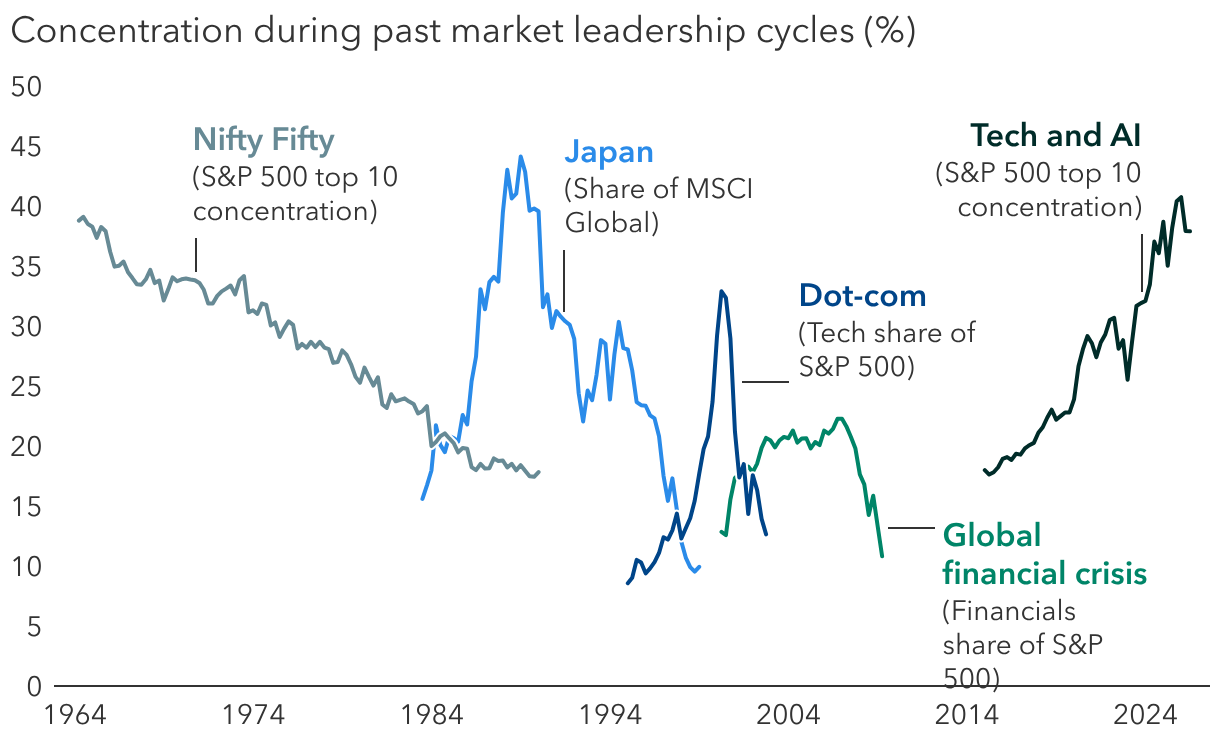
“We are living through an extraordinary market environment,” says chief investment officer Martin Romo in a recent commentary. Today’s market concentration stands out, with the top 10 companies approaching 40% of the S&P 500 Index.


We’ve seen this before. Similar levels of concentration emerged in Japan’s 1980s boom and the U.S. Nifty Fifty era. Specifically, in 1964, the top 10 stocks reached 39% of the S&P 500 Index. The largest holdings included AT&T, General Motors, ExxonMobil, IBM and Texaco — diverse businesses from a range of sectors.

Markets have long rallied around compelling investment themes

Sources: Capital Group, FactSet, MSCI, RIMES, S&P Global. Data shown is quarterly from March 31, 1964, to June 30, 2026. Data prior to 1964 is unavailable, so the full Nifty Fifty concentration cycle is not shown. Japan represented by the MSCI Japan Index. Top 10 concentration is defined as the share of index market capitalization represented by the 10 largest index constituents. Share represents the specified sector's percentage weight in the index.

Today’s concentration differs from the 1960s because many of the largest companies, including NVIDIA, Microsoft, Amazon and Micron Technology, are tied to a single theme: AI investment. As a result, semiconductor stocks, for example, could decline in tandem if demand for chips drops. “This is precisely what we have seen during the early July pullbacks in the market, which were led by companies such as SK hynix and Sandisk,” according to Brady Enright, portfolio manager for New Perspective Fund® and Fundamental Investors®.


Prior episodes of intense concentration eventually broke down, often painfully, before returning to more balanced levels. That doesn’t mean a market crash is imminent, nor are we predicting one. Concentration is not a timing tool, but it is a reminder that trees don’t grow to the sky.


As investors crowd into AI-related stocks, some high-quality businesses have been left behind. “These are companies with growing profits, strong dividends and durable franchises,” Enright says. “Many are trading at discounts to their historical valuations of 20% or more. Examples include Royal Caribbean, Procter & Gamble and Citigroup.”

2. AI concentration is a global phenomenon

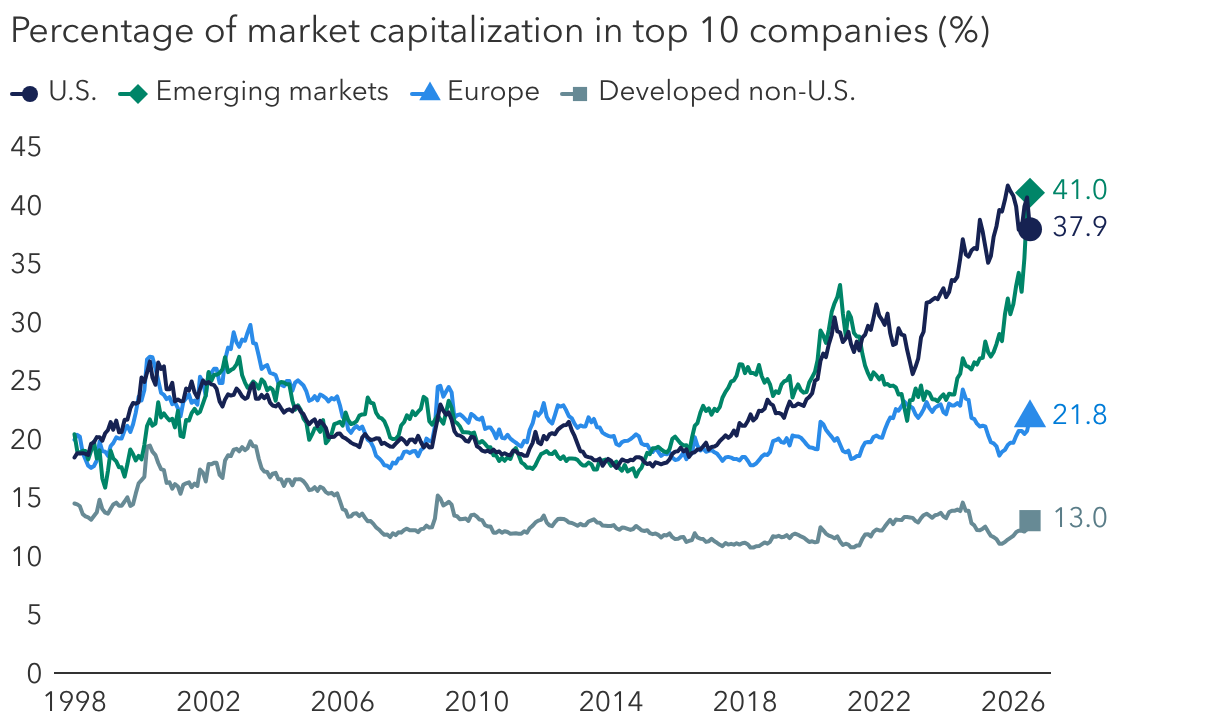
Market concentration is not limited to the U.S. The seemingly insatiable demand for specialized chips has catapulted technology companies in South Korea and Taiwan to new highs. The top 10 firms in the MSCI Emerging Markets Index account for 41% of its total market capitalization, with just three — SK hynix, Samsung Electronics and TSMC — making up 29%.

Worldwide demand for computer chips has fueled market concentration

Sources: Capital Group, FactSet, MSCI, S&P Global. Figures represent the index concentration of the top 10 companies by market capitalization across the MSCI Emerging Markets Index (Emerging markets), S&P 500 Index (U.S.), MSCI World ex USA (Developed non-U.S.) and MSCI Europe Index (Europe). Data shown is monthly, from January 31, 1998, through June 30, 2026.

Meanwhile, global markets continue to offer other attractive opportunities, particularly in Europe and parts of Asia, where valuations remain compelling. “In my view, there are real bargains outside the U.S. today, and often they can be found among world leaders in their industries,” says Steve Watson, a portfolio manager with New Perspective Fund®. “They just happen to be domiciled in other countries. They include companies like U.K.-based drug giant AstraZeneca and China-based Tencent, the largest gaming company in the world.


“I am also sifting through the artificial intelligence wreckage for companies that may have been unfairly hit by fears that easy-to-use AI applications will impair their business,” Watson continues. “Those include large software companies like Germany’s SAP, as well as companies in the online travel space, including China’s Trip.com and Spain’s Amadeus IT Group. These are AI enablers, in my view, not ‘AI roadkill.’”

3. U.S. GDP heavily relies on AI spending

Concentration risk extends beyond the top 10 stocks in the index to the broader U.S. economy. The data center build-out has supported U.S. growth, with AI-related investments contributing nearly 1% to real GDP in the first nine months of 2025, or 39% of overall growth during that period, according to the St. Louis Federal Reserve.


Thus, company earnings and the broader economy may be more vulnerable to an AI-induced slowdown. “The growing profit pools are all driven by the same physical build-out of data centers,” Enright says. “Chipmakers have grown the most because roughly 50% of data center-related costs are tied to semiconductors, but companies that provide heating and air conditioning, electricity, water treatment and transformers are also enjoying strong tailwinds.”

AI drives large parts of the global economy

A stacked bar chart showing the concentration of earnings, capital expenditures and contributions to U.S. real GDP. Samsung Electronics and SK hynix account for a large share of projected 2026 earnings in South Korea, while Taiwan Semiconductor Manufacturing does the same in Taiwan. In the U.S., the Magnificent Seven continues to account for a large share of earnings and capital expenditures. AI-related investment also represents a meaningful share of U.S. real GDP.

Sources: Capital Group, FactSet, MSCI, S&P Global, Hannah Rubinton and Bontu Ankit Patro, “Tracking AI’s Contribution to GDP Growth,” St. Louis Fed On the Economy, January 12, 2026. Estimates as of June 30, 2026. Earnings and capital expenditure (capex) estimates for 2026 represent the mean industry analyst consensus for the year ending December 2026. South Korea is represented by the MSCI Korea Index, Taiwan by the MSCI Taiwan Index and the U.S. by the S&P 500 Index. The Magnificent Seven (Mag 7) refers to Alphabet, Amazon, Apple, Meta Platforms, Microsoft, NVIDIA and Tesla. Share of U.S. real GDP represent Federal Reserve economists' estimates of AI investment's contribution to economic growth during the first nine months of 2025.

According to Enright, the next chapter of the story may be about beneficiaries outside of the capex boom. “I’m focused on identifying companies that can use AI to gain a competitive advantage they haven’t had historically. Within industries such as financials and healthcare, I expect certain companies will use AI in ways that will help them grow faster or become more profitable relative to competitors.”

4. AI fatigue is hitting the bond market

Another corner of the AI boom showing signs of strain is the U.S. corporate bond market. “The tsunami of bond deals has weighed on the debt prices of high-profile companies including Meta, Amazon and SpaceX,” says Damien McCann, portfolio manager for CGMS — Capital Group U.S. Multi-Sector Income ETF. Today, hyperscalers including Alphabet and Meta account for roughly 4.8% of the total market value of the Bloomberg U.S. Corporate Investment Grade Index, an increase of 78% from a year earlier.

AI-related companies have flooded debt markets

A bar chart showing hyperscalers' share of the U.S. corporate bond market climbed from 2.7% in June 2025 to 4.8% in July 2026, an increase of about 80%.

Sources: Capital Group, Bloomberg. Hyperscalers include Alphabet, Amazon, Meta, Microsoft, Oracle and SpaceX, which are investing significantly in AI, cloud computing and data center infrastructure to support the AI build-out. Corporate bonds are represented by the Bloomberg U.S. Corporate Investment Grade Index.

“The sheer volume of deals tied to AI underscores the importance of diversification in fixed income, particularly because bond prices tend to have more downside risk than upside potential,” McCann says. “I’m evaluating these opportunities one by one. Some hyperscalers offer attractive yields relative to their strong cash flows and credit ratings, but I’m more selective when it comes to certain newer project financing structures.”


Despite the surge in issuance, McCann remains constructive on the broader credit market. “Strong corporate earnings, healthy consumer spending and a resilient labor market provide a supportive backdrop for credit. I don’t believe AI-related borrowing will derail that picture, but it reinforces the value of maintaining exposure across investment-grade (BBB/Baa and above) and high-yield corporate bonds, securitized credit and emerging markets.”

A call to rebalance and diversify

The market concentration in AI reveals some of the trade-offs tied to investing in index funds. “There is a common misperception that index funds somehow are safer for most investors,” says Jody Jonsson, vice chair of Capital Group. “Passive funds are cheaper on average. But cheaper is not the same as safer, nor does cheaper equate to better investor outcomes.”


Romo adds, “This is not an argument against owning the companies driving the artificial intelligence era. Many are extraordinary businesses with durable prospects. The point is, at today’s weights and valuations, the benchmarks — and the passive strategies following them — increasingly assume one set of outcomes will dominate.”


As a first step, investors should make certain their portfolios are broadly diversified beyond highly concentrated indexes. Start by evaluating the percentage of your holdings that are in a handful of companies tied to the AI theme. It may be a good time to add exposure to old economy sectors in addition to well-positioned companies outside the U.S.


A more balanced approach calls for investors to review their risks, both intended and unintended. According to Romo, “The winners of this current period will need to be both bold and humble. Bold enough to own great companies when the fundamentals justify it. Humble enough to recognize that no single theme, however powerful, should dictate the shape of portfolios. Bold enough to differ from the benchmark when risk and reward call for it. Humble enough to know that being different can be uncomfortable but necessary, especially when a narrow market continues to rise.”

Martin Romo is chair and chief investment officer of Capital Group. He is also an equity portfolio manager with 33 years of investment industry experience (as of 12/31/2025). He holds an MBA from Stanford and a bachelor's degree in architecture from the University of California, Berkeley.

Brady Enright is an equity portfolio manager with 35 years of investment industry experience (as of 12/31/2025). He holds an MBA from Harvard and a bachelor’s degree in biology from Stanford University.

Steve Watson is an equity portfolio manager with 38 years of investment industry experience (as of 12/31/25). He has an MBA and an MA in French studies from New York University as well as a bachelor's degree from the University of Massachusetts.

Damien McCann is a fixed income portfolio manager with 26 years of investment industry experience (as of 12/31/2025). He holds a bachelor’s degree in business administration with an emphasis on finance from California State University, Northridge. He also holds the Chartered Financial Analyst® designation.

Jody Jonsson is vice chair of Capital Group. She has 39 years of investment industry experience (as of 12/31/2025). She holds an MBA from Stanford and a bachelor’s degree in economics from Princeton.

Capitalization-weighted index funds weight companies according to their market capitalization, giving larger companies a bigger share of the portfolio.


Passive funds are not striving to outpace their benchmarks; rather, they seek to replicate the benchmark’s return pattern.


Hyperscalers are large-scale cloud service providers that offer computing power and storage to organizations and individuals globally.


Capital expenditure (capex) is money invested for acquisitions, upgrades, renovations and adaption. It can be tangible (i.e., real estate) or intangible (i.e., licenses, software).


Investing outside the United States involves risks, such as currency fluctuations, periods of illiquidity and price volatility, as more fully described in the prospectus. These risks may be heightened in connection with investments in developing countries.


Bond ratings, which typically range from AAA/Aaa (highest) to D (lowest), are assigned by credit rating agencies such as Standard & Poor's, Moody's and/or Fitch, as an indication of an issuer's creditworthiness.


The market indexes are unmanaged and, therefore, have no expenses. Investors cannot invest directly in an index.


Bloomberg U.S. Corporate Investment Grade Index represents the universe of investment-grade, publicly issued U.S. corporate and specified foreign debentures and secured notes that meet the specific maturity, liquidity and quality requirements.


MSCI Emerging Markets Index captures large- and mid-cap representation across 24 Emerging Markets (EM) countries.


MSCI Europe Index captures large- and mid-cap representation across 15 Developed Markets (DM) countries in Europe.


MSCI Japan Index is designed to measure the performance of the large- and mid-cap segments of the Japanese market.


MSCI Korea Index is designed to measure the performance of the large- and mid-cap segments of the South Korean market.


MSCI Taiwan Index is designed to measure the performance of the large- and mid-cap segments of the Taiwan market.


MSCI World ex USA Index captures large- and mid-cap representation across 22 of 23 Developed Markets (DM) countries, excluding the United States.


S&P 500 Index tracks the stocks of around 500 primarily large-cap, U.S. based companies.


Bloomberg Index Services Limited. Bloomberg® is a trademark and service mark of Bloomberg Finance L.P. and its affiliates (collectively “Bloomberg”). Bloomberg or Bloomberg’s licensors own all proprietary rights in the Bloomberg Indices. Neither Bloomberg nor Bloomberg’s licensors approves or endorses this material, or guarantees the accuracy or completeness of any information herein, or makes any warranty, express or implied, as to the results to be obtained therefrom and, to the maximum extent allowed by law, neither shall have any liability or responsibility for injury or damages arising in connection therewith.


Source: MSCI. The MSCI information may only be used for your internal use, may not be reproduced or redisseminated in any form and may not be used as a basis for or a component of any financial instruments or products or indices. None of the MSCI information is intended to constitute investment advice or a recommendation to make (or refrain from making) any kind of investment decision and may not be relied on as such. Historical data and analysis should not be taken as an indication or guarantee of any future performance analysis, forecast or prediction. The MSCI information is provided on an “as is” basis and the user of this information assumes the entire risk of any use made of this information. MSCI, each of its affiliates and each other person involved in or related to compiling, computing or creating any MSCI information (collectively, the “MSCI Parties”) expressly disclaims all warranties (including, without limitation, any warranties of originality, accuracy, completeness, timeliness, non-infringement, merchantability and fitness for a particular purpose) with respect to this information. Without limiting any of the foregoing, in no event shall any MSCI Party have any liability for any direct, indirect, special, incidental, punitive, consequential (including, without limitation, lost profits) or any other damages. Please visit the data provider’s website for more information.


The S&P 500 Index is a product of S&P Dow Jones Indices LLC and/or its affiliates and has been licensed for use by Capital Group. Copyright © 2026 S&P Dow Jones Indices LLC, a division of S&P Global, and/or its affiliates. All rights reserved. Redistribution or reproduction in whole or in part is prohibited without written permission of S&P Dow Jones Indices LLC.

Investments are not FDIC-insured, nor are they deposits of or guaranteed by a bank or any other entity, so they may lose value.
Investors should carefully consider investment objectives, risks, charges and expenses. This and other important information is contained in the fund prospectuses and/or summary prospectuses, which can be obtained from a financial professional and should be read carefully before investing.
Statements attributed to an individual represent the opinions of that individual as of the date published and do not necessarily reflect the opinions of Capital Group or its affiliates. This information is intended to highlight issues and should not be considered advice, an endorsement or a recommendation.
All Capital Group trademarks mentioned are owned by The Capital Group Companies, Inc., an affiliated company or fund. All other company and product names mentioned are the property of their respective companies.
Use of this website is intended for U.S. residents only. Use of this website and materials is also subject to approval by your home office.
Capital Client Group, Inc.
This content, developed by Capital Group, home of American Funds, should not be used as a primary basis for investment decisions and is not intended to serve as impartial investment or fiduciary advice.