Bonds 5 core bond themes for 2026: Defense now, offense later

Core fixed income reaffirmed its role as a cornerstone of well-balanced portfolios in 2025, delivering meaningful diversification alongside strong total returns. Supported by a resilient yet moderating economy, easing inflationary pressures and the start of a rate-cutting cycle, core bonds (as measured by the Bloomberg U.S. Aggregate Index) posted their strongest performance since 2019. The index advanced over 7% and generally provided positive returns during episodes of stock market volatility and drawdowns.


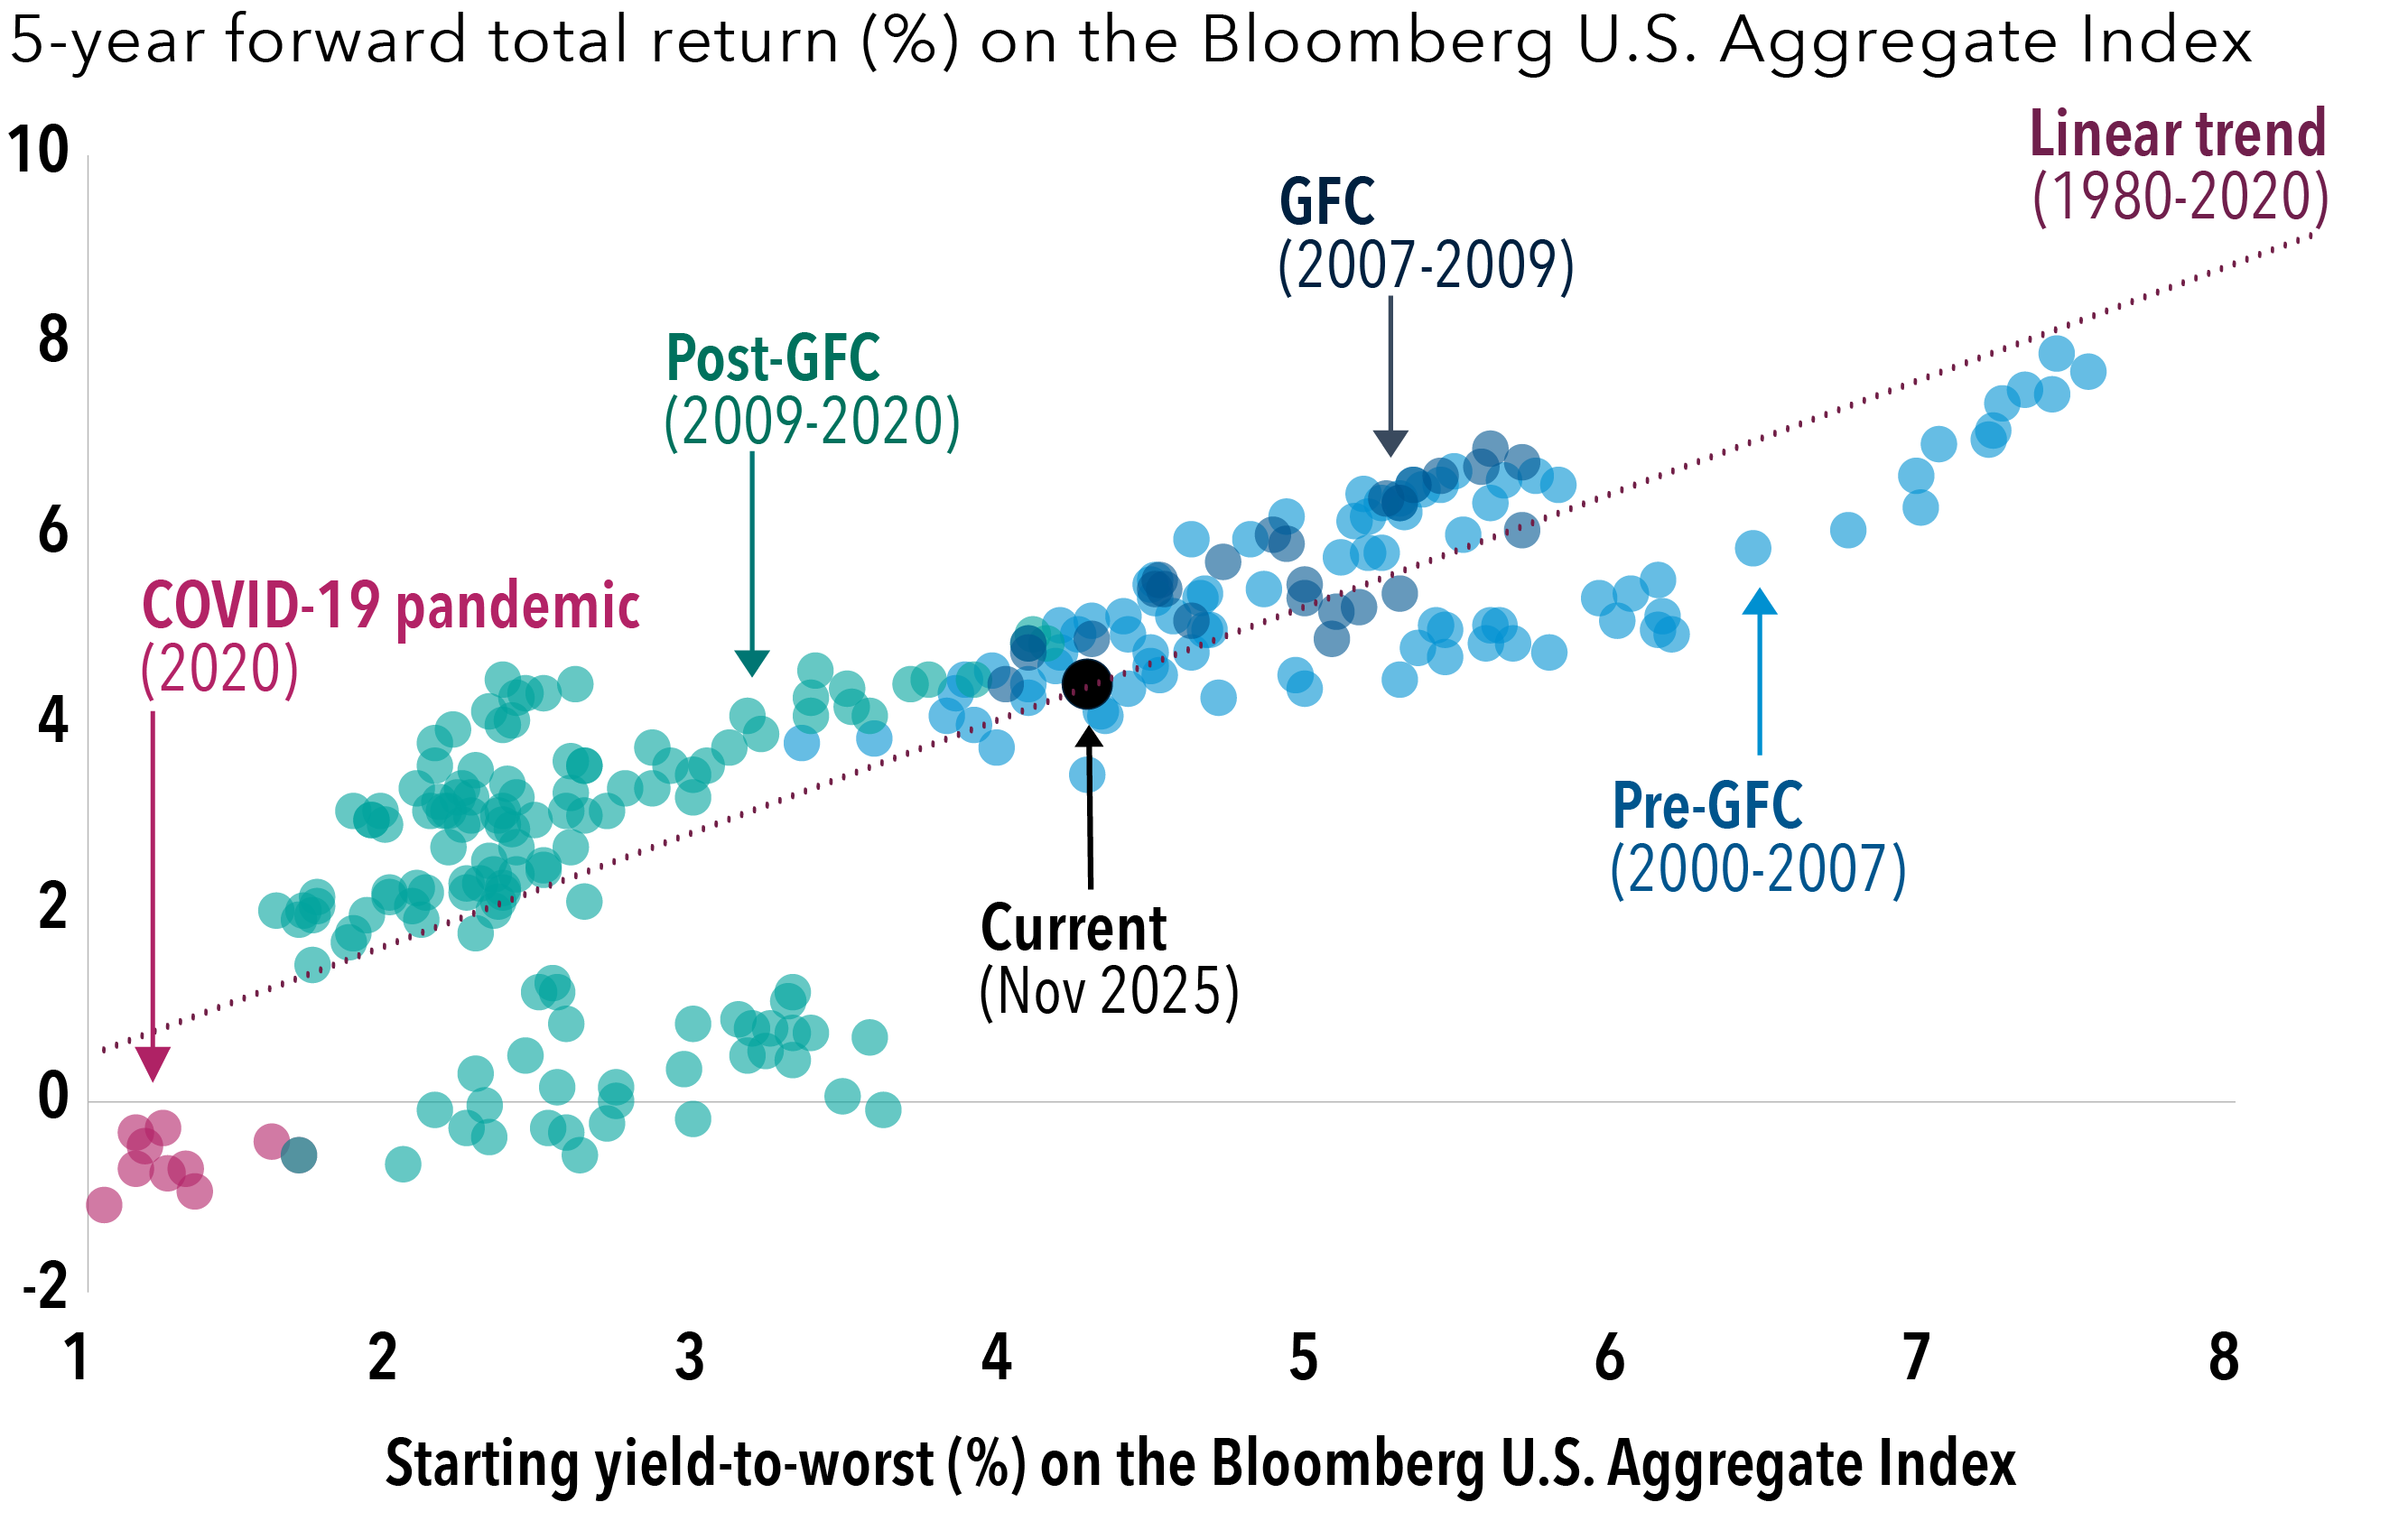
As we enter 2026, core bond yields have moderated from their October 2023 peak, but remain materially above their average over the past 15 years. With the Federal Reserve (Fed) expected to continue its easing cycle amid a soft labor market and inflation slowly trending toward their 2% target, conditions appear favorable for fixed income investors. In this environment, I expect total returns could once again exceed starting yields, which at the time of writing stand at 4.3%, reinforcing the attractiveness of core bonds as both an income source and a potential driver of capital appreciation.

Core bonds could be poised for strong results

A scatterplot shows the relationship between monthly starting yields (shown on the x-axis) and 5-year forward returns (shown on the y-axis) for the Bloomberg U.S. Aggregate Index. Each dot represents a month between January 2000 and November 2025. A dotted trend line cuts up and to the right, based on the broader history of yields and forward returns between 1980 - 2025, illustrating that as starting yields increase, forward returns tend to rise. A larger dot is highlighted near the middle of the range showing the current starting yield as of November 2025 along with the implied forward 5-year return based on the trend line.

Sources: Capital Group, Bloomberg. Dots = monthly figures starting across each period. "Current" value is based on latest starting yield-to-worst, using the historical linear trendline to approximate implied forward 5-year return. As of November 30, 2025. Past results are not predictive of results in future periods. Dates for periods shown: Pre-GFC: 1/1/00-4/30/07; GFC: 4/30/07-4/30/09; Post-GFC: 4/30/09-2/28/20; COVID-19 pandemic: 2/28/20-10/31/20. 

While my outlook for 2026 is optimistic, fixed income investors will need to contend with significant challenges and cross currents to maximize opportunities and manage risk. The global economy remains in flux as fiscal policy, geopolitics, global trade and monetary policy seek a new equilibrium. At the same time, an AI-driven investment cycle of historic proportions is unfolding. This could either lead to a year of robust growth and rising productivity or a massive bust if naysayers prove correct.


The ability to adapt to these shifts and respect valuations will be key to navigating fixed income markets in the year ahead. As such, I am positioning the core bond portfolios I manage to take advantage of the still elevated yield environment, while moving toward defense and resilience with a preference for higher quality exposures that could benefit if my positive outlook is threatened. 


Here are five themes that I believe will drive core bond markets in the coming year.

1. Fiscal dominance: Tariffs take center stage

Coming into 2025, I posited that we were entering a new era for investors, where the Fed would take a back seat to the government as a primary driver of markets. 


This has largely come to pass. Government policies — on everything from trade and immigration to taxes and regulation — have been key drivers of the economy, while the Federal Reserve has remained “data-dependent,” adjusting their stance based on the impact to growth and inflation.


Tariffs have been a signature policy for the current administration, driving profound and far-reaching changes in economic and trade dynamics. They have reduced trade deficits while stimulating domestic production and investment. As the economy adjusts to this new framework, consumption is likely to slow, and business investment should strengthen in the year ahead. This shift may pressure investments tied to U.S. consumer spending, such as the consumer discretionary sector. Conversely, strategies aligned with onshoring and capital investment stand to benefit from a favorable economic tailwind.


Another benefit of tariffs has been their contribution to U.S. government revenue. While the U.S. fiscal deficit remains large, the combination of significant tariff income and lower interest rates could improve the government’s financing gap. This could then anchor long-term yields and reduce a significant risk for bond investors.

Tariff revenue is growing significantly

Bar chart shows U.S. tariff revenue for 2022-2026. The totals for 2025 and 2026 are projected numbers based on current monthly revenue accruals. 2025 and 2026 are significantly higher than the preceding years, reaching nearly $300 billion and $400 billion, respectively, while 2022-2024 were all near $100 billion.

Sources: Capital Group, U.S. Treasury, Tax Foundation. Revenue for 2025 represents realized revenue through October 2025, with projections for November-December. Data as of 10/31/2025. 

2. AI and productivity gains underpin growth optimism

My base case anticipates a reacceleration of U.S. economic growth in 2026 following a brief slowdown early in the year. Under favorable conditions, GDP growth could average approximately 3%, materially exceeding most forecasts and the Congressional Budget Office’s estimated potential growth rate of 1.7%. 


Although tariffs are inherently stagflationary (lower growth and higher inflation), this impact could be offset by productivity gains driven by AI (boosting growth and lowering inflation), investments in energy infrastructure (boosting growth) and easier monetary policy (boosting growth). Under such conditions, the combination of these effects could lead to an acceleration of GDP growth even as job growth remains flat or negative. 


Given the deep pockets and strong cash flows of leading technology firms in the AI space, I believe this technology investment super-cycle will persist, potentially lifting U.S. productivity growth to 3–4% annually over the next five to 10 years. Such a boost to productivity would have profound implications for both economic growth and inflation, ultimately benefiting fixed income investors. For perspective, historical productivity has averaged 1–2%, with peaks of 2–3% following World War II and during the technology-driven boom of the late 1990s and early 2000s.

AI could boost productivity to unprecedented levels

Bar chart shows the annual average % change in productivity in the U.S. split out by business cycles from 1947 – 2025, and the long-term rate over the entire period, with a triangle showing where productivity could grow to with a potential boost from artificial intelligence. Over the time periods measured, productivity growth was under or below 2% in most business cycles. The long-term average growth rate is 2.1%. The two highest periods measured are 1947 – 1973 and 2001 – 2007, where productivity growth hit 2.7% and 2.8%, respectively. The triangle showing a potential growth level with AI is between 3% and 4%.

Sources: Capital Group, U.S. Bureau of Labor Statistics. Data as of September 4, 2025. Potential near-term level is for illustrative purposes only.

3. Contained inflation and a supportive Fed increase opportunities in interest rates

If inflation moderates as tariffs stabilize and AI-driven productivity rises, the Federal Reserve is likely to continue cutting rates amid cooling labor markets. In this environment where inflation remains above 2%, growth is above potential and the Fed is cutting short-term rates, I believe the yield curve will continue to steepen. 


Positioning for a steeper yield curve by favoring short- and intermediate-term bonds over longer term issuances can benefit portfolios under multiple scenarios. First, in a risk-off environment, short-term yields typically fall more rapidly than longer term yields as markets anticipate deeper Federal Reserve cuts. Second, in a risk-on environment where growth remains healthy while the Fed remains concerned about labor market weakness, short-term rates could remain depressed while long-term rates rise, leading to a steeper curve. This steepener position could also benefit if deficit concerns reignite.


Meanwhile, risks to the level of interest rates appear to be more balanced. I plan to be opportunistic around a neutral duration stance and adjust exposure as opportunities arise.

Key scenarios that could prompt an active curve steepener position

Line chart shows yields for U.S. treasuries of various maturities, including 2 year, 5 year, 10 year and 30 year securities. The line slopes upward from left to right, indicating that shorter-term Treasuries are offering lower yields than longer term bonds. The chart also spells out numerous scenarios that could push shorter-term yields lower or longer-term yields higher including: rising recession risk, falling inflation expectations or additional Fed cuts on the left hand side and deficit concerns worsen, loss of U.S. exceptionalism, inflation expectations rise and economic growth strengthens on the right hand side.

Source: Capital Group. Data as of December 16, 2025.

The key risk to this view is if inflation surprises to the upside or if the labor market reaccelerates before the Fed completes its current cutting cycle. In that scenario, the Fed might become more hawkish, which could lead to both higher interest rates and a flatter yield curve.

4. Valuations matter – Get paid for defense now, offense later

While it’s tempting to own riskier assets because fundamentals and the economic environment look positive, I am deterred by valuations, especially in corporate credit markets. Fixed income differs fundamentally from equities because the upside potential is capped. As valuations become richer, expected returns decline. On a standalone basis, corporate credit yields are high and suggest attractive forward returns. However, in a core bond portfolio context, the sector’s appeal relative to other sectors is diminished as investment-grade (BBB/Baa and above) credit spreads are near historic tight levels, indicating investors are receiving minimal compensation for taking on additional risk over Treasuries. This dynamic reinforces the importance of disciplined risk management and robust credit selection.

Credit spreads approach historically tight levels

Line chart shows credit spreads for high yield and investment-grade corporate bonds from 2010 to 2025. The most recent data shows spreads at or near their lowest level within the time period observed. Spreads for high yield bonds ranged from around 900 basis points at their highest to around 350 basis points at their lowest. Spreads for investment-grade bonds mostly have fluctuated between 100 and 150 basis points and current sit closer to 50 basis points. Both lines show notable spikes in 2020.

Source: Bloomberg. IG Corporates = Bloomberg U.S. Corporate Investment Grade Index. High yield = Bloomberg U.S. Corporate High Yield 2% Issuer Capped Index. Data as of December 15, 2025.

Within spread sectors, higher quality assets like agency mortgage-backed securities (MBS) and asset-backed securities (ABS) look more attractive than lower quality, longer duration corporates. But even these sectors have become less attractive after a very strong rally in 2025.


MBS, especially high-coupon issuances, have been a key area of focus in core portfolios because they offered extra nominal income and spread (in some cases comparable to or higher than investment-grade corporate credit), but with little to no credit risk and greater liquidity. However, with expectations for the Fed to cut rates in the coming year, I have moderated exposure to the highest coupon issuances (which are more vulnerable to prepayment risk) and moved down in coupon to bonds that are more protected from this risk.


Within ABS, I see select opportunities in bonds from conservative issuers that sit higher in the capital structure. These issuances offer strong investment income potential and can be held to maturity. Senior tranches, in particular, can act as yield-enhanced cash surrogates due to their quick amortizing nature, which provides additional liquidity to portfolios.


In commercial mortgage-backed securities (CMBS), many office exposures remain challenged, but the fundamentals underpinning multifamily housing, warehouses and other segments have remained intact, with strong cashflows in many sectors. 


By focusing on high-quality issuances and diversifying positions to reduce exposure to any single macro factor, core portfolios should be able to withstand market turbulence and maintain income. If a market correction occurs, losses should remain limited relative to risk-heavy strategies and should preserve room to add risk by deploying capital opportunistically into attractive bonds at more compelling valuations.

5. Global opportunities arise as U.S. builds trade barriers

Although the administration’s signature tariffs face numerous legal challenges, the trajectory toward protectionism appears firmly established. Regardless of the outcomes of pending legal cases, a secular shift appears to be underway with no quick return to pre-2018 free trade dynamics.


If the U.S. relinquishes its role as a primary source of global demand, other countries will need to establish new trade patterns and partnerships, creating more economic activity and opportunities outside the U.S. As global demand becomes less U.S.‑centric, the number of investable relative-value opportunities in non-U.S. rates and select credits could expand significantly.


In response to U.S. tariffs, many countries are leaning more heavily on fiscal stimulus and lower interest rates to provide domestic support. This should mean less downside risk than previously feared and more pockets of opportunity for investors. 

Growth may be converging across economies

Line chart shows year over year growth in real (inflation-adjusted) gross domestic product (GDP) from 2019 – 2025 for the U.S., U.K., Japan, German and the Euro Area with an projected section from 2025-2026. The chart shows a notable trough in 2020 followed by a sharp recovery. All of the economies listed have experienced a decline since 2021, although their individual results were relatively dispersed. Over the projected portion of the chart, representing forecasts from the International Monetary Fund, all of the lines converge to very close levels between one another.

Source: International Monetary Fund (IMF). Shaded area represents IMF forecasts. Data as of December 15, 2025.

As such, I believe exposure to Japan, Europe and select emerging markets looks more compelling as we enter 2026. Emerging market debt is not typically a large part of core bond funds, but there are some idiosyncratic opportunities where the risk/reward is attractive, such as select hard currency bonds in countries like Mexico. 

The bottom line

While 2026 is likely to include periods of volatility, my outlook for core fixed income is positive. Supported by above-trend growth, moderating inflation and a dovish Federal Reserve, core bonds could deliver returns exceeding the Bloomberg U.S. Aggregate Index's current yield of 4.3%. Should risk markets falter, core bond returns could rise even further, as high-quality bonds have once again demonstrated their role as an effective diversifier during recent equity market declines.


My overarching investment philosophy is defense now, offense later. When risk is not well compensated, as currently appears to be the case, I tilt defensive. And when volatility eventually rises, I shift to offense and buy riskier assets at cheaper prices. Therefore, our core fixed income team will continue seeking to build resilience in portfolios while valuations remain full.


Despite positive economic expectations, we have reduced credit exposure in core portfolios and shifted into higher quality bonds. I am being tactical on interest rates, waiting for better entry points to add or reduce duration risk while maintaining an overweight to shorter maturities that may benefit from a steeper yield curve. I am also looking globally for pockets of value, reflecting my view of a less U.S.-centric opportunity set. This positioning should allow the portfolios I manage to better withstand bouts of volatility while maintaining room to add should valuations become more attractive. This cyclical approach is a hallmark of my investment strategy, and I expect that these themes will be key to successfully navigating fixed income markets in 2026.

Pramod Atluri is a fixed income portfolio manager with 22 years of investment industry experience (as of 12/31/2025). He holds an MBA from Harvard and a bachelor's degree in biological chemistry from the University of Chicago. He is a CFA charterholder.


Bloomberg U.S. Aggregate Index represents the U.S. investment-grade fixed-rate bond market.


Bloomberg U.S. Corporate High Yield 2% Issuer Capped Index covers the universe of fixed-rate, non-investment-grade debt. The index limits the maximum exposure of any one issuer to 2%.


Bloomberg U.S. Corporate Investment Grade Index represents the universe of investment grade, publicly issued U.S. corporate and specified foreign debentures and secured notes that meet the specified maturity, liquidity and quality requirements.


The indexes are unmanaged and, therefore, have no expenses. Investors cannot invest directly in an index.


Investing outside the United States involves risks, such as currency fluctuations, periods of illiquidity and price volatility. These risks may be heightened in connection with investments in developing countries.


The value of fixed income securities may be affected by changing interest rates and changes in credit ratings of the securities.


Investments in mortgage-related securities involve additional risks, such as prepayment risk.


Bloomberg Index Services Limited. BLOOMBERG® is a trademark and service mark of Bloomberg Finance L.P. and its affiliates (collectively "Bloomberg"). Bloomberg or Bloomberg's licensors own all proprietary rights in the Bloomberg Indices. Neither Bloomberg nor Bloomberg's licensors approves or endorses this material, or guarantees the accuracy or completeness of any information herein, or makes any warranty, express or implied, as to the results to be obtained therefrom and, to the maximum extent allowed by law, neither shall have any liability or responsibility for injury or damages arising in connection therewith.

Investments are not FDIC-insured, nor are they deposits of or guaranteed by a bank or any other entity, so they may lose value.
Investors should carefully consider investment objectives, risks, charges and expenses. This and other important information is contained in the mutual fund prospectuses and summary prospectuses, which can be obtained from a financial professional and should be read carefully before investing.
Investing outside the United States involves risks, such as currency fluctuations, periods of illiquidity and price volatility. These risks may be heightened in connection with investments in developing countries.
The value of fixed income securities may be affected by changing interest rates and changes in credit ratings of the securities.
The return of principal for bond portfolios and for portfolios with significant underlying bond holdings is not guaranteed. Investments are subject to the same interest rate, inflation and credit risks associated with the underlying bond holdings.
Investments in mortgage-related securities involve additional risks, such as prepayment risk.
Unlike mutual fund shares, investments in U.S Treasuries are guaranteed by the U.S. government as to the payment of principal and interest. In addition, certificates of deposit (CDs) are FDIC-insured and, if held to maturity, offer a guaranteed return of principal.
There have been periods when the results lagged the index(es) and/or average(s). The indexes are unmanaged and, therefore, have no expenses. Investors cannot invest directly in an index.
Source: Bloomberg Index Services Limited. BLOOMBERG® is a trademark and service mark of Bloomberg Finance L.P. and its affiliates (collectively "Bloomberg"). Bloomberg or Bloomberg's licensors own all proprietary rights in the Bloomberg Indices. Neither Bloomberg nor Bloomberg's licensors approves or endorses this material, or guarantees the accuracy or completeness of any information herein, or makes any warranty, express or implied, as to the results to be obtained therefrom and, to the maximum extent allowed by law, neither shall have any liability or responsibility for injury or damages arising in connection therewith.
All Capital Group trademarks mentioned are owned by The Capital Group Companies, Inc., an affiliated company or fund. All other company and product names mentioned are the property of their respective companies.
Use of this website is intended for U.S. residents only. Use of this website and materials is also subject to approval by your home office.
Capital Client Group, Inc.
This content, developed by Capital Group, home of American Funds, should not be used as a primary basis for investment decisions and is not intended to serve as impartial investment or fiduciary advice.