BONDS Volatility puts a spotlight on short-term bonds

Geopolitical flare-ups, such as the ongoing conflict in Iran, reinforce a familiar market lesson: volatility rarely announces itself. As rate swings reshape the yield curve and investors look to steady portfolios, short-term bonds may be growing in their appeal for fixed income investors. 


The escalating war and its impact on energy markets has clouded the picture on inflation and growth, complicating the outlook for Fed policy moves. Market expectations for two to three rate cuts in 2026 have faded, with investors increasingly concerned that monetary policy may be driven by rising inflation. Yields have jumped across the curve in response, with pronounced moves at the front end.

Recent volatility has altered the shape of the yield curve

Line chart showing a U.S. Treasury yield curve comparison across maturities from 1 month to 30 year on two dates, February 27, 2026 and May 13, 2026. In February, yields start near 3.7% at the front end, dip to around 3.4% between 2  and 3 year maturities, then rise steadily to about 4.5% at 30 years. In May, yields are higher across maturities, rising gradually from about 3.7% at the front end to roughly 5.0% at 30 years.

Source: Bloomberg. As of 5/13/26. 

Investor demand for short-term bonds was already gaining traction well ahead of the repricing. Flows into short-term bond funds, as measured by the Morningstar Short-Term Bond category, attracted $33.8 billion last year, a sharp increase from roughly flat levels in 2024. Momentum has been even stronger in the ultrashort bond category, where funds typically have a duration under one year, which attracted $105.8 billion last year, making them the leading category for fixed income flows.


We believe this momentum into short-term bonds may persist, supported by three key factors:

1. Short-term bond yields remain attractive as reinvestment risk rises

The Fed’s aggressive rate-hiking cycle led the Treasury yield curve to deeply invert for more than two years, from mid-2022 into 2024—marking the longest such stretch on record. Short-term Treasury yields exceeded long-term yields, making short-term bonds and cash-like instruments such as money market funds particularly attractive. Investors in cash-like alternatives could earn income of over 5%, as seen in three-month Treasury bills from mid-2023 to late 2024, with minimal risk and little to no duration exposure, a rare setup that turned cash alternatives into a defensive stronghold.


But that period appears to be ending.


Yields on three-month Treasury bills, a proxy for cash-like investments, have tumbled from a peak of about 5.5% in October 2023 — the highest level in more than two decades — to about 3.7% as of May 19, 2026. As those yields fall, the reinvestment risk associated with cash-like investments is becoming more pronounced. In addition, regulatory reforms have exposed certain vehicles like institutional prime money market funds to liquidity fees that may impact portfolio risk.


With the appeal of cash-like alternatives potentially declining, investors may be reassessing where to find meaningful income without taking on excessive risk.


Short-term bond funds appear to be filling that gap. The yield to maturity on the Morningstar Short-Term Bond Category average reached 4.5% in March, outstripping cash-like yields by about 80 basis points (bps). While those short-term bond fund yields have declined from their post-hike peak of 5.8%, they remain elevated relative to an average of 2.2% in the period following the Global Financial Crisis starting around 2009.

Short-term bond fund yields are once again outpacing cash-like alternatives

Time-series line chart showing yields for 3 month Treasury bills and short term bonds from early 2021 through March 2026. Treasury bills begin near zero and short-term bonds begin near 1% in 2020, then rise sharply through 2022. Yields peak around the 5 to 6% range in 2023, followed by a gradual decline through 2024 and 2025. By the end of the period, short term bonds are shown at approximately 4.5%, while Treasury bills are lower at about 3.7%.

Source: Morningstar. Data as of 3/31/26. Short-term bond yields reflect yield-to-maturity on the Morningstar Short-Term Bond Category average. Unlike mutual fund shares, investments in U.S. Treasuries are guaranteed by the U.S. government as to the payment of principal and interest.

Returns in 2025 were relatively attractive as well; the Bloomberg U.S. Government/Credit (1–3 Years) Index posted a 5.35% gain while the ICE BofA 3-month U.S. Treasury Bill Index returned 4.18%. Looking ahead, the return potential for short-term bonds may remain strong. Front-end yields could remain relatively elevated if the Fed remains on hold and markets mull the potential for a prolonged pause.


At the same time, we anticipate that developing risks to the economic background may eventually force the Fed’s hand on rate cuts, making a compelling case for adding duration exposure.

2. Interest rate exposure may work to investors’ advantage

When the Fed shifted to rate cuts in late 2024, ending an aggressive 16-month campaign where it raised rates by a staggering 525 bps, it helped turn interest rate exposure from a headwind to a tailwind. Amid this reshaped fixed income landscape, short-term bonds are offering not only income but also the potential for price appreciation as yields fall.


Historically, short-term bonds have outperformed cash-like alternatives during periods when the Fed cuts or holds rates steady. The Bloomberg U.S. Government/Credit (1–3 Years) Index delivered annualized average monthly returns of 5% during Fed cutting cycles, aided by both duration exposure and income, and outpaced three-month Treasury bill returns by a substantial 210 bps. The index also posted higher returns in steady-rate environments.

Short-term bonds have outpaced cash-like alternatives when the Fed cut rates or held steady

A bar chart comparing the annualized average monthly returns of three-month Treasury bills, the Bloomberg Municipal 1 to 5 Year Index and the Bloomberg U S Gov/Credit 1 to 3 Year Index under different interest rate scenarios. The chart has two sections: Fed cutting periods and Fed steady periods. In the Fed cutting periods section, Treasury bills shows 2.9% while the muni index shows 4% and the gov/credit index shows 5.0%. In the Fed steady periods section, Treasury bills shows 1.2% while the muni index shows 2.6% and the gov/credit index shows 2.4%.

Sources: Capital Group, Bloomberg, Morningstar. Data as of 2/28/26. Cycle period returns shown are annualized average monthly returns for all months in each ongoing cycle period. Data begins in May 2005, the first period when returns are available for the Bloomberg Municipal Short (1-5 Years) Index. A cycle period is defined as Fed rate action changing and persisting for three months or more, with pauses noted when there was an inflection point of rate peak or trough hit in the prior period.

Portfolio managers remain agile in their views and portfolio positioning based on shifts in Fed policy — and how incoming data might influence its stance. They believe the Fed may have the ability to cut rates in 2026 as heightened energy prices and other developing risks exert downward pressure on growth, allowing the Fed to focus on the employment side of its mandate. While yields have moved higher due to the Middle East conflict, our base case remains for a more range-bound rate environment — roughly 4.0% to 4.5% on 10-year Treasury yields — with duration exposure looking more attractive on the higher end of that range and even more so if yields break above those ranges.


Managers continue to express conviction in further steepening of the yield curve, as Fed policy may skew dovish even as inflation risks stay elevated. This view has been expressed in certain portfolios as a higher exposure relative to their benchmarks on the front end of the curve while taking a short position on the longer end of the curve.

3. Selective credit exposure may drive excess returns

Short-duration actively managed portfolios offer a diverse opportunity set that can go far beyond short-term Treasuries and corporate bonds. Relative value opportunities across securitized debt — from asset-backed securities (ABS) to agency mortgages and commercial mortgage-backed securities (CMBS) — can be a meaningful driver of excess returns.


Portfolio managers favor high-quality securitized credit given attractive valuations and its diversification potential. A wide range of the securitized spectrum is structured with short-term tranches, and managers look for a compelling mix of collateral, structure, liquidity and valuations when researching deals. This part of the market requires extensive credit analysis and our firm’s deep research capabilities unearth idiosyncratic opportunities.

Securitized debt is offering attractive relative value opportunities

Horizontal bar chart showing option adjusted spreads, in basis points, for selected short duration fixed income sectors. Spreads are highest for AA CMBS (0–3 year) at 117 basis points, followed by AAA CMBS (0–3 year) at 85. BBB corporate bonds (1–3 year) show a spread of 72, while ABS (0–3 year) is at 62. A corporate bonds (1–3 year) are at 46,   AAA ABS (0–3 year) are at 45, MBS (0–3 year) are at 42 and the lowest spread shown is for AAA–AA corporate bonds (1–3 year) at 27 basis points.

Source: Bloomberg. Data as of 5/13/26. Securitized figures shown are subsets of the ICE BofA U.S. Fixed Rate CMBS Index, the ICE BofA U.S. Fixed Rate Asset Backed Securities Index and the ICE BofA U.S. Mortgage Backed Securities Index. Corporate index figures shown are subsets of the ICE BofA U.S. Corporate Index.

One standout example in ABS involves bonds backed by property and casualty insurance premiums. In this structure, a financing company pays the insurance carrier up front and extends a one-year loan to the borrower, usually a small- or medium-sized business, which repays monthly. If the borrower defaults, the insurance policy is canceled and the unearned premium is refunded—creating a short, high-quality cash flow with built-in downside protection. These senior AAA-rated bonds have traded at spreads in the 60 bps range, offering a compelling profile for short-duration investors seeking diversification and resilience.


In terms of corporate debt, valuations remain tight but there are structural reasons why spreads may stay compressed. Investor demand for high-quality, short-term investment-grade (BBB/Baa and above) bonds remains strong. Corporate fundamentals are supportive, though we see some signs of softening. Against this backdrop and assuming a range-bound rate environment, corporate debt can continue to perform well. The spread premium for holding lower-rated debt has compressed and managers favor holding higher-quality securities in this environment.


Across credit, sector and security selection remain critical. More broadly, signs of growing leverage, weakening equity cushions or deteriorating fundamentals could signal trouble for credit. In today’s tight spread environment, vigilance around these indicators remains key.


Still, short-term bonds have a notable advantage versus longer duration debt in navigating spread widening; their near-term maturities allow portfolio managers to hold positions to maturity, sidestepping the negative price impacts from spread widening.

The short-term advantage

With yields on cash-like investments such as three-month Treasury bills sinking to about 3.7%, investors can look to short-term bonds for potentially higher returns with relatively modest interest rate risk. Elevated starting yields paired with potential Fed rate cuts provide a favorable backdrop, with selective credit exposure in high-quality bonds serving as a lever for potentially generating excess returns. The short-term bond market’s compelling mix of income and diversification appear poised to help draw even more interest to this rising asset class.

Vincent J. Gonzales is a fixed income portfolio manager with 18 years of investment industry experience (as of 12/31/2025). He holds an MBA from Harvard and a bachelor’s degree in management science & engineering from Stanford University.

Erica Salvay is a fixed income investment director with 21 years of experience in the industry (as of 12/31/25). She holds a master's degree in investment management with distinction from Cass Business School and a bachelor's degree in economics from Washington University in St. Louis.

Past results are not predictive of results in future periods.


Bond ratings, which typically range from AAA/Aaa (highest) to D (lowest), are assigned by credit rating agencies such as Standard & Poor's, Moody's and/or Fitch, as an indication of an issuer's creditworthiness.


Duration measures a bond’s sensitivity to changes in interest rates. Generally speaking, a bond's price will go up 1% for every year of duration if interest rates fall by 1% or down 1% for every year of duration if interest rates rise by 1%.


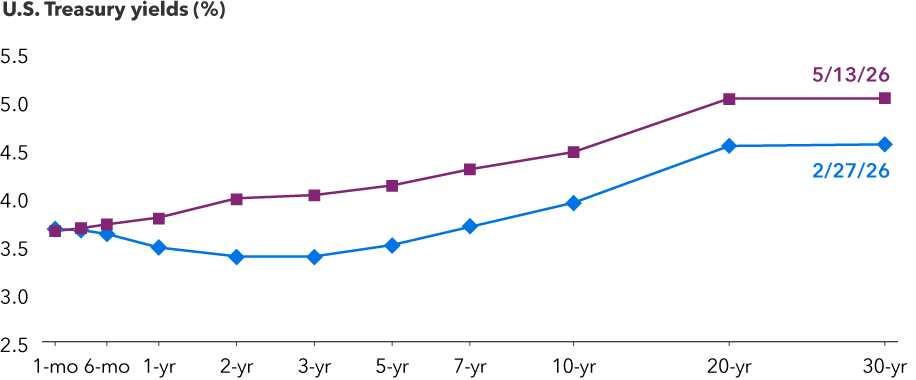
A range bound rate environment refers to periods when interest rates move up and down within a relatively narrow band, rather than trending steadily higher or lower.


The indexes are unmanaged and, therefore, have no expenses. Investors cannot invest directly in an index.


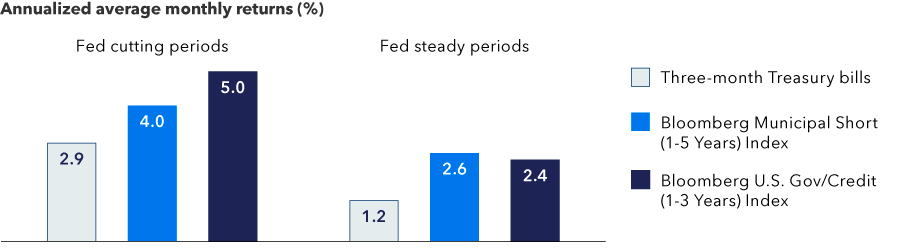
Bloomberg U.S. Government/Credit (1-3 Years) Index is a market-value weighted index that tracks the total return results of fixed-rate, publicly placed, dollar-denominated obligations issued by the U.S. Treasury, U.S. government agencies, quasi-federal corporations, corporate or foreign debt guaranteed by the U.S. government, and U.S. corporate and foreign debentures and secured notes that meet specified maturity, liquidity and quality requirements, with maturities of one to three years.


Bloomberg Municipal Short 1-5 Years Index is a market-value-weighted index that includes investment-grade tax-exempt bonds with maturities of one to five years.


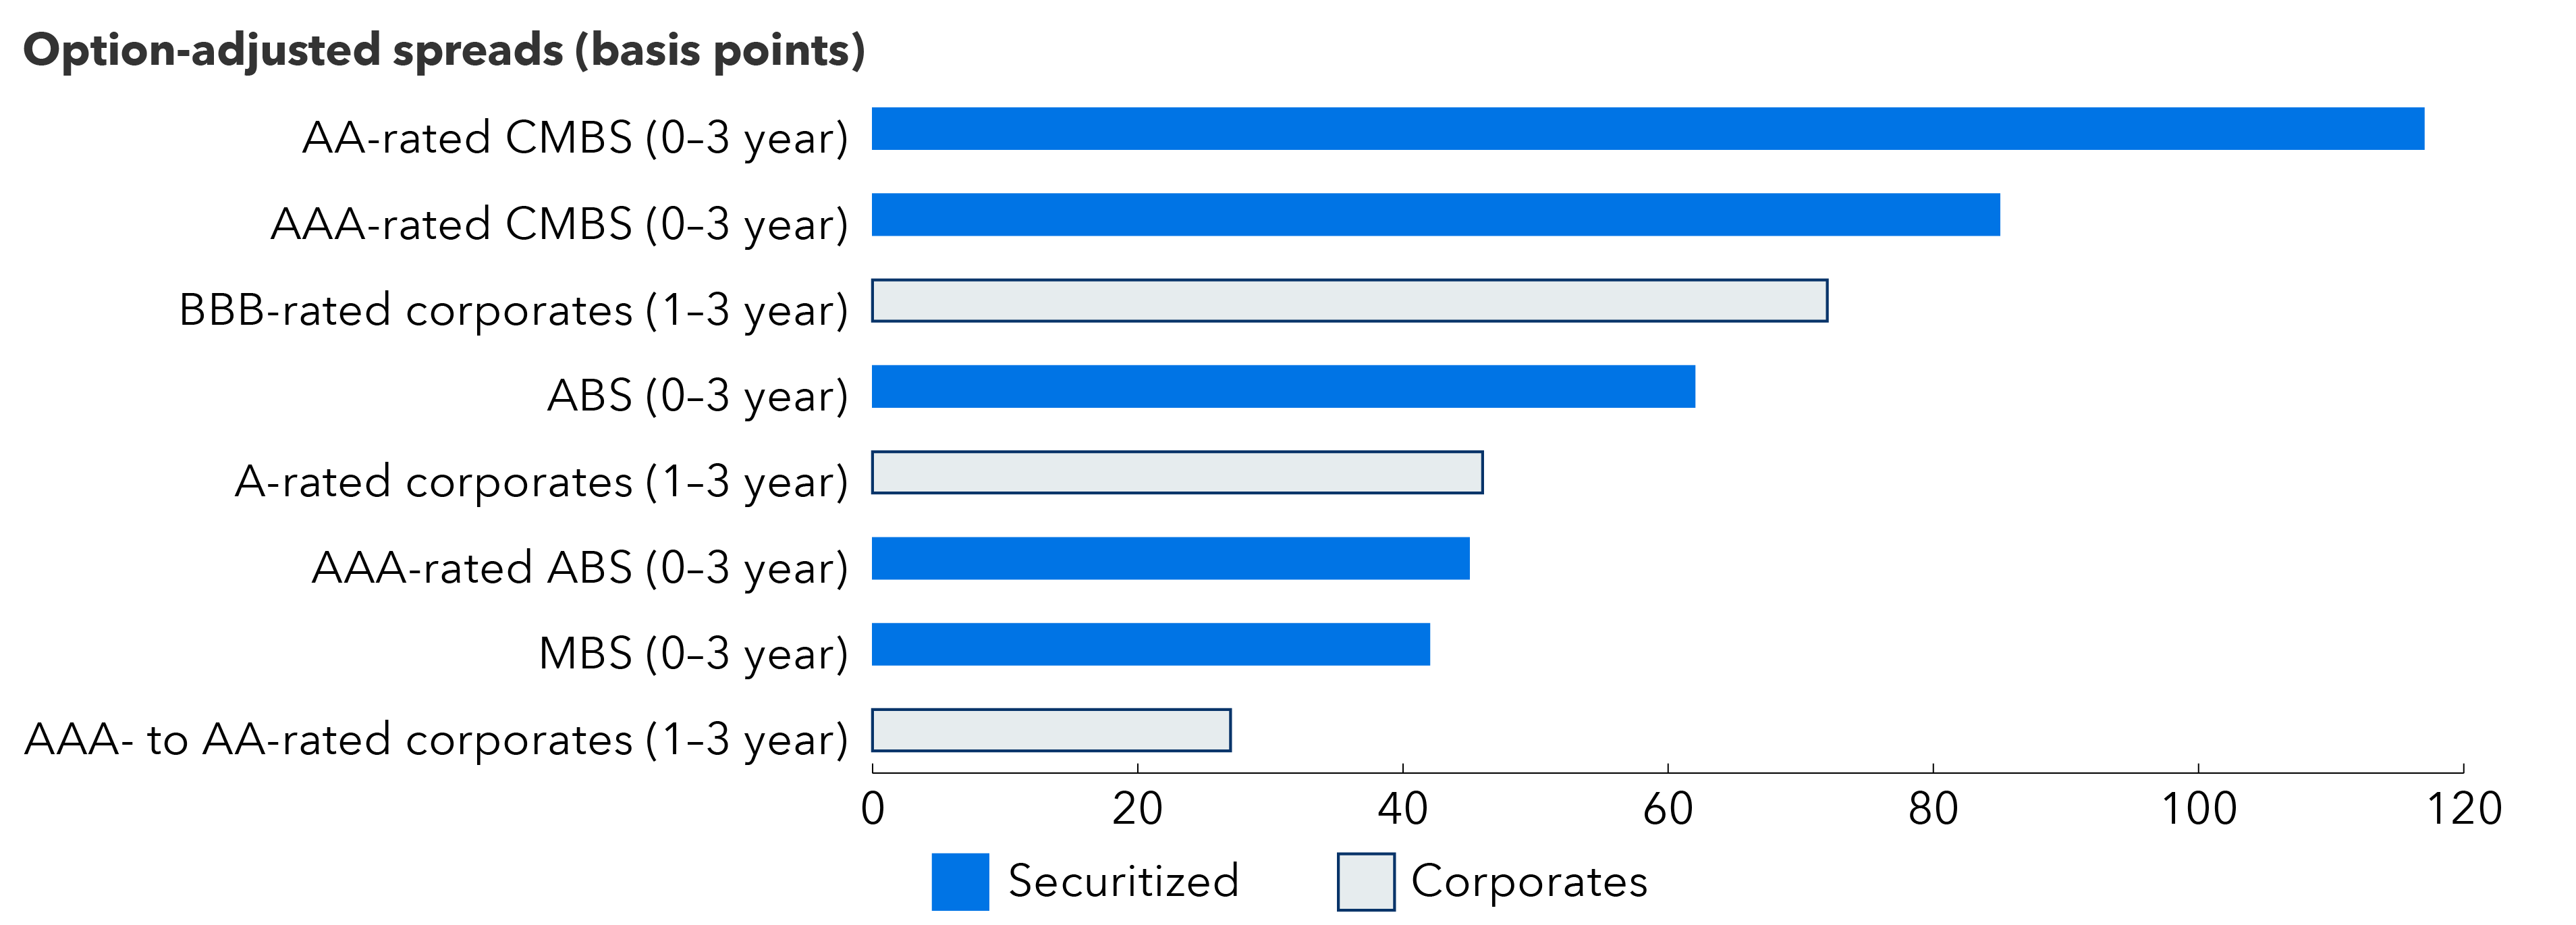
The ICE BofA U.S. Fixed Rate CMBS Index tracks the performance of U.S. dollar denominated investment-grade fixed-rate commercial mortgage-backed securities publicly issued in the U.S. domestic market.


The ICE BofA U.S. Fixed Rate Asset Backed Securities Index tracks the performance of U.S. dollar denominated investment-grade fixed-rate asset-backed securities publicly issued in the U.S. domestic market.


The ICE BofA U.S. Mortgage Backed Securities Index tracks the performance of U.S. dollar denominated fixed-rate residential mortgage pass-through securities publicly issued by U.S. agencies Fannie Mae, Freddie Mac and Ginnie Mae in the U.S. domestic market.


The ICE BofA U.S. Corporate Index tracks the performance of U.S. dollar denominated investment-grade corporate debt publicly issued and settled in the U.S. domestic market.


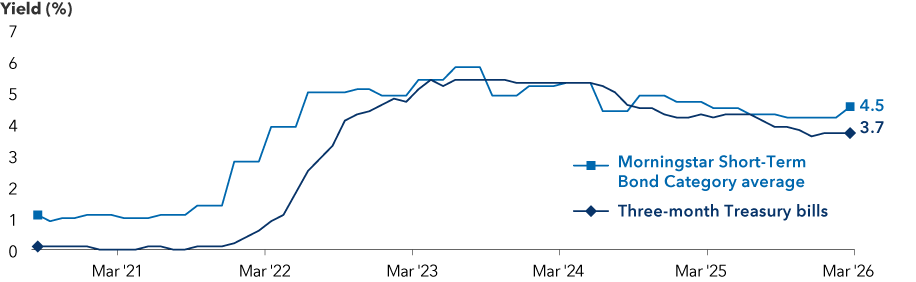
The ICE BofA 3-month U.S. Treasury Bill Index measures the performance of a single issue of outstanding treasury bill which matures closest to, but not beyond, three months from the rebalancing date. The issue is purchased at the beginning of the month and held for a full month; at the end of the month that issue is sold and rolled into a newly selected issue.


The Morningstar Short-Term Bond Category includes bond portfolios that invest primarily in corporate and other investment-grade U.S. fixed-income issues and typically have durations of 1.0 to 3.5 years. Morningstar calculates monthly breakpoints using the effective duration of the Morningstar Core Bond Index (MCBI) in determining duration assignment. Short-term is defined as 25% to 75% of the three-year average effective duration of the MCBI.


Source: Bloomberg Index Services Limited. BLOOMBERG® is a trademark and service mark of Bloomberg Finance L.P. and its affiliates (collectively "Bloomberg"). Bloomberg or Bloomberg's licensors own all proprietary rights in the Bloomberg Indices. Neither Bloomberg nor Bloomberg's licensors approves or endorses this material, or guarantees the accuracy or completeness of any information herein, or makes any warranty, express or implied, as to the results to be obtained therefrom and, to the maximum extent allowed by law, neither shall have any liability or responsibility for injury or damages arising in connection therewith.


© 2026 Morningstar, Inc. All rights reserved. The information contained herein: (1) is proprietary to Morningstar and/or its content providers; (2) may not be copied or distributed; and (3) is not warranted to be accurate, complete or timely. Neither Morningstar, its content providers nor Capital Group are responsible for any damages or losses arising from any use of this information. Past performance is no guarantee of future results. Information is calculated by Morningstar. When applicable, due to differing calculation methods, the figures shown here may differ from those calculated by Capital Group.


ICE Data Indexes are a product of ICE Data Indices, LLC (“ICE Data”) and is used with permission. ICE® is a registered trademark of ICE Data or its affiliates. BOFA® is a registered trademark of Bank of America Corporation licensed by Bank of America Corporation and its affiliates (“BOFA”) and may not be used without BOFA's prior written approval. ICE Data, its affiliates, and their respective third party suppliers disclaim any and all warranties and representations, express and/or implied, including any warranties of merchantability or fitness for a particular purpose or use, including the indices, index data and any data included in, related to, or derived therefrom. Neither ICE Data, its affiliates nor their respective third party suppliers shall be subject to any damages or liability with respect to the adequacy, accuracy, timeliness or completeness of the indices or the index data or any component thereof, and the indices and index data and all components thereof are provided on an “as is” basis and your use is at your own risk. Inclusion of a security within an index is not a recommendation by ICE Data to buy, sell, or hold such security, nor is it considered to be investment advice. ICE Data, its affiliates and their respective third party suppliers do not sponsor, endorse, or recommend Capital Group, or any of its products or services.


Investments are not FDIC-insured, nor are they deposits of or guaranteed by a bank or any other entity, so they may lose value.
Investors should carefully consider investment objectives, risks, charges and expenses. This and other important information is contained in the mutual fund prospectuses and summary prospectuses, which can be obtained from a financial professional and should be read carefully before investing.
There have been periods when the results lagged the index(es) and/or average(s). The indexes are unmanaged and, therefore, have no expenses. Investors cannot invest directly in an index.
Source: Bloomberg Index Services Limited. BLOOMBERG® is a trademark and service mark of Bloomberg Finance L.P. and its affiliates (collectively "Bloomberg"). Bloomberg or Bloomberg's licensors own all proprietary rights in the Bloomberg Indices. Neither Bloomberg nor Bloomberg's licensors approves or endorses this material, or guarantees the accuracy or completeness of any information herein, or makes any warranty, express or implied, as to the results to be obtained therefrom and, to the maximum extent allowed by law, neither shall have any liability or responsibility for injury or damages arising in connection therewith.
Statements attributed to an individual represent the opinions of that individual as of the date published and do not necessarily reflect the opinions of Capital Group or its affiliates. This information is intended to highlight issues and should not be considered advice, an endorsement or a recommendation.
All Capital Group trademarks mentioned are owned by The Capital Group Companies, Inc., an affiliated company or fund. All other company and product names mentioned are the property of their respective companies.
Use of this website is intended for U.S. residents only. Use of this website and materials is also subject to approval by your home office.
Capital Client Group, Inc.
This content, developed by Capital Group, home of American Funds, should not be used as a primary basis for investment decisions and is not intended to serve as impartial investment or fiduciary advice.
© 2026 Morningstar, Inc. All rights reserved. The information contained herein: (1) is proprietary to Morningstar and/or its content providers; (2) may not be copied or distributed; and (3) is not warranted to be accurate, complete or timely. Neither Morningstar, its content providers nor Capital Group are responsible for any damages or losses arising from any use of this information. Past performance is no guarantee of future results. Information is calculated by Morningstar. When applicable, due to differing calculation methods, the figures shown here may differ from those calculated by Capital Group.