Interest Rates
 Tom Hollenberg
- An oil shock can lift headline inflation and keep the Federal Reserve cautious.
- If higher oil prices also erode real income and slow demand, high-quality duration can still play an important role in portfolios.
The market’s first instinct when oil prices rise and geopolitics deteriorate is usually straightforward: higher inflation should mean higher yields. That reaction is understandable, especially after the inflation shock of 2022. The more important question for bond investors is whether an energy spike creates lasting, broad-based inflation pressure or instead acts as a tax on households and businesses, weakening growth even as headline prices rise.
Our latest work on U.S. rates suggests that the second possibility deserves more attention. We believe the current backdrop looks less like a replay of 2022 and more like a classic stagflation scare: Inflation risk remains visible, but growth becomes the more important medium-term driver for fixed income.
Before the recent Iran conflict, the U.S. economy looked reasonably healthy. It was an economy with healthy growth, inflation that was moderating after tariff effects and a labor market that had already cooled materially below the surface.
That cooling is important because oil shocks do not hit a vacuum. When energy prices rise, headline inflation usually responds quickly, but the impact on core inflation (which strips out food and energy) is often more muted. By contrast, the hit to purchasing power can be immediate. Households pay more at the gas pump and have less room to spend elsewhere. Businesses face higher input costs. Financial conditions can tighten as risk appetite weakens. The result is a mix that can look inflationary in the near term while becoming more growth-negative over time.
The drag does not come only from oil itself. Tighter financial conditions, weaker investment and softer foreign growth are also meaningful. Investors should be careful about treating an energy shock as a simple “higher-for-longer” rates story.
The data releases are also beginning to show prices paid by companies moved higher while employment components have weakened. Additionally, nominal consumer activity looks relatively firm while inflation-adjusted activity looks weaker. That divergence is important. It suggests the economy can appear resilient in dollar terms even as real demand softens. For bond markets, that usually argues against extrapolating higher nominal growth too far.
Prices and employment are diverging
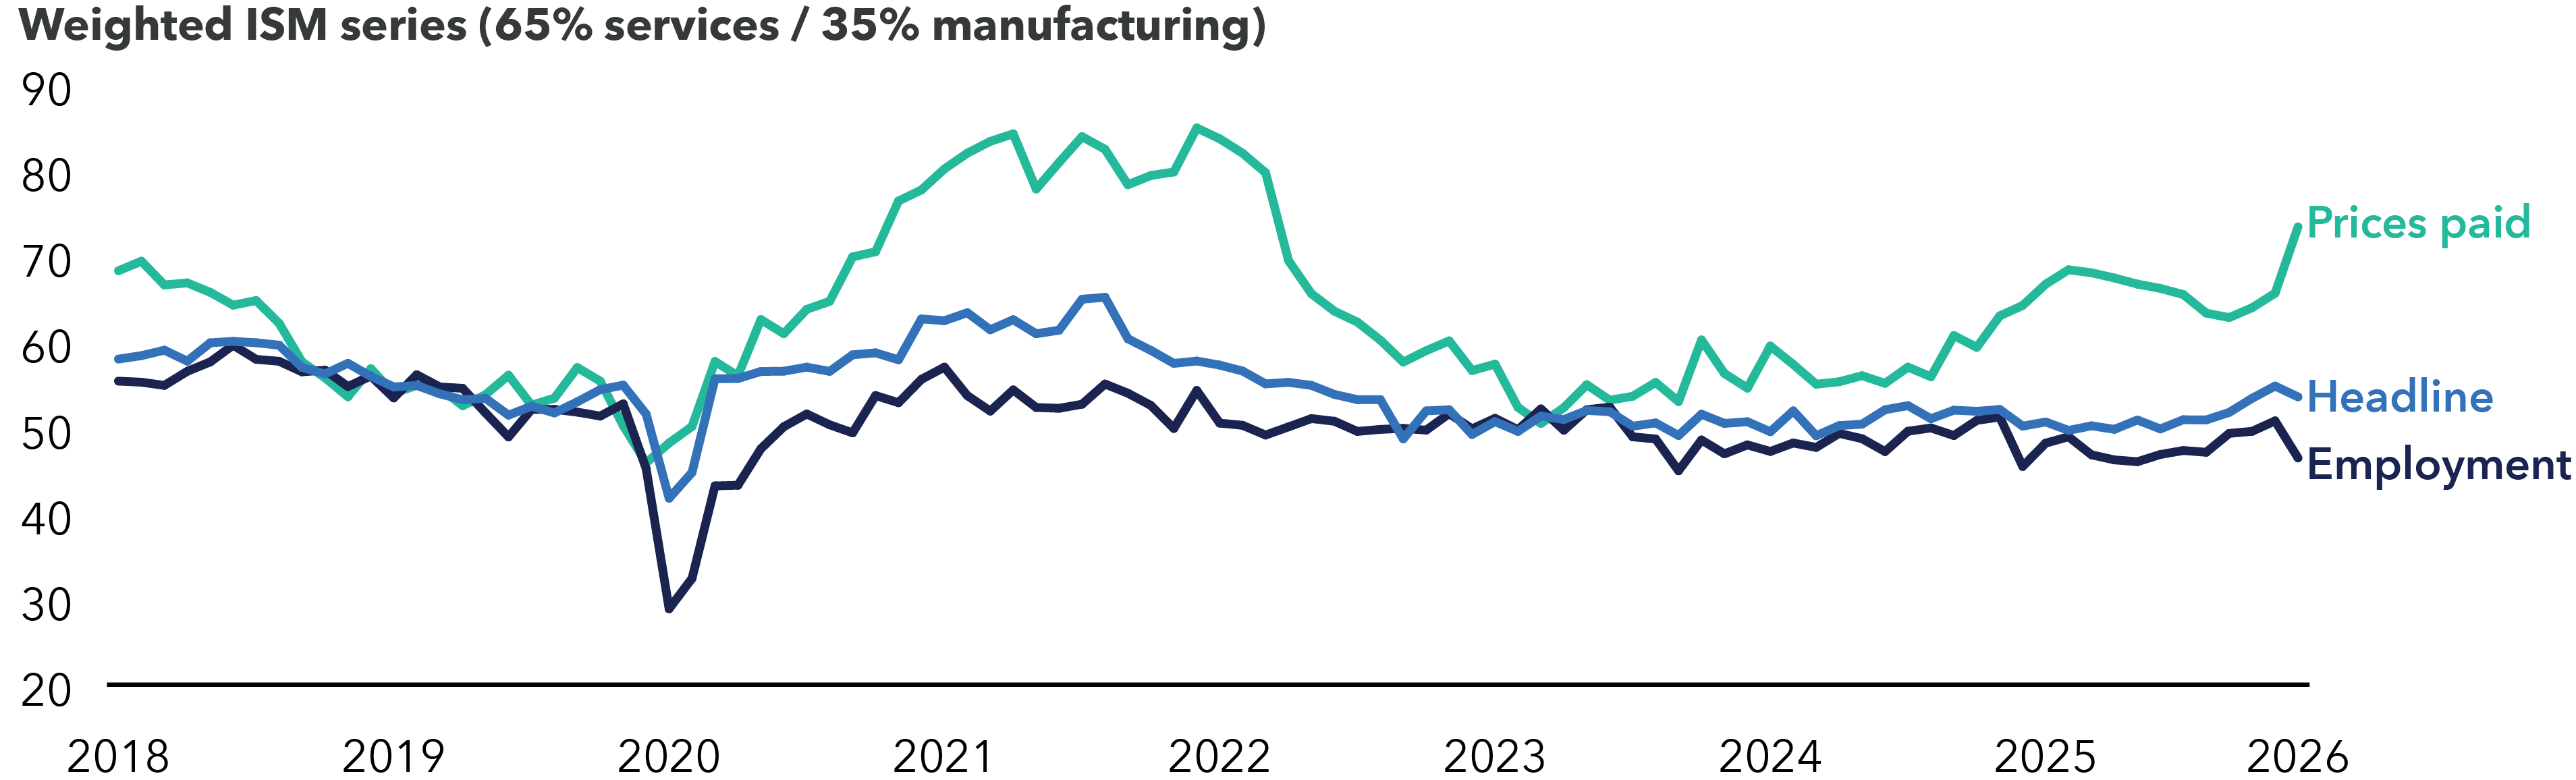
Sources: Bloomberg and Institute for Supply Management Purchasing Managers’ Index. Headline represents full weighted index, while prices paid and employment represent costs and hiring, respectively. Data as of April 2026. The Institute for Supply Management Purchasing Managers' Index is a monthly economic indicator based on surveys of private-sector purchasing managers regarding new orders, production, employment, supplier deliveries and inventories.
The Fed’s challenge
The labor market adds another layer of nuance. Payroll growth appears to have slowed sharply, but unemployment has not risen dramatically. Part of the reason may be structural: The breakeven pace of payroll growth needed to keep the unemployment rate stable may now be much lower than in prior cycles. That helps explain why the Fed may be less reactive than usual to very weak payroll prints. Even so, a soft labor market still matters: If job openings continue to decline, unemployment could move higher from here.
This leaves the Fed in a difficult position. Policymakers are unlikely to welcome another inflation shock, but they also may be reluctant to respond aggressively to rising oil-driven prices if longer-run inflation expectations remain anchored. In practical terms, that means Fed policy could remain cautious near term even as growth risks build. Investors waiting for immediate, decisive easing of monetary policy may be disappointed. But that does not mean duration loses its role in a portfolio.
The case for owning duration
In our view, duration still matters for three reasons. First, it remains one of the few assets that can help hedge a genuine downside growth surprise. Second, carry and roll remain reasonably attractive at current yield levels. Third, real yields themselves look compelling. The 5-year, 5-year (5y5y) forward real Treasury yields are now above October 2023 levels, even though policy rates and underlying growth are lower than they were at that time. That is a notable valuation disconnect. It suggests that some combination of term premium, supply concerns and market uncertainty has pushed real yields to levels that already compensate investors for a great deal of bad news.
Put differently, investors are being paid to be patient. When real yields are high and the policy path is uncertain, owning duration does not require outsized assumptions. It requires the view that slower growth, softer hiring and fading confidence can matter as much as a temporary move in oil prices.
Forward curves at these levels are rarely realized
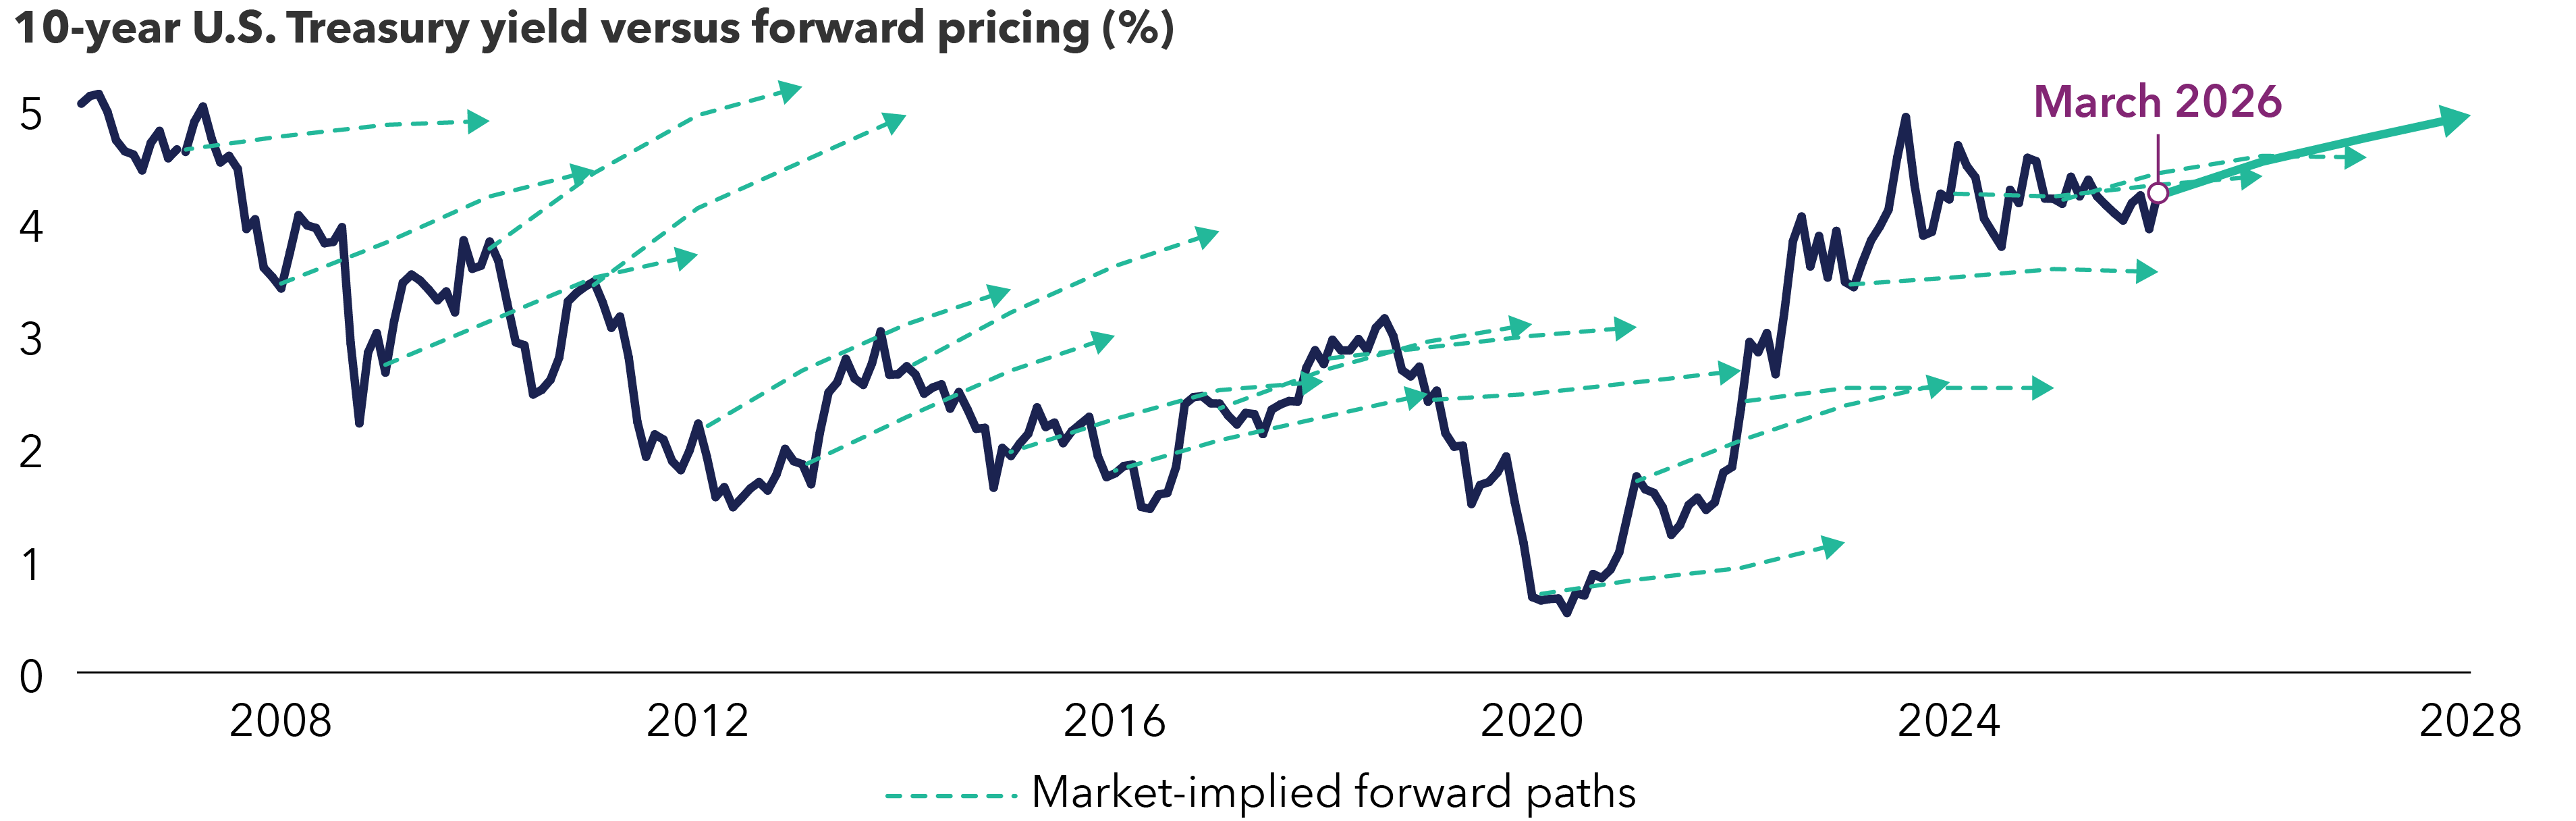
Source: Bloomberg. As of 3/31/2026.
That does not mean every part of the curve should behave the same way. A stagflation scare can keep the front end tied to Fed uncertainty while longer maturities respond more to growth fears, supply dynamics and term premium. It also does not mean inflation protection should be ignored. Treasury Inflation-Protected Securities (TIPS) have become more interesting again after recent underperformance, particularly if inflation compensation rebounds or markets continue to underestimate near-term price pressure.
Economic context matters
An oil shock is not automatically bearish for all bonds. If the shock hits an economy with limited excess savings, slowing hiring and already restrictive real rates, it can strengthen the case for owning high-quality duration even if the Fed is not ready to cut immediately.
Investors should resist reducing the current environment to a single label. It is neither cleanly inflationary nor cleanly recessionary. It is a more nuanced combination of slower real growth, sticky headline inflation and policy hesitation. In that world, high real yields, positive carry and duration’s hedging value still matter. For long-term investors, that should be enough to keep bonds relevant even in a stagflation scare.
Bond markets are unlikely to move in a straight line. Volatility is likely to stay elevated, and any further escalation in the Middle East could produce temporary yield spikes, steeper curves or wider inflation break-evens. But volatility can create opportunity as well. When valuations improve while macro risks become more balanced, investors do not need a near-term recession call to justify rebuilding exposure.
The U.S. Rates Team approaches interest rate research using a four-factor framework across economic fundamentals, policy fundamentals, valuations and technicals to arrive at recommended positioning for fixed income portfolios across duration, yield curve and inflation expressions. The views of individual portfolio managers and analysts may vary.
Footnote/Important information:
A spread over Treasuries is the difference between the yield of a bond and the yield of a similar maturity Treasury bond.
Duration measures a bond’s sensitivity to changes in interest rates. Generally speaking, a bond's price will go up 1% for every year of duration if interest rates fall by 1% or down 1% for every year of duration if interest rates rise by 1%.
Stagflation is an economic condition characterized by slowing economic growth, high unemployment and rising prices that occur simultaneously.
In simple terms, bond “carry” is equal to coupon income minus the cost of funding.
Fixed income “roll” is the capital gain earned on a bond as it approaches maturity, assuming the yield curve remains unchanged. Typically, as a bond gets closer to its maturity date, its yield declines, forcing its price to increase, which then allows investors to sell it for more than they purchased it for while collecting coupon income.
Real yield refers to the return on an investment after accounting for inflation -- it is the nominal yield adjusted to reflect the erosion of purchasing power due to inflation.
Treasury Inflation-Protected Securities (TIPS) are U.S. government bonds designed to protect investors from inflation by adjusting their principal value based on the Consumer Price Index (CPI) -- a key economic indicator that measures the average change over time in prices paid by urban consumers for a market basket of consumer goods and services.
Inflation breakeven is a predictive measurement that helps investors gauge how certain investments are likely to perform during periods of high inflation. Typically, this is reflected as the differential between a long-term nominal bond yield and the real yield available on an index-linked bond of the same maturity.
Don't miss our latest insights.
Our latest insights
RELATED INSIGHTS
-
-
-
Demographics & Culture
Don’t miss out
Get the Capital Ideas newsletter in your inbox every other week