Credit
 Damien McCann
 David Bradin
 Greg Garrett
- AI investments, earnings growth, fiscal stimulus and a renewed push to deregulate key industries may enable the U.S. economy to expand at a moderate pace in 2026.
- Credit fundamentals remain resilient, underpinned by distinct strengths across investment-grade (BBB/Baa and above) corporates, high yield, securitized issues and emerging markets bonds.
- While spreads have widened modestly from historical tights, high starting yields suggest that these levels can broadly persist.
- We expect the most attractive investment opportunities to be idiosyncratic across a range of fixed income sectors.
- Sustained geopolitical instability could produce headwinds to continued economic growth. That said, market volatility may offer opportunities to add to high-quality positions as investors process potentially mixed economic data.
The first quarter of 2026 reminded investors how quickly market volatility associated with geopolitical events can shift economic expectations and impact portfolios. As we progress further into the second quarter, we believe that a diversified approach to fixed income is critical in achieving a balance between strong income, risk management and capital preservation.
As such, multi-sector fixed income stands out as a strategy that may provide diversification and the strategic agility to rotate between sectors as market conditions evolve. Coupled with a potentially high level of current income, this flexibility may lead to better outcomes as compared to concentrating one’s investments in a single sector. In our view, the following five themes highlight the value of a multi-sector strategy in 2026.
Theme 1: A positive macroeconomic environment supports risk markets
We think the macroeconomic backdrop remains constructive, anchored by durable U.S. and global growth. While higher energy prices may constrain economic expansion during the year, the U.S. economy started 2026 with a solid foundation, and several factors still support the likelihood of continued growth.
On the investment front, a continued focus on reshoring among manufacturers and a persistent surge in AI capex are creating a robust foundation of capital formation in the economy. In particular, markets expect that the surge in AI investments (which have been a cornerstone of capex over the past four years) will accelerate as the major hyperscalers1 race to build leadership positions in this transformative technology.
AI investments have added meaningfully to U.S. GDP growth
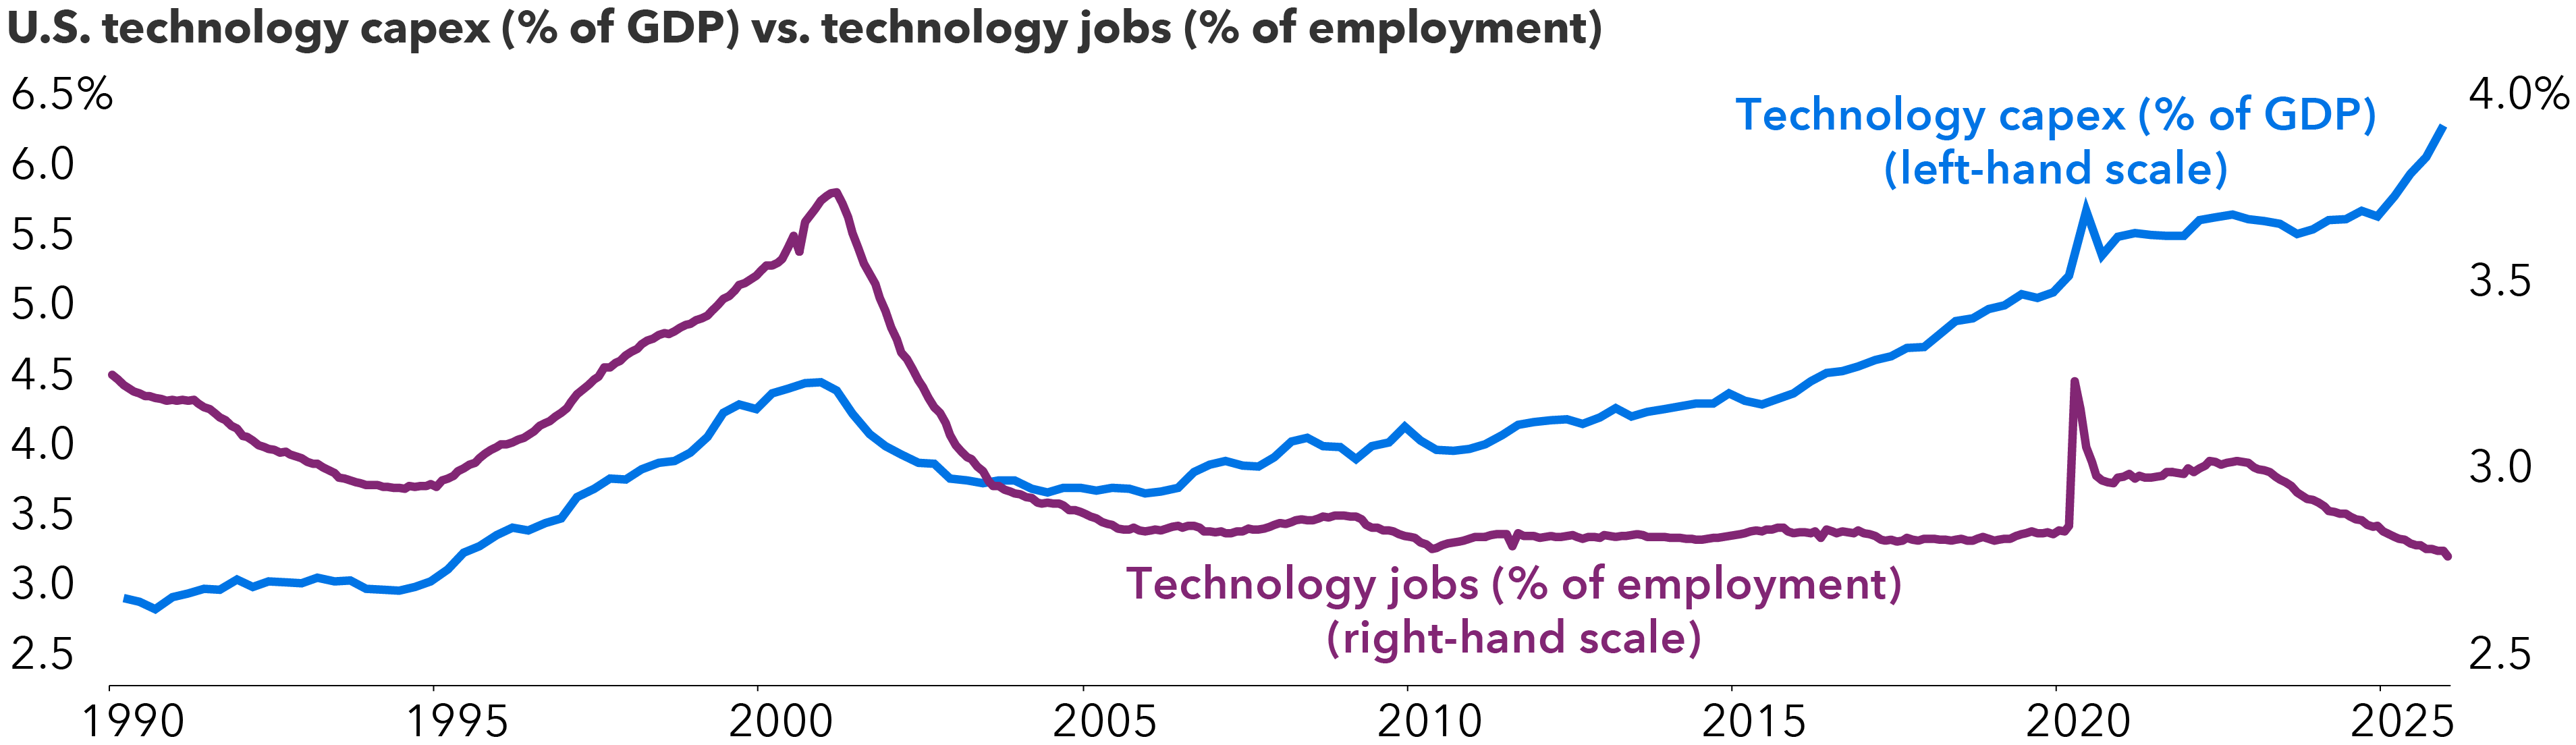
Sources: Capital Group, The U.S. Bureau of Economic Analysis and the Federal Reserve Bank of St. Louis. As of 1/31/26. Technology capital expenditure (capex) comprises investments in computers and peripheral equipment, software and research and development. Technology employment comprises employees in telecommunications, computer systems design and related services and computer and electronic product manufacturing. It also includes computing infrastructure providers, data processing, web hosting and related services.
In addition, consumer spending remains resilient, driven by high employment and positive real wage growth. While affordability challenges persist among lower-income consumers, this cohort represents a smaller share of overall spending. Fiscal stimulus from the One Big Beautiful Bill Act, which offers consumer tax relief and business capex incentives, should support personal consumption and corporate investments. Meanwhile, a renewed federal push to deregulate key industries may create greater efficiencies in the energy, financial and transportation sectors, among others.
We expect this expansion to unfold against the backdrop of a labor market characterized by muted hiring and layoff activity. This decoupling of output from headcount suggests early signs of resurgent productivity, mirroring the efficiency-driven, technology-led boom of the late 1990s. However, a key difference in this cycle is that most AI hyperscalers (such as Amazon, Microsoft and Google) have very sizable cash flows and healthy balance sheets.
That said, we’re mindful that conflict in the Middle East may produce an unexpected drag on U.S. growth. If the conflict is prolonged, sustained high oil and natural gas prices – as well as other supply chain bottlenecks – could produce inflationary pressures that may ultimately detract from consumer sentiment and spending. In addition, if energy price inflation begins to spill over into other goods and services, the Federal Reserve (Fed) may be less inclined to cut rates going forward. This in turn could result in higher borrowing and refinancing costs for U.S. companies and consumers than if the Fed had continued to cut rates.
The global economic outlook remains broadly positive, but some regions are more vulnerable to the current energy shock than others. In Europe, growth prospects have seen a slight boost thanks to increased defense and infrastructure spending, but higher costs for natural gas and oil could be a significant drag on growth. Europe also faces structural headwinds, including a burdensome regulatory environment and limited coordination among member states.
In Asia, China has achieved a measure of stability. While Beijing has demonstrated a clear willingness to prevent further deceleration, the People’s Bank of China continues to shy away from large-scale stimulus, preferring targeted support over broad-based liquidity. And while the conflict in the Middle East has potentially complicated the near-term growth outlook for emerging markets (EM), we still view EM positively on the whole. Broadly speaking, we believe these markets will deliver positive growth, supported by mostly balanced fiscal profiles, conservative monetary policy and deeper local markets than in previous cycles. Latin America, for example, may now be more resilient against higher energy prices than it would have been in past years.
Theme 2: Credit fundamentals remain resilient
In our view, credit fundamentals are still strong. We expect global earnings to continue to grow in 2026, potentially outpacing the solid increase they produced in 2025. Both the U.S. and Europe will likely contribute to this momentum, while the U.S. may register double-digit earnings growth this year. Overall, we think this anticipated increase in earnings will allow companies across a variety of sectors to strengthen their balance sheets and engage in M&A activity or new bond issuance as conditions warrant.
Investment-grade (IG) corporate bonds: We think IG corporate bond issuers are notable for their stable balance sheets and disciplined capital allocation. M&A activity remains relatively well-disciplined, which should keep leverage ratios in check. Meanwhile, markets anticipate that AI and data-center issuance will increase this year and that overall gross issuance will set a new record. As noted above, most of the companies behind data-center issuance have solid EBITDA2, balance sheets and cash flows, as well as high credit ratings. These factors should help support demand for these issuers’ bonds. In addition, net leverage levels remain roughly in line with average levels over the past three years.
Net IG leverage has held relatively steady
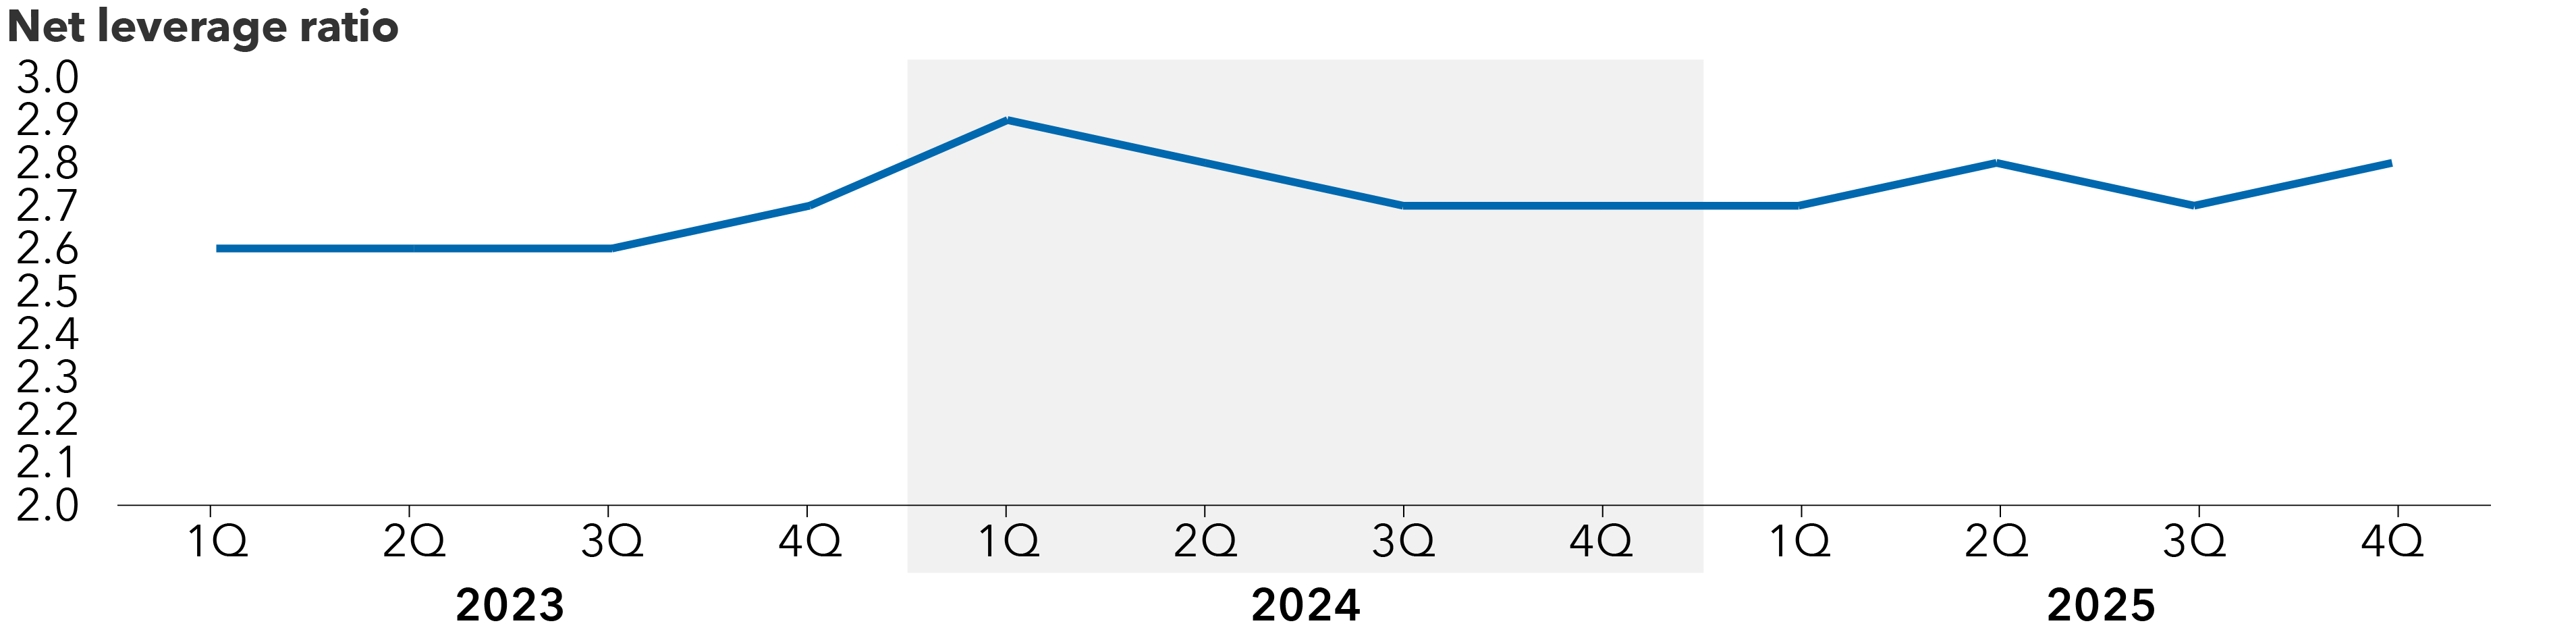
Source: J.P. Morgan. As of 12/31/25. Net leverage ratio is defined as total leverage minus cash and cash equivalents divided by EBITDA. Net leverage and EBITDA calculations are based on the components of the Bloomberg U.S. Corporate Investment Grade Index.
High-yield (HY) bonds: While HY leverage has increased modestly from recent lows, cash and interest coverage ratios remain healthy, tariff effects have been manageable and elevated operating costs have largely flowed through to the end consumer. Meanwhile, the increase in average credit quality that the sector has produced over the past decade and its shorter duration will likely make it less sensitive in the event of a market selloff or continued geopolitical uncertainty. In this context, spreads may not be as tight relative to their historical average as broad HY index spreads would suggest.
Securitized issues: We think the commercial mortgage-backed securities (CMBS) portion of the securitized sector is largely characterized by a "slow motion" recovery in commercial real estate (CRE). We maintain exposure to CMBS in our multi-sector portfolios as we believe their improving fundamentals make them attractive relative to IG corporates. Meanwhile, robust structural protections in asset-backed securities appear well-positioned to insulate investors from a mixed consumer balance sheet.
Emerging markets: EM sovereign credits stand out for their prudent policy mix, combining mostly stable fiscal profiles with conservative monetary policy. We believe this discipline and the fact that EMs maintain a structural growth premium over developed markets will generally create a constructive backdrop for the sector. Despite this positive fundamental outlook, however, we’ve tempered our exposure to the sector in our multi-sector portfolios due to EM’s somewhat rich valuations compared to developed market IG and HY corporates.
Theme 3: Tight spreads highlight the value of credit selection
Although most credit spreads remain historically tight, strong fundamentals and high starting yields suggest that these levels can persist. As a result, we view the market as highly idiosyncratic, offering attractive relative value within specific issuers and sectors. For example, we believe IG corporate bonds can potentially provide high-quality income with attractive prospects in managed care, pharmaceuticals and technology. Broadly speaking, we expect the divergence between AI winners and losers to sharpen in 2026, while renewed M&A activity and AI-related financing are likely to generate both complex risks and excess return opportunities.
Within HY, our analysts are finding idiosyncratic value in select issuers within real estate investment trust bonds, cable, satellite communications and media. We also note that as of March 31, 2026, 55.8% of the bonds in the Bloomberg U.S. Corporate High Yield Index were rated BB/Ba, continuing a trend of increasing credit quality that has evolved over the past decade. From that perspective, we expect to be able to find high-quality HY issues throughout 2026.
The high-yield market has evolved toward higher quality
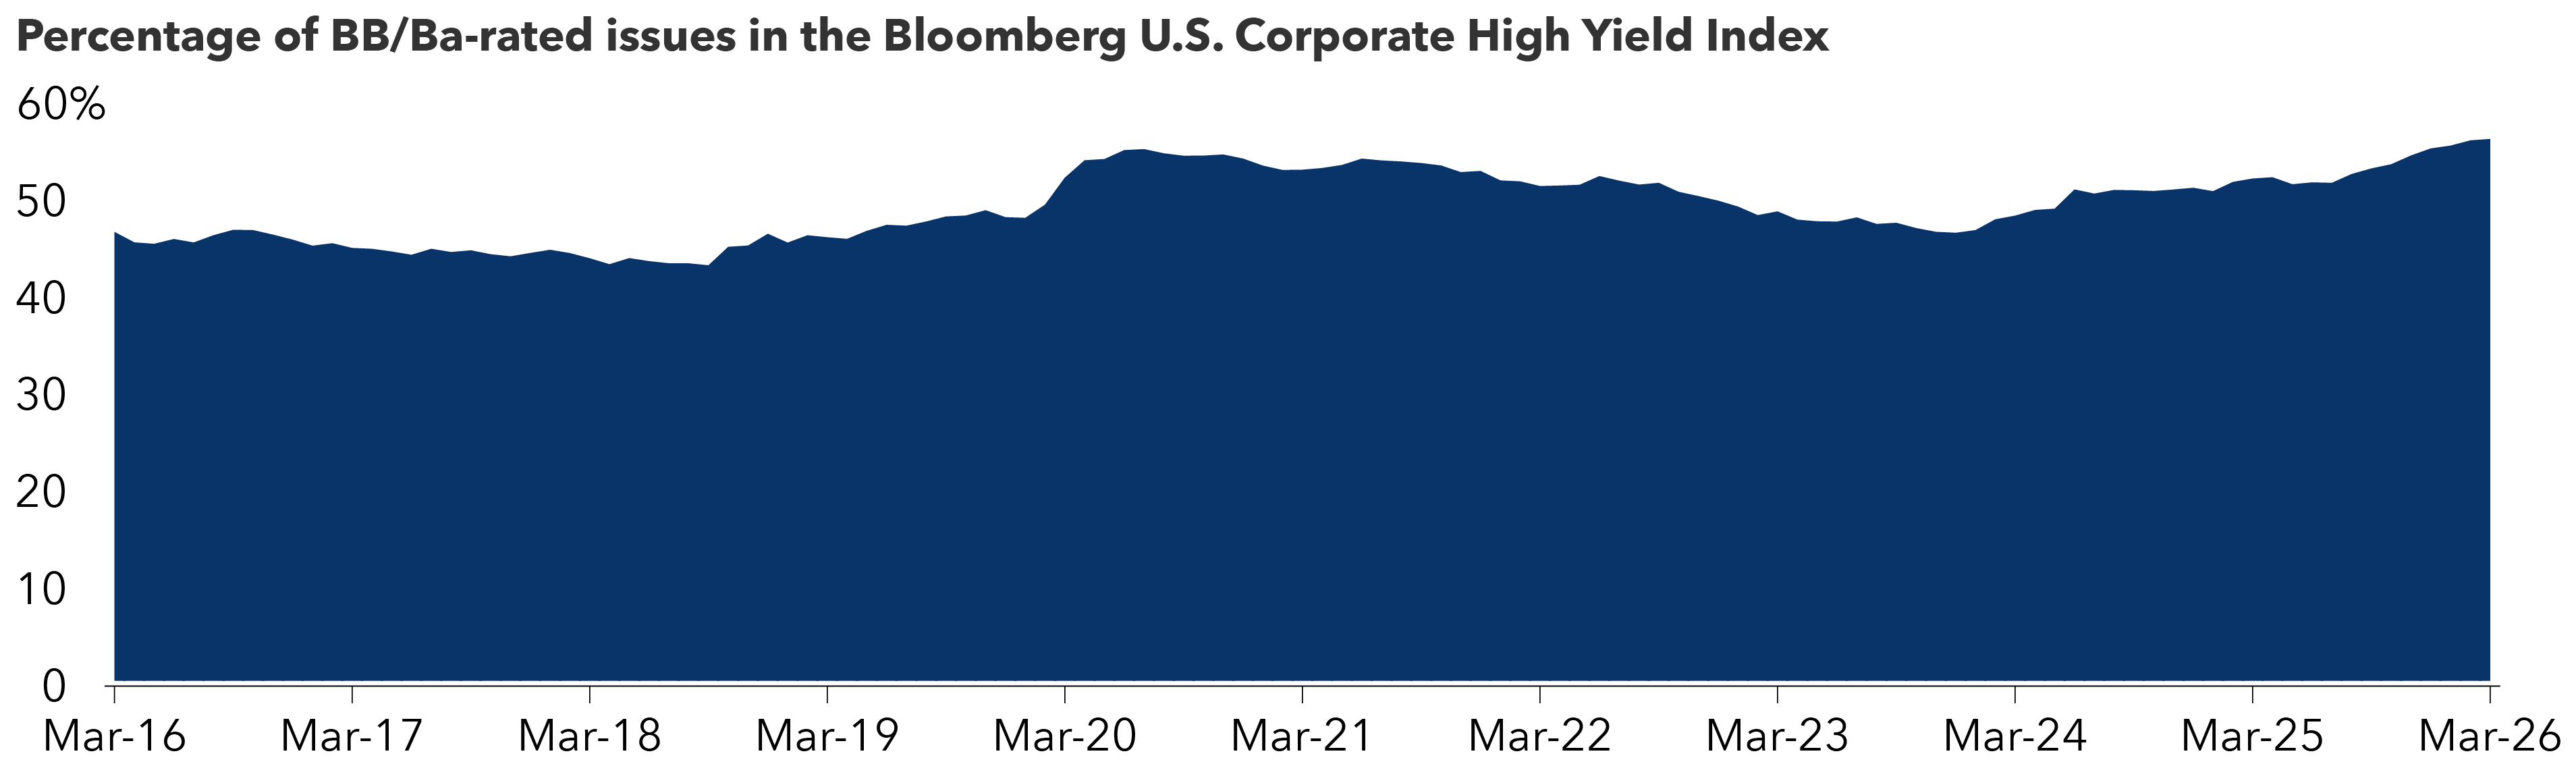
Source: Bloomberg. As of 3/31/26. Based on the Bloomberg U.S. Corporate High Yield Index.
Beyond thinking about individual credit sectors, we expect security selection to fall into three broad categories this year: misunderstood companies, event-driven opportunities and distressed issues. Misunderstood companies are those that operate in a sector that most market participants don’t follow deeply. Meanwhile, the company may not be performing in line with expectations, potentially because it has experienced some deviation from its business plan. Event-driven opportunities are companies where operational risks are well-understood and investor alignment with management on delivering specific outcomes could lead to significant capital appreciation. Distressed companies are those where operations have deteriorated and the company may require a restructuring; investors may need to swap debt for equity and invest new capital.
Historically, distressed companies have been most likely to default on their payment obligations. However, given our current economic outlook, broadly stable leverage metrics and the decline in the HY market’s exposure to CCC-rated credits, we expect that low default rates are likely to persist for the foreseeable future.
High-yield default rates may remain low
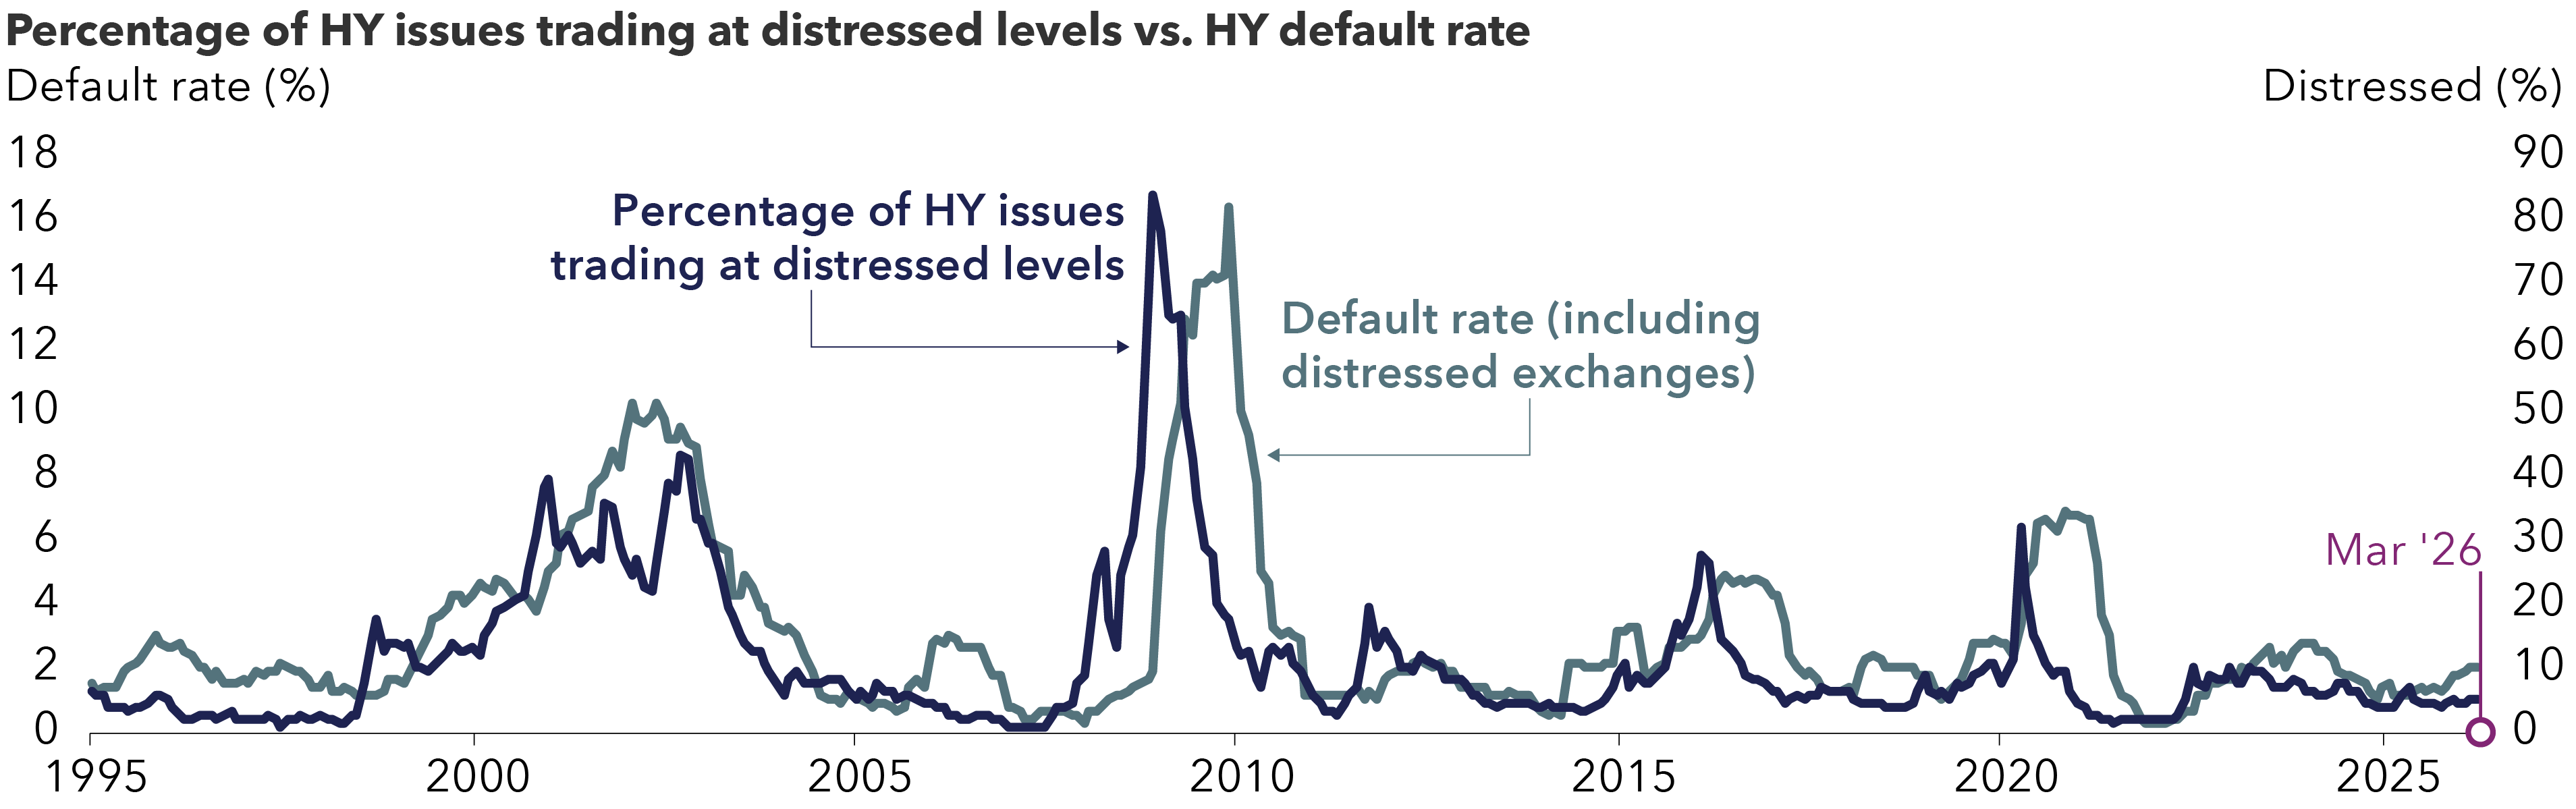
Source: J.P. Morgan. As of 3/31/2026. Based on the Bloomberg U.S. Corporate High Yield Index.
Also, with less than 5% of today’s HY market trading 1000 bps or more wide of Treasuries, we expect forward default rates to remain low over the near to medium term. Consequently, while HY spreads remain tight on a historical basis, we don’t view today’s level of distressed HY issues as an indicator of increased default activity going forward.
Theme 4: Starting yields remain attractive
Generally speaking, starting yields remain attractive across most credit sectors, particularly against the backdrop of a positive macroeconomic environment and solid earnings growth. We believe IG corporates will do well in a further rate cutting environment due to their longer duration3, and even if rate cuts don’t materialize this year, we find IG yields attractive compared to those for HY. Additionally, we expect that M&A activity and new issue markets will provide the opportunity to buy IG bonds that will experience some level of capital appreciation.
HY bond yields are in line with their long-term average. That said, the market is more concentrated in BB-rated credits and has its lowest percentage of CCC-rated credits in more than a decade. Additionally, the sector’s average duration is about one year shorter than its historical average, coupled with a higher concentration of senior secured bonds than in past cycles. As such, investors are getting paid the same yield for higher quality, shorter duration assets than they were more than a decade ago.
Although EM valuations have tightened meaningfully, nominal and real yields remain high across many EM sovereign issues. We prefer investment-grade over HY sovereign credits.
Meanwhile, a mix of asset-backed securities, commercial mortgage-backed securities and non-agency residential mortgages offers the potential for attractive overall yields while enhancing diversification and resilience. Even parts of higher quality securitized markets like agency mortgaged-backed securities offer nominal yields rivalling A-rated three-to-five-year corporate bonds, but with minimal credit risk and strong liquidity.
Starting yields are above their 15-year average in many fixed income sectors
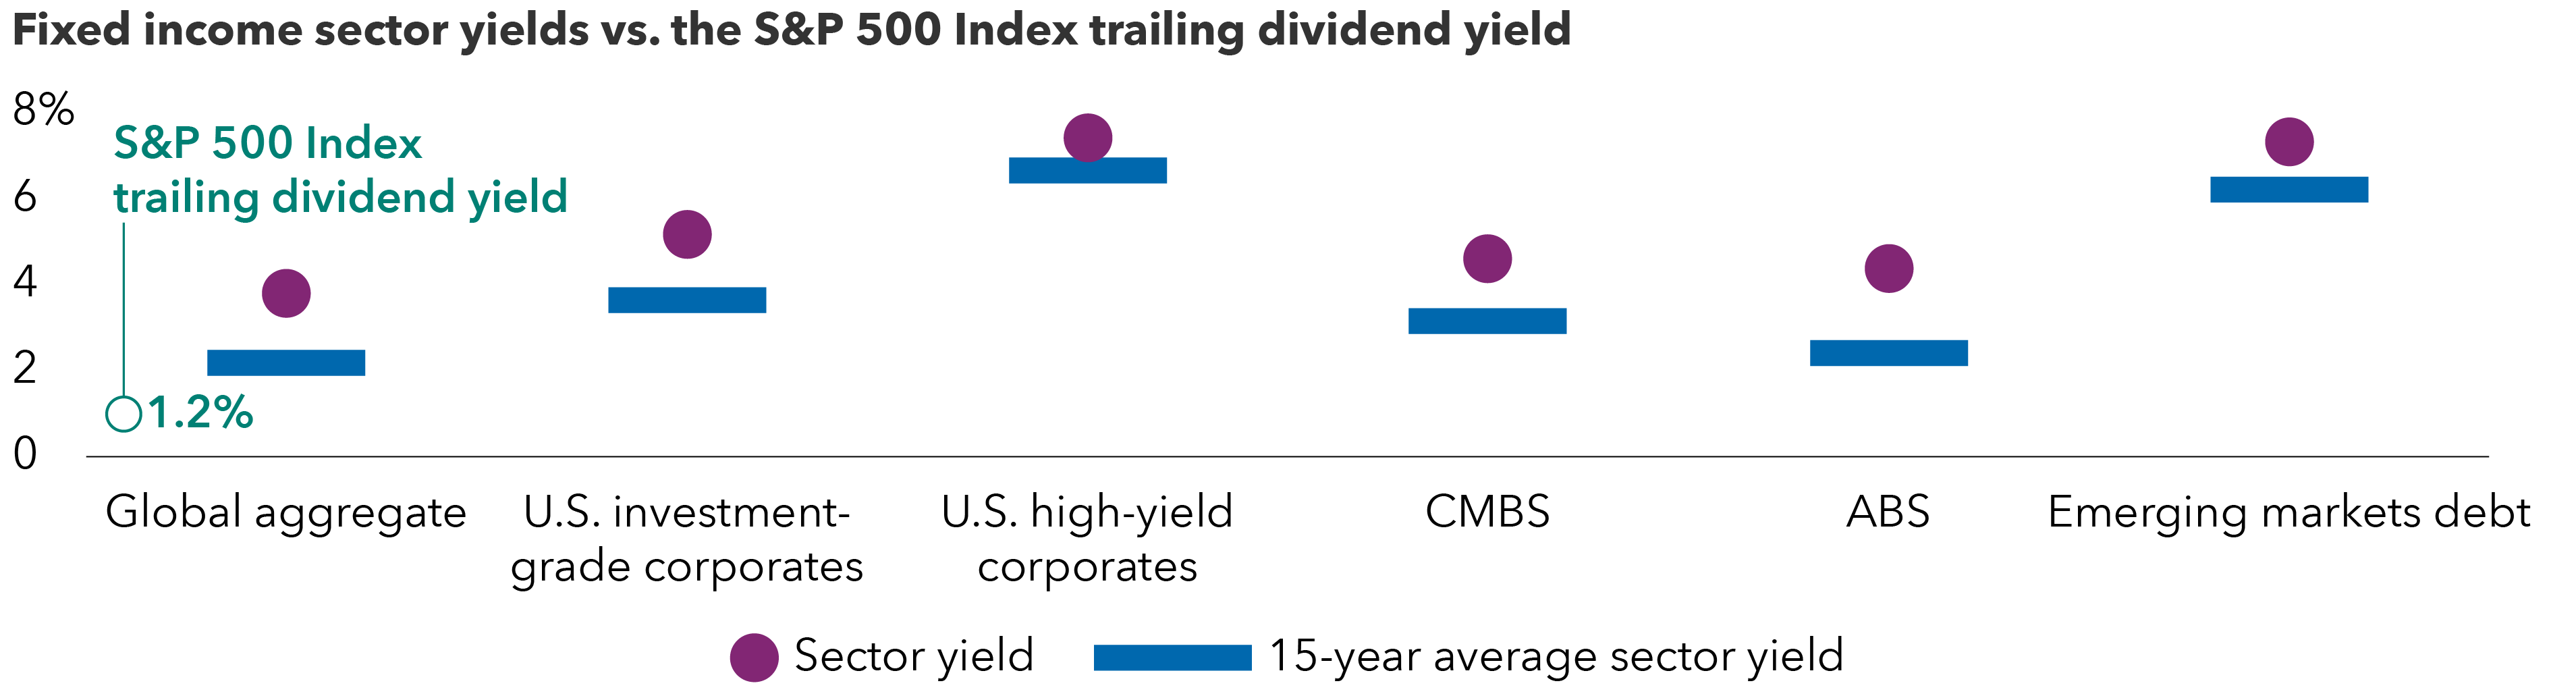
Sources: Bloomberg and J.P. Morgan. As of 3/31/26. Sector yields are based on the following indexes: global aggregate: The Bloomberg Global Aggregate Index; U.S. investment-grade corporates: The Bloomberg U.S. Corporate Investment-Grade Index; U.S. high-yield corporates: The Bloomberg U.S. High Yield 2% Issuer Capped Index; CMBS: The Bloomberg U.S. CMBS Investment Grade Index; ABS: The Bloomberg U.S. ABS Index; emerging markets: The J.P. Morgan EMBI Global Diversified Index. Past results are not predictive of results in future periods.
Theme 5: Volatility may offer buying opportunities
Needless to say, the start of 2026 has proven to be an unpredictable time. The U.S. economy has not experienced a major credit cycle in 17 years, yet private credit – an area of the market with limited liquidity and visibility – has grown tremendously. Meanwhile, the geopolitical shock of the conflict in the Middle East, the rise in energy prices and worries about resurgent inflation have again proven that macro uncertainty often translates into market volatility. Despite these factors, credit spreads are trading near historically tight levels. Within this uncertain landscape, we believe that volatility may increase going forward, thereby creating attractive entry points for active multi-sector strategies.
More specifically, periods of volatility often create opportunities for long-term, fundamental credit investors. When large cash calls force investors to meet redemptions, many asset managers tend to oversell higher quality, liquid issues. For example, five and 10-year bonds of high-quality banks or on-the-run4 issues of leading industrial companies are often easier to sell than issuers with smaller debt footprints or more questionable fundamentals. This can create an opportunity for investors with buying power to acquire these bonds at attractive spread levels.
In addition, spread widening tends to be proportional to credit quality. On that basis, spreads for BBB-rated bonds may widen more than spreads for similar-maturity single A-rated credits. If these BBB-rated bonds are on an improving credit trajectory, investors may have a clear opportunity to buy these issues at more attractive valuations. At the same time, longer periods of spread widening tend to drive a wider divergence in relative spreads, thereby creating more opportunities for investors who are focused on evolving credit stories and companies with improving fundamental trajectories.
Higher quality spreads reflect selling among liquid issues
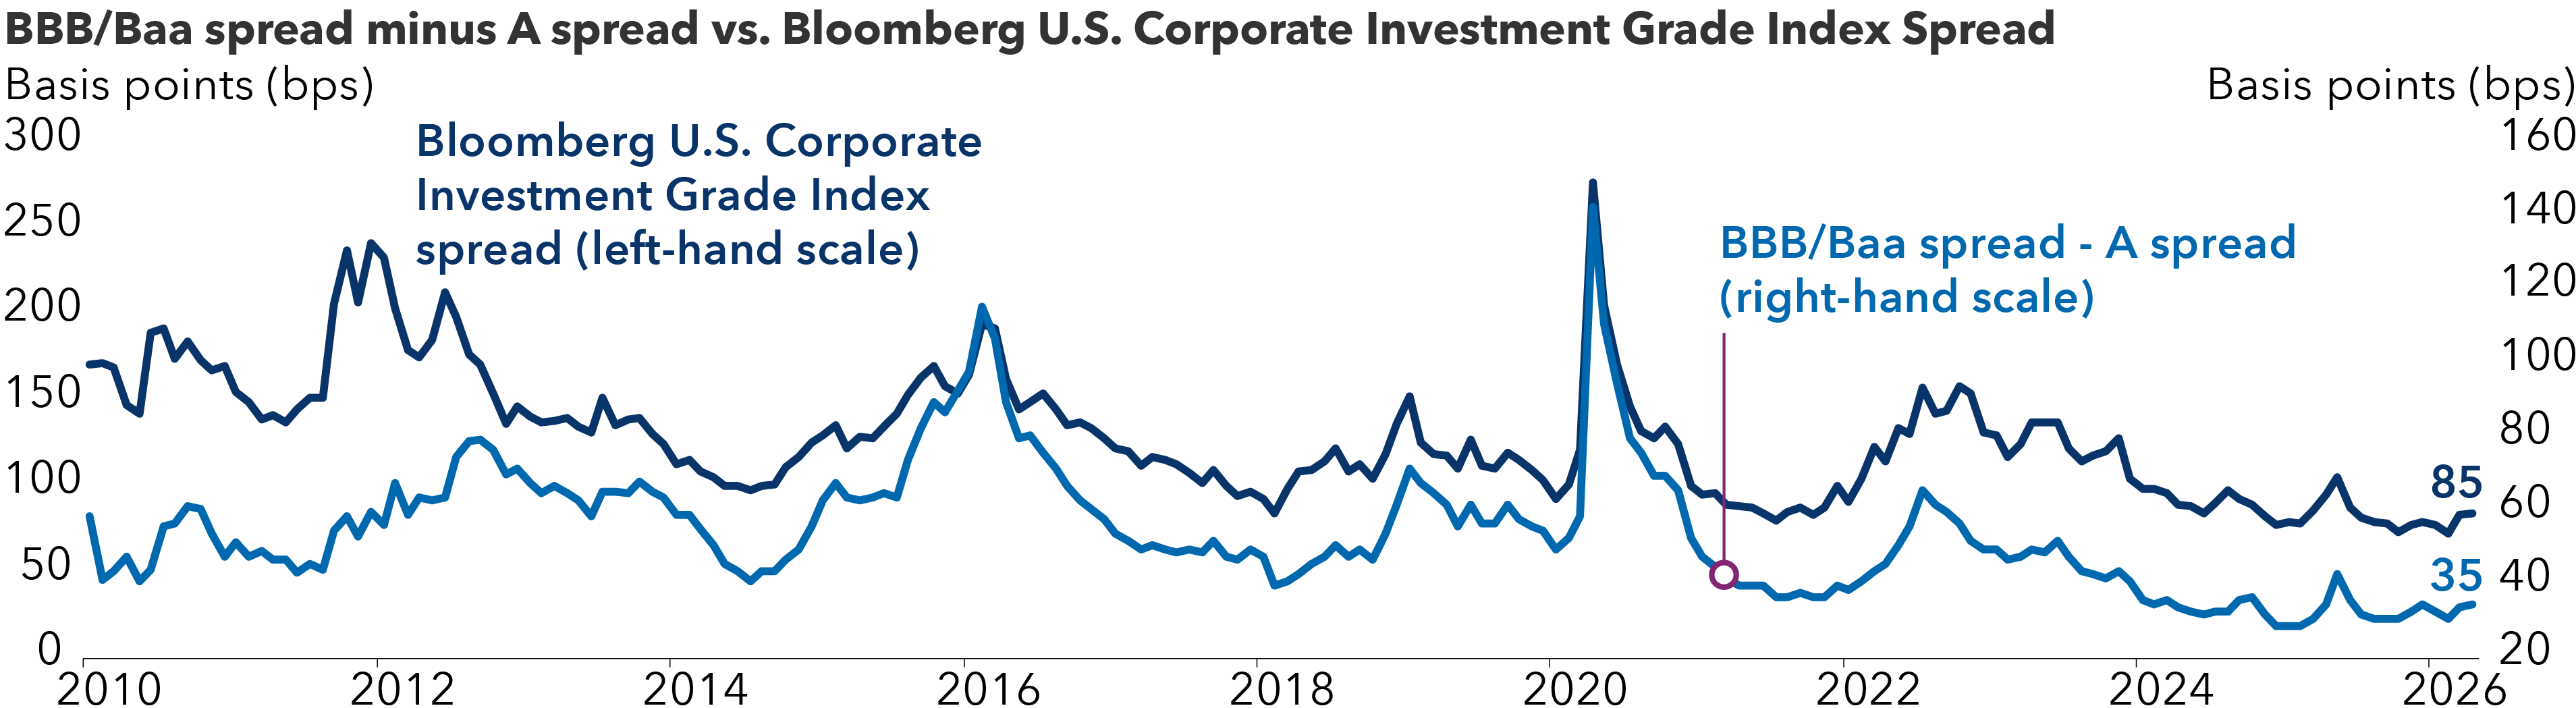
Source: Bloomberg. As of 4/1/26. Based on the Bloomberg U.S. Corporate BBB Index, the Bloomberg Corporate A or Better Index and the Bloomberg U.S. Corporate Investment Grade Index.
Despite ambiguity, multi-sector strategies can thrive
Global financial markets have been highly volatile in the first few months of 2026. Still, periods of volatility often create opportunities for long-term, fundamental credit investors as selling by investors with shorter time horizons can disconnect valuations from underlying fundamentals. We believe our balanced and diversified approach to constructing our multi-sector portfolios allows us to step into this volatility from a position of strength.
From a broad perspective, we think multi-sector fixed income strategies can be invaluable for their ability to adapt quickly to changing market conditions. While we can’t predict how markets will ultimately progress this year, we can say with confidence that a multi-sector approach to fixed income may be a strong choice for investors seeking diversification, a measure of capital preservation and the flexibility to move with market conditions as they evolve.
1 A hyperscaler is a large-scale cloud computing provider that offers storage and networking services to organizations, enabling immense, rapid, and automated scalability.
2 EBITDA is defined as earnings before interest, taxes, depreciation and amortization.
3 In this context, duration is defined as a bond’s price sensitivity to changes in interest rates.
4 On-the-run (OTR) bonds are the most recently issued and frequently traded bonds of a specific issuer. They are highly liquid, typically trading at higher prices and lower yields than older, less active securities due to high demand.
The return of principal for bond portfolios and for portfolios with significant underlying bond holdings is not guaranteed. Investments are subject to the same interest rate, inflation and credit risks associated with the underlying bond holdings.
Higher yielding, higher risk bonds can fluctuate in price more than investment-grade bonds, so investors should maintain a long-term perspective.
Bond ratings, which typically range from AAA/Aaa (highest) to D (lowest), are assigned by credit rating agencies such as Standard & Poor's, Moody's and/or Fitch as an indication of an issuer's creditworthiness.
The Bloomberg U.S. Corporate Bond Index measures the investment grade, fixed-rate, taxable corporate bond market. It includes U.S. dollar-denominated securities publicly issued by U.S. and non-U.S. industrial, utility and financial issuers.
The Bloomberg U.S. Corporate High Yield Index covers the universe of fixed-rate, non-investment-grade debt.
The Bloomberg U.S. Treasury Index measures U.S. dollar-denominated, fixed-rate, nominal debt issued by the U.S. Treasury.
Bloomberg U.S. Corporate Investment Grade Index represents the universe of investment-grade, publicly issued U.S. corporate and specified foreign debentures and secured notes that meet the specified maturity, liquidity and quality requirements.
Bloomberg U.S. Corporate High Yield 2% Issuer Cap Index covers the universe of fixed-rate, non-investment-grade debt. The index limits the maximum exposure of any one issuer to 2%.
The Bloomberg U.S. CMBS Investment Grade Index measures the market of U.S. agency and U.S. non-agency conduit and fusion CMBS deals with a minimum current deal size of $300 million.
The Bloomberg U.S. ABS Index is a flagship, market-capitalization-weighted benchmark measuring the performance of investment-grade, U.S. dollar-denominated, fixed-rate taxable asset-backed securities (ABS).
The J.P. Morgan EMBI Global Diversified Index (EMBIGD) is a market-capitalization weighted, U.S. dollar-denominated index tracking liquid emerging market sovereign and quasi-sovereign debt (Brady bonds, Eurobonds, loans).
S&P 500 Index is a market capitalization-weighted index based on the results of approximately 500 widely held common stocks.
BLOOMBERG® is a trademark and service mark of Bloomberg Finance L.P. and its affiliates (collectively “Bloomberg”). Bloomberg or Bloomberg’s licensors own all proprietary rights in the Bloomberg Indices. Neither Bloomberg nor Bloomberg’s licensors approves or endorses this material or guarantees the accuracy or completeness of any information herein, or makes any warranty, express or implied, as to the results to be obtained therefrom and, to the maximum extent allowed by law. Neither shall have any liability or responsibility for injury or damages arising in connection therewith.
This report, and any product, index or fund referred to herein, is not sponsored, endorsed or promoted in any way by J.P. Morgan or any of its affiliates who provide no warranties whatsoever, express or implied, and shall have no liability to any prospective investor, in connection with this report. J.P. Morgan disclaimer: https://www.jpmm.com/research/disclosures.
Each S&P Index ("Index") shown is a product of S&P Dow Jones Indices LLC and/or its affiliates and has been licensed for use by Capital Group. Copyright © 2026 S&P Dow Jones Indices LLC, a division of S&P Global, and/or its affiliates. All rights reserved. Redistribution or reproduction in whole or in part is prohibited without written permission of S&P Dow Jones Indices LLC.
Statements attributed to an individual represent the opinions of that individual as of the date published and do not necessarily reflect the opinions of Capital Group or its affiliates. This information is intended to highlight issues and should not be considered advice, an endorsement or a recommendation.
Don't miss our latest insights.
Our latest insights
RELATED INSIGHTS
-
-
Demographics & Culture
-
Don’t miss out
Get the Capital Ideas newsletter in your inbox every other week