
TODAY’S CHALLENGE
Federal funds target rate: 3.75 - 4.00%*
Steady rates and a cautious Federal Reserve create a need for careful positioning in fixed income.
Federal funds target rate: 3.50 - 3.75%*
OUR STRATEGY
50+ years of fixed income investing
Capital Group offers bond funds to help investors generate meaningful income. Our research-driven, active approach allows for fund allocations to shift based on market conditions and our investment insights (subject to fund guidelines).
*Source: The New York Federal Reserve. As of 3/31/26.
OUR TAKE
Opportunities for high income should continue if the U.S. economy maintains positive GDP growth.
For investors willing to add risk, allocations to multi-sector, high-yield or emerging markets debt funds can complement core funds and help provide income.
Income-seeking funds offered higher distributions, complemented core (F-2 shares)

*Tax-equivalent 12-month distribution rate: Highest tax rate assumes the 3.8% Medicare tax and the top federal marginal tax rate for 2025 of 37%. Morningstar Intermediate Core Bond and Morningstar Intermediate Core-Plus Bond are category averages. Sources: Morningstar and Bloomberg.
American Funds Multi-Sector Income Fund (F-2)
MIAYX

American High-Income Trust (F-2)
AHIFX

American Funds Emerging Markets Bond Fund (F-2)
EBNFX

American High-Income Municipal Bond Fund (F-2)
AHMFX

Featured fund: American Funds Multi-Sector Income Fund
American Funds Multi-Sector Income Fund invests across higher income sectors. The fund is designed to provide less volatility than a standalone high-yield or emerging markets debt fund without meaningfully reducing income.
-
-
Positioning
Fund tilted toward higher quality sectors
Monthly allocations since fund inception (March 22, 2019)
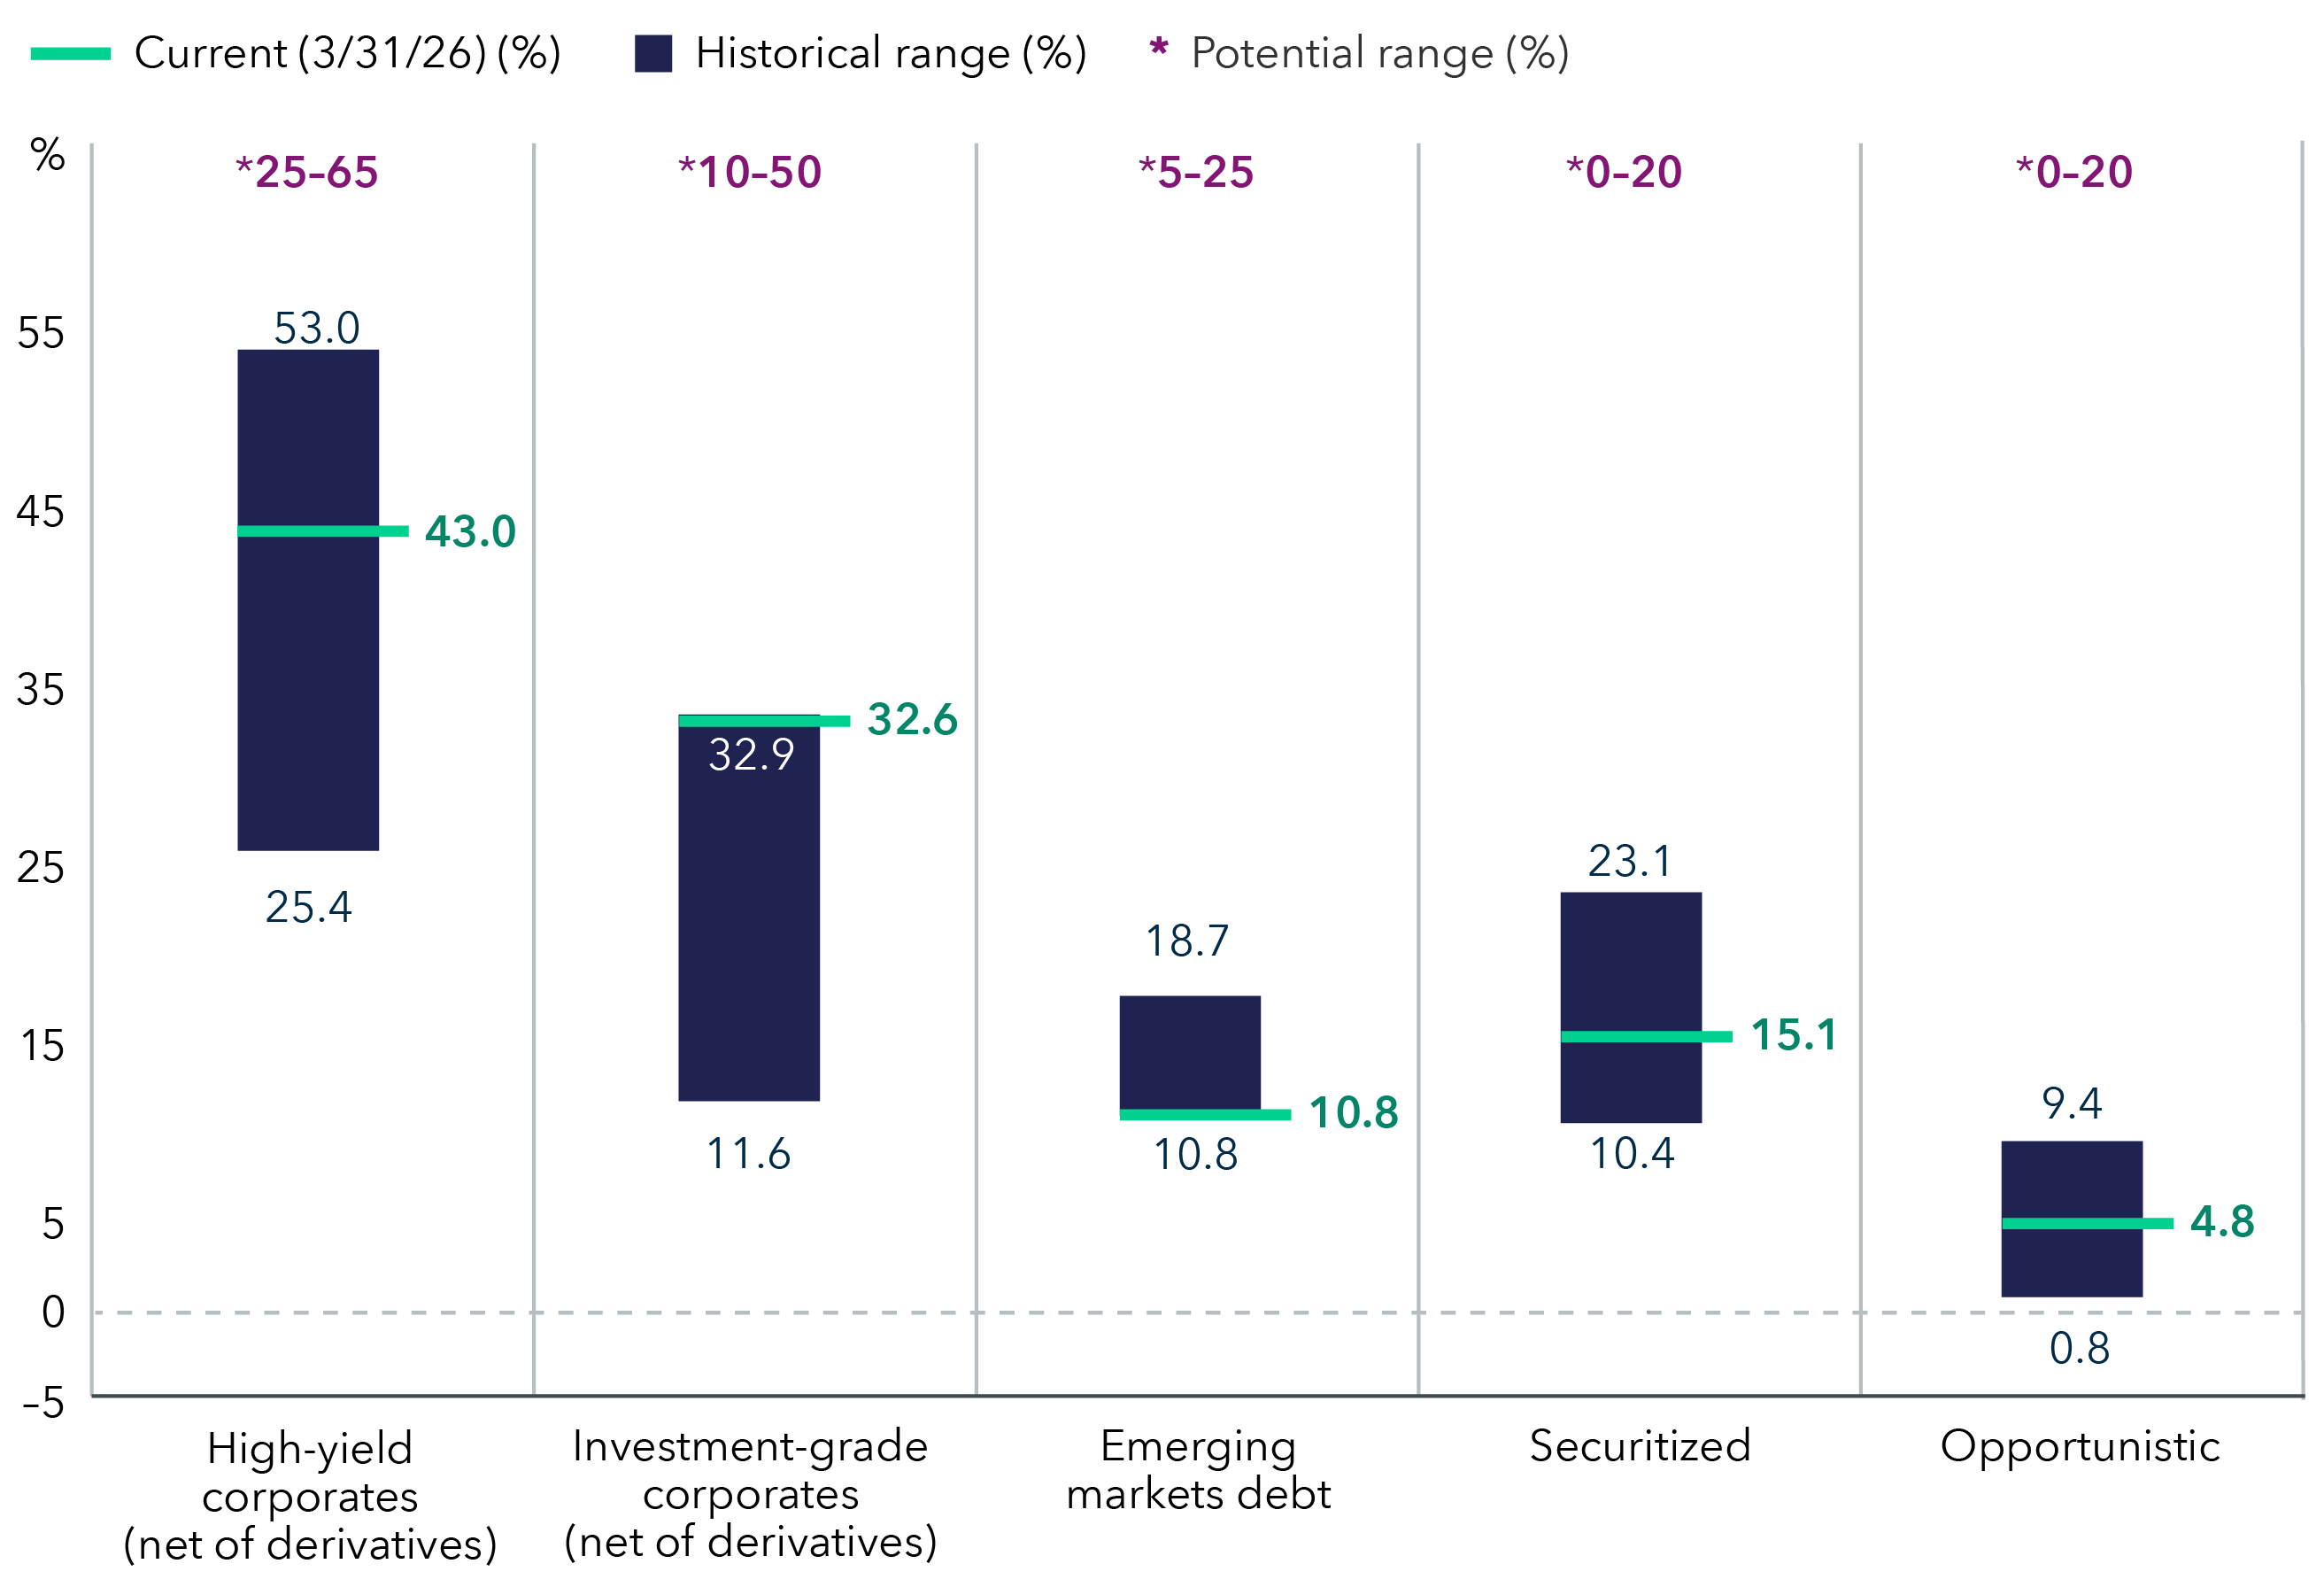
Opportunistic includes U.S. Treasuries, municipal bonds, noncorporate credit and other debt instruments. Securitized includes financial securities that are created by securitizing individual loans (debt). Source: Capital Group. Data as of 3/31/26. Investment-grade = BBB/Baa and above.
Overweight
Securitized
Within securitized credit, the fund maintained a focus on commercial mortgage-backed securities — including single-asset/single-borrower and conduit structures — and asset-backed securities such as sub-prime autos. U.S. employment rates continued to support consumer fundamentals, while collateral values, including homes and used vehicles, provided additional ballast. In commercial real estate, improving fundamentals and lower financing costs supported a gradual recovery. Securitized credit remained the fund’s largest overweight relative to the benchmark.
Investment-grade credit
Within IG corporates, fundamentals remained attractive, supported by disciplined capital management, improving productivity and stable margins. The fund’s managers selectively added to sectors such as healthcare, pharmaceuticals and technology, as well as finance companies, where issuer-specific opportunities offered a more favorable balance of income and risk despite tight spreads. Security selection (rather than broad market exposure) drove positioning in the sector.
Underweight
High yield
The fund began the quarter with a small underweight position in high-yield corporates as spreads remained rich relative to IG credit. While fundamentals were generally solid, the fund’s managers focused on idiosyncratic opportunities in areas such as commercial real estate-related credits and cable and satellite communications where asset support and cash flow visibility appeared more resilient. The fund remained cautious toward consumer cyclicals, which showed greater sensitivity to macroeconomic and financing risks. The fund ended the quarter with a neutral weight to the sector.
Emerging markets
In emerging markets debt (EMD), the fund’s managers reduced exposure primarily within lower-rated sovereign bonds while maintaining selective positions in higher quality issuers. Regionally, relative value appeared more compelling in parts of Latin America, including select sovereign and corporate issuers, while valuations in several Asian markets remained tight and less responsive to trade-related volatility. Overall, the fund’s allocation to EMD remained underweight relative to the benchmark.
Weightings are relative to the American Funds Multi-Sector Income Fund Custom Index. As of 3/31/26.
-
Strategy
Remaining selective with relative value opportunities across sectors
- Credit markets remained constructive in early 2026, supported by continued positive economic activity and supportive corporate fundamentals. At times, volatility increased, leading to modest spread widening, as investors assessed the implications of the potential for moderating growth, shifting interest rate expectations and evolving geopolitical and trade risks.
- Even with valuations near the tighter end of their historical range across several credit sectors, strong underlying fundamentals and elevated all-in yields continued to support fixed income markets. Dispersion across sectors and issuers created opportunities for active, selective positioning.
- Looking ahead, we expect U.S. economic growth to remain positive, though with some softening in the labor market and continued geopolitical uncertainty. Ongoing investments in artificial intelligence (AI) and infrastructure, along with geopolitical risks and regulatory and policy developments may continue to influence sector-level outcomes.
Source: Capital Group. As of 3/31/26.

-


Featured fund: American High-Income Trust
A diversified portfolio of lower rated, higher yielding bonds seeking to provide investors a high level of current income
Fund is slightly defensively positioned as growth moderates
Industries shown below are among the fund's notable overweights and underweights relative to the index

Sources: Capital Group, Bloomberg. Data as of 3/31/26.
Overweight
REITs
Our American High-Income Trust maintained a modest overweight to REITs through select issuers due to their strong fundamentals, including resilient free cash flow and REITs' generally stable leverage profile. These assets offer defensive yields and diversification potential.
Brokerage, asset managers & exchanges
Financial advisory platforms are growing via consolidation and should benefit from elevated interest rates. Investments across the sector have produced an attractive level of cash flow despite recent concerns about cash sweep considerations.
Underweight
Consumer cyclical
Although the fund remained broadly underweight the sector, we maintained idiosyncratic positions in retailers, gaming and leisure. These investments skewed toward higher quality issues within these subsectors.
Capital goods
In our view, the fundamental outlook is stable across industries like diversified manufacturing. The largest underweight within the sector came from building materials, which have been impacted by decreasing home sales in recent years.
Weightings are relative to the Bloomberg U.S. Corporate High Yield 2% Issuer Capped Index as of 3/31/26.
Some say
Credit sector spreads are historically tight.
Insight
While most credit spreads are tight on a historical basis, many starting yields are near or above their five-year average. With the Fed likely on hold for the remainder of 2026, we believe income-oriented sectors can effectively complement a core bond allocation.
In our view, high yield, emerging markets bonds, investment-grade corporates and other sectors can potentially enable income investors to achieve long-term excess returns even if the federal funds target rate holds steady.
Some say
Investors only need dividend-paying stocks to generate income.
Insight
In addition to dividend-paying stocks, investments in higher income bonds can help income-seeking investors fund a longer retirement. Higher income bonds include investment-grade and high-yield corporates, emerging markets and securitized debt.
In addition to diversification, most of these bonds offer steady coupon payments. However, they also carry the risk of defaulting on their obligations. Depending on their objectives, income-seeking investors may want to consider allocating a portion of their investments to these assets.
Some say
Current high-yield spreads are tight versus their historical average.
Insight
While it’s natural for fixed income investors to be concerned with tight spreads, indicators such as starting yield to worst (YTW)4, credit quality and the likely direction of U.S. corporate earnings suggest that high yield may continue to outpace other fixed income sectors in 2026. With a starting YTW of 7.4% and with more than 50%* of the high-yield market rated BB/Ba, we believe high yield can continue to complement a core bond allocation and potentially offer greater long-term income than dividend-paying stocks.
Source: Bloomberg. Data as of 3/31/26. *Based on the Bloomberg U.S. High Yield 2% Issuer Capped Index.
Some say
Only speculative investors should buy emerging markets debt.
Insight
Emerging markets bonds can offer high income with currency and geographic diversification. Many emerging markets sovereign bonds are investment-grade-rated, and the sector includes some of the fastest growing economies in the world.
Still, idiosyncratic and geopolitical risks tied to emerging markets are real, and we believe a capable investment manager with disciplined risk-management processes in place is essential for investors to achieve long-term success.
Some say
Municipal bonds are only for wealthy investors.
Insight
Investors across multiple tax brackets can benefit from allocations to municipal bonds. Munis are typically exempt from federal taxes and sometimes state and local taxes, which means that investors can keep more of their interest income.
Beyond tax advantages, munis typically have lower risk compared to high-yield bonds and equities. They can also serve to diversify a portfolio.
Figures shown are past results and are not predictive of results in future periods. Current and future results may be lower or higher than those shown. Investing for short periods makes losses more likely. Prices and returns will vary, so investors may lose money. View mutual fund expense ratios and returns. View current mutual fund SEC yields and tax-equivalent SEC yields.
1. The SEC yield reflects the rate at which the fund is earning income on its current portfolio of securities while the distribution rate reflects the fund’s past dividends paid to shareholders. Accordingly, the fund’s SEC yield and distribution rate may differ. For American Funds Emerging Markets Bond Fund, a portion of the fund's distribution may be classified as a return of capital. Please refer to the fund's Annual Report for details.
2. Calculated by Morningstar. Due to differing calculation methods, the figures shown here may differ from those calculated by Capital Group.
3. Expense ratios are as of each fund’s prospectus/characteristics statement, as applicable, available at the time of publication.
4. Yield to worst is defined as the lowest possible yield that an investor would receive if all the issuers in a fixed income fund fulfilled their payment obligations.
© 2026 Morningstar, Inc. All Rights Reserved. Some of the information contained herein: (1) is proprietary to Morningstar and/or its content providers; (2) may not be copied or distributed; and (3) is not warranted to be accurate, complete or timely. Neither Morningstar, its content providers nor Capital Group are responsible for any damages or losses arising from any use of this information. Past performance is no guarantee of future results. Information is calculated by Morningstar. Due to differing calculation methods, the figures shown here may differ from those calculated by Capital Group.
Duration indicates a bond fund’s sensitivity to interest rates. Higher duration indicates more sensitivity.
Sharpe ratio uses standard deviation and excess return to determine reward per unit of risk. The higher the number, the better the portfolio's historical risk-adjusted performance.
Annualized standard deviation (based on monthly returns) is a common measure of absolute volatility that tells how returns over time have varied from the mean. A lower number signifies lower volatility.
Correlation to S&P 500 is a measurement of how returns for the fund and S&P 500 move in relation to each other. A correlation ranges from -1 to 1. A positive correlation close to 1 implies that as one moved, either up or down, the other moved in “lockstep,” in the same direction. A negative correlation close to -1 indicates the two have moved in the opposite direction.
Bloomberg U.S. Corporate Investment Grade Index represents the universe of investment grade, publicly issued U.S. corporate and specified foreign debentures and secured notes that meet the specified maturity, liquidity, and quality requirements. This index is unmanaged, and its results include reinvested distributions but do not reflect the effect of sales charges, commissions, account fees, expenses or U.S. federal income taxes.
Bloomberg U.S. Corporate High Yield 2% Issuer Capped Index covers the universe of fixed-rate, non-investment-grade debt. The index limits the maximum exposure of any one issuer to 2%. This index is unmanaged, and its results include reinvested distributions but do not reflect the effect of sales charges, commissions, account fees, expenses or U.S. federal income taxes.
American Funds Multi-Sector Income Fund Custom Index comprises: 45% Bloomberg U.S. Corporate High Yield 2% Issuer Capped Index, 30% Bloomberg U.S. Corporate Investment Grade Index, 15% J.P. Morgan EMBI Global Diversified Index, 8% Bloomberg CMBS Ex AAA Index, 2% Bloomberg ABS Ex AAA Index and blends the respective indices by weighting their cumulative total returns according to the weights described. This assumes the blend is rebalanced monthly.
J.P. Morgan Emerging Market Bond Index (EMBI) Global Diversified is a uniquely weighted emerging market debt benchmark that tracks total returns for U.S. dollar-denominated bonds issued by emerging market sovereign and quasi-sovereign entities. This index is unmanaged, and its results include reinvested dividends and/or distributions but do not reflect the effect of account fees, expenses or U.S. federal income taxes.
J.P. Morgan CEMBI Broad Diversified Index tracks the performance of US dollar-denominated bonds issued by emerging market corporate entities.
JP Morgan Government Bond Index – Emerging Markets Global Diversified covers the universe of regularly traded, liquid fixed-rate, domestic currency emerging market government bonds to which international investors can gain exposure. This index is unmanaged, and its results include reinvested dividends and/or distributions but do not reflect the effect of account fees, expenses or U.S. federal income taxes.
Bloomberg CMBS Ex AAA Index: tracks investment-grade (Baa3/BBB- or higher, excluding Aaa/AAA) commercial mortgage backed securities that are included in the Bloomberg U.S. Aggregate Index. These securities have a minimum life of at least one year and must be fixed-rated weighted average coupon or capped weighted average coupon securities.
Bloomberg ABS Ex AAA Index: covers fixed-rated investment-grade (Baa3/BBB- or higher, excluding Aaa/AAA) asset backed securities that are included in the Bloomberg U.S. Aggregate Index. The index has three subsectors, which includes credit and charge cards, autos, and utility. These securities are ERISA-eligible and must have an average life of at least one year and must be senior class, tranche B or C of the deal.