Core fixed income should help protect. It can also provide.
In today’s markets, volatility is a feature, not a bug. A well-managed core bond fund should offer some stability when equities struggle, seeking to deliver strong long-term returns.
Hypothetical growth of a $10,000 investment starting in 2009
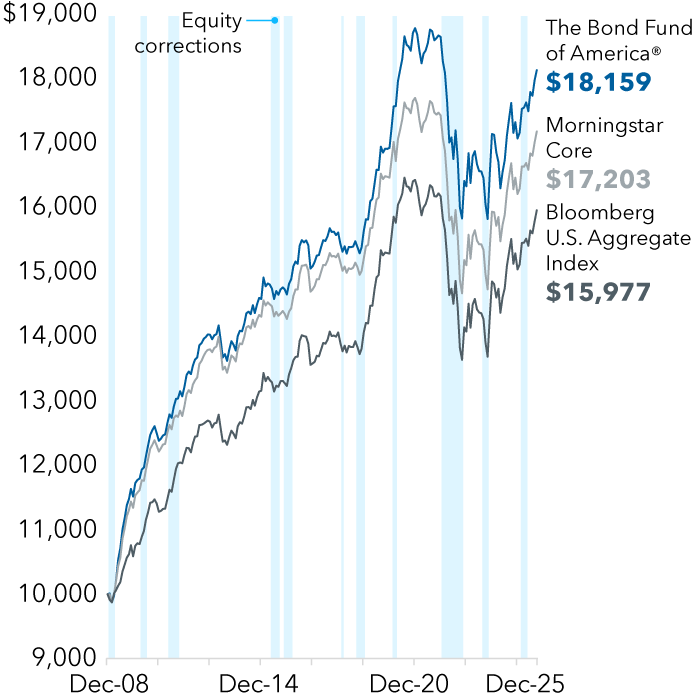
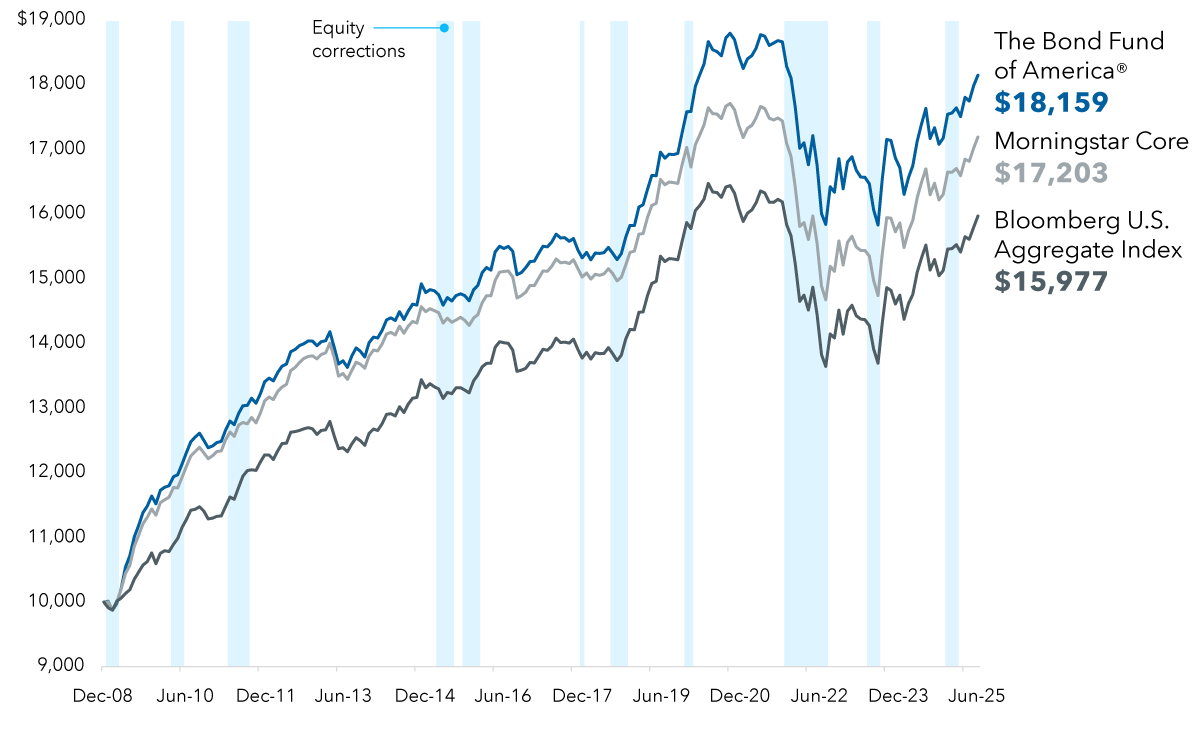
Sources: Bloomberg Index Services Limited., Capital Group, Morningstar. Data shown from 12/31/08 to 9/30/25. Data shown represents The Bond Fund of America F-2 share class, Morningstar's Intermediate Core Bond Category average and the Bloomberg U.S. Aggregate Index. Shading represents correction periods, which are based on price declines of 10% or more (without dividends reinvested) in the S&P 500 Index with at least 75% recovery. Eleven equity correction periods are highlighted as follows: 12/31/08 to 3/31/09; 3/31/10 to 6/30/10; 4/30/11 to 9/30/11; 4/30/15 to 8/31/15; 10/31/15 to 2/29/16; 1/31/18 to 2/28/18; 8/31/18 to 12/31/18; 1/31/20 to 3/31/20; 12/31/21 to 10/31/22; 2/19/25 to 5/13/25.
Featured products
CORE APPROACH
Does your core provide balance?
Our portfolio managers take a long-term approach to core bond investing. They seek to provide these roles of fixed income: diversification, capital preservation and income. Their quality-oriented approach utilizes multiple return drivers aiming to deliver consistent excess returns versus their benchmarks.
Morningstar Medalist RatingTM

Analyst-Driven 100%
Data Coverage 100%
The Bond Fund of America:
A case study in our core investing strategy
Our flagship core bond mutual fund strives to provide balance, discipline and consistency. Discover how its true core approach has helped it receive, as of 11/14/24, a Morningstar Medalist Rating of Gold for Class F-2 shares.*
-
-
Balance
BALANCE
Higher returns and better diversification?
⬤ The Bond Fund of America (BFA) (F-2)
Δ Morningstar Intermediate Core Bond Category Average
▉ Morningstar Intermediate Core-Plus Bond Category Average
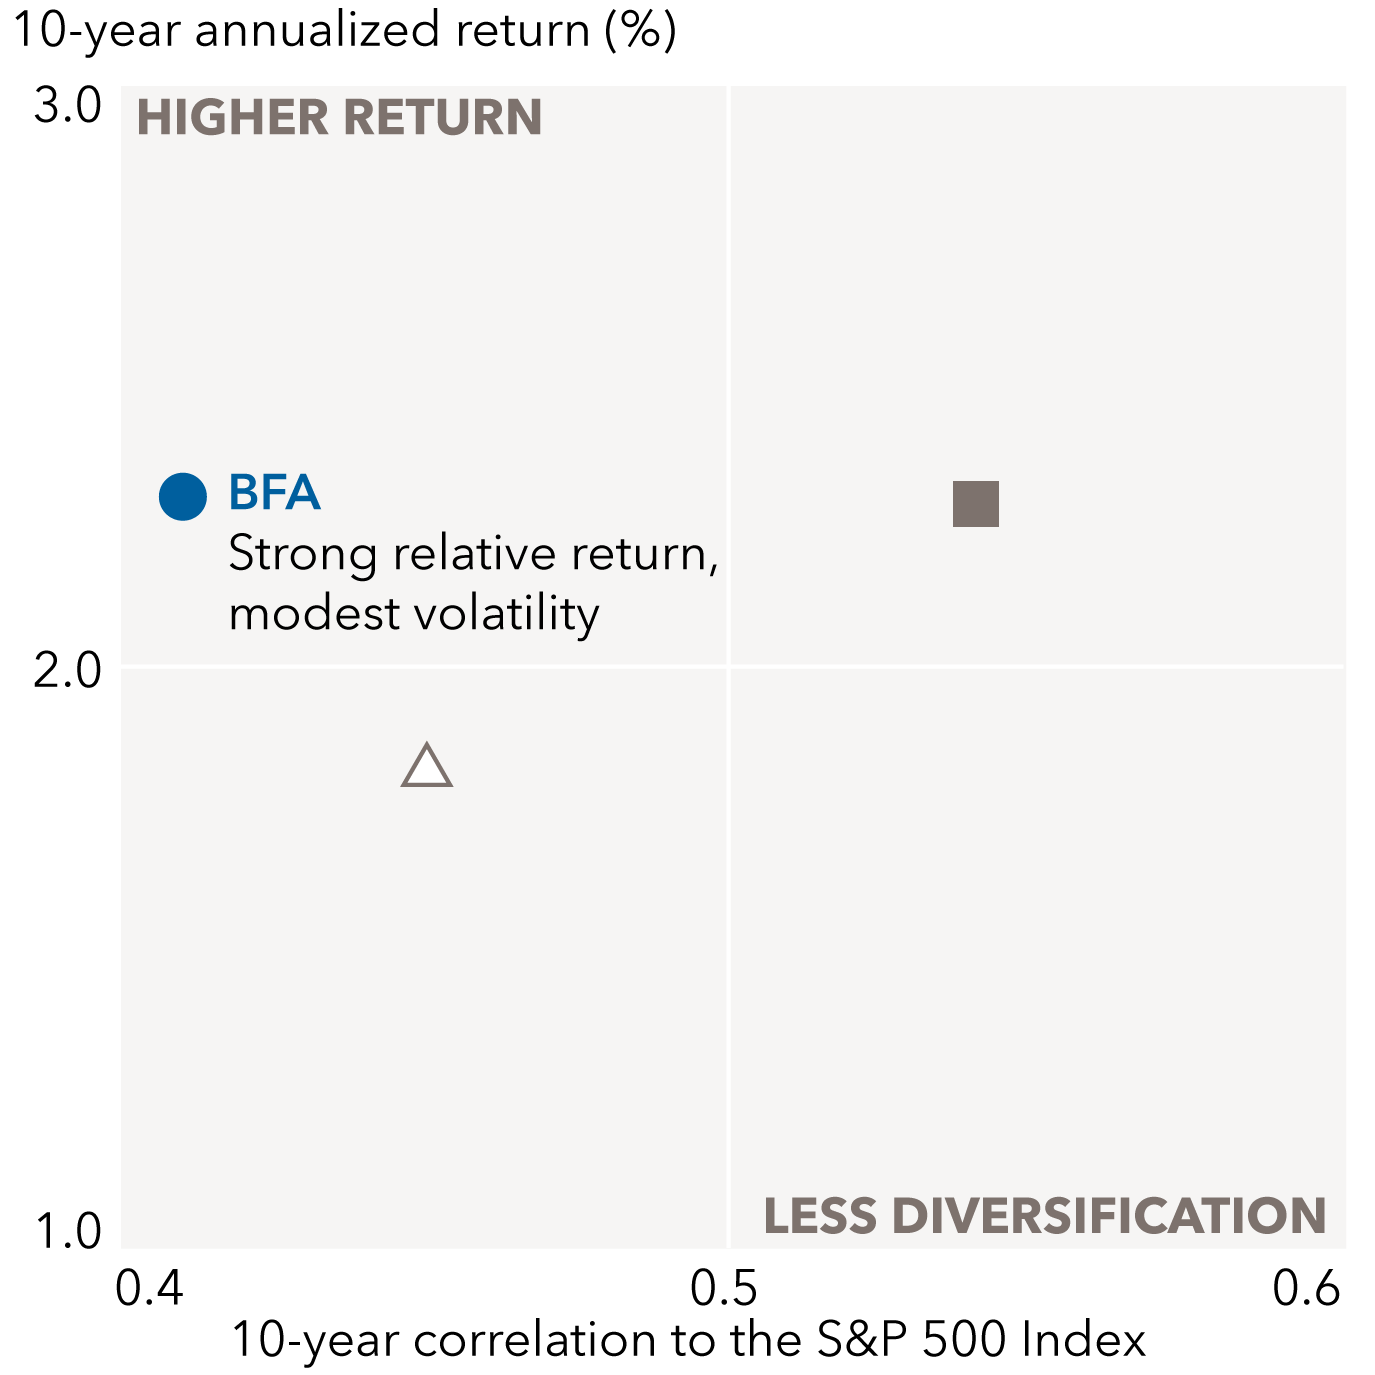
The Bond Fund of America demonstrates what our core approach has accomplished: stronger returns and better diversification compared to its average core peer.
Sources: Capital Group, Morningstar. As of 9/30/25. Metrics shown are 10-year annualized return and 10-year correlation to the S&P 500.
-
Discipline
DISCIPLINE
Maintaining a core focus
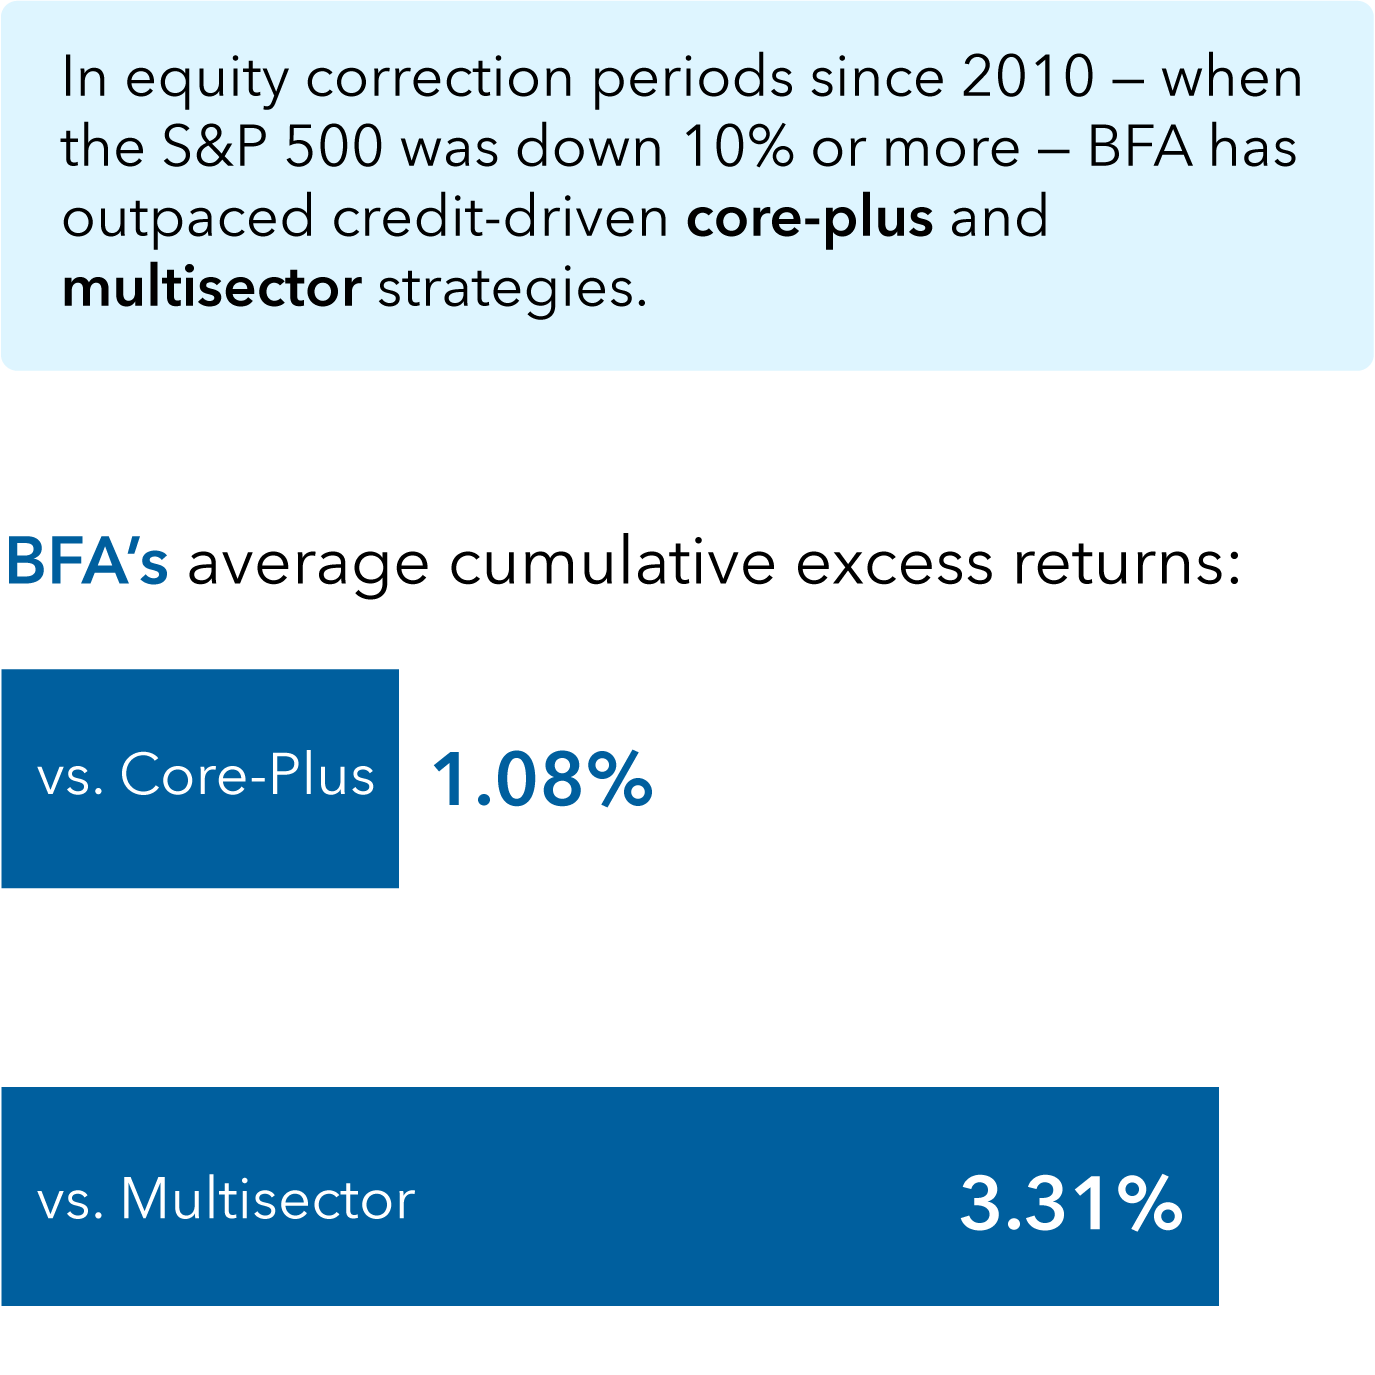
When the stock market begins to buckle, prudently managed core fixed income shouldn’t. In periods of equity volatility The Bond Fund of America has demonstrated relative resilience over more credit-driven strategies.
Sources: Capital Group, Morningstar. As of 9/30/25. Averages were calculated by using the cumulative returns of the fund versus Morningstar categories shown during the nine equity market correction periods since 2010. Corrections are based on price declines of 10% or more (without dividends reinvested) in the S&P 500 with at least 75% recovery. The cumulative returns are based on total returns. Ranges of returns for the equity corrections measured: The Bond Fund of America: -14.07% to 3.41%; Morningstar Intermediate Core-Plus Bond category: -14.73% to 2.25%; Morningstar Multisector Bond category: -14.08% to -0.75%; S&P 500 Index: -33.79% to -9.94%.
-
Commitment
COMMITMENT
Long-term excess returns
Average annual excess returns vs. funds’ benchmarks (%)
⬤ The Bond Fund of America (BFA) (F-2)
⬤ All passive peers
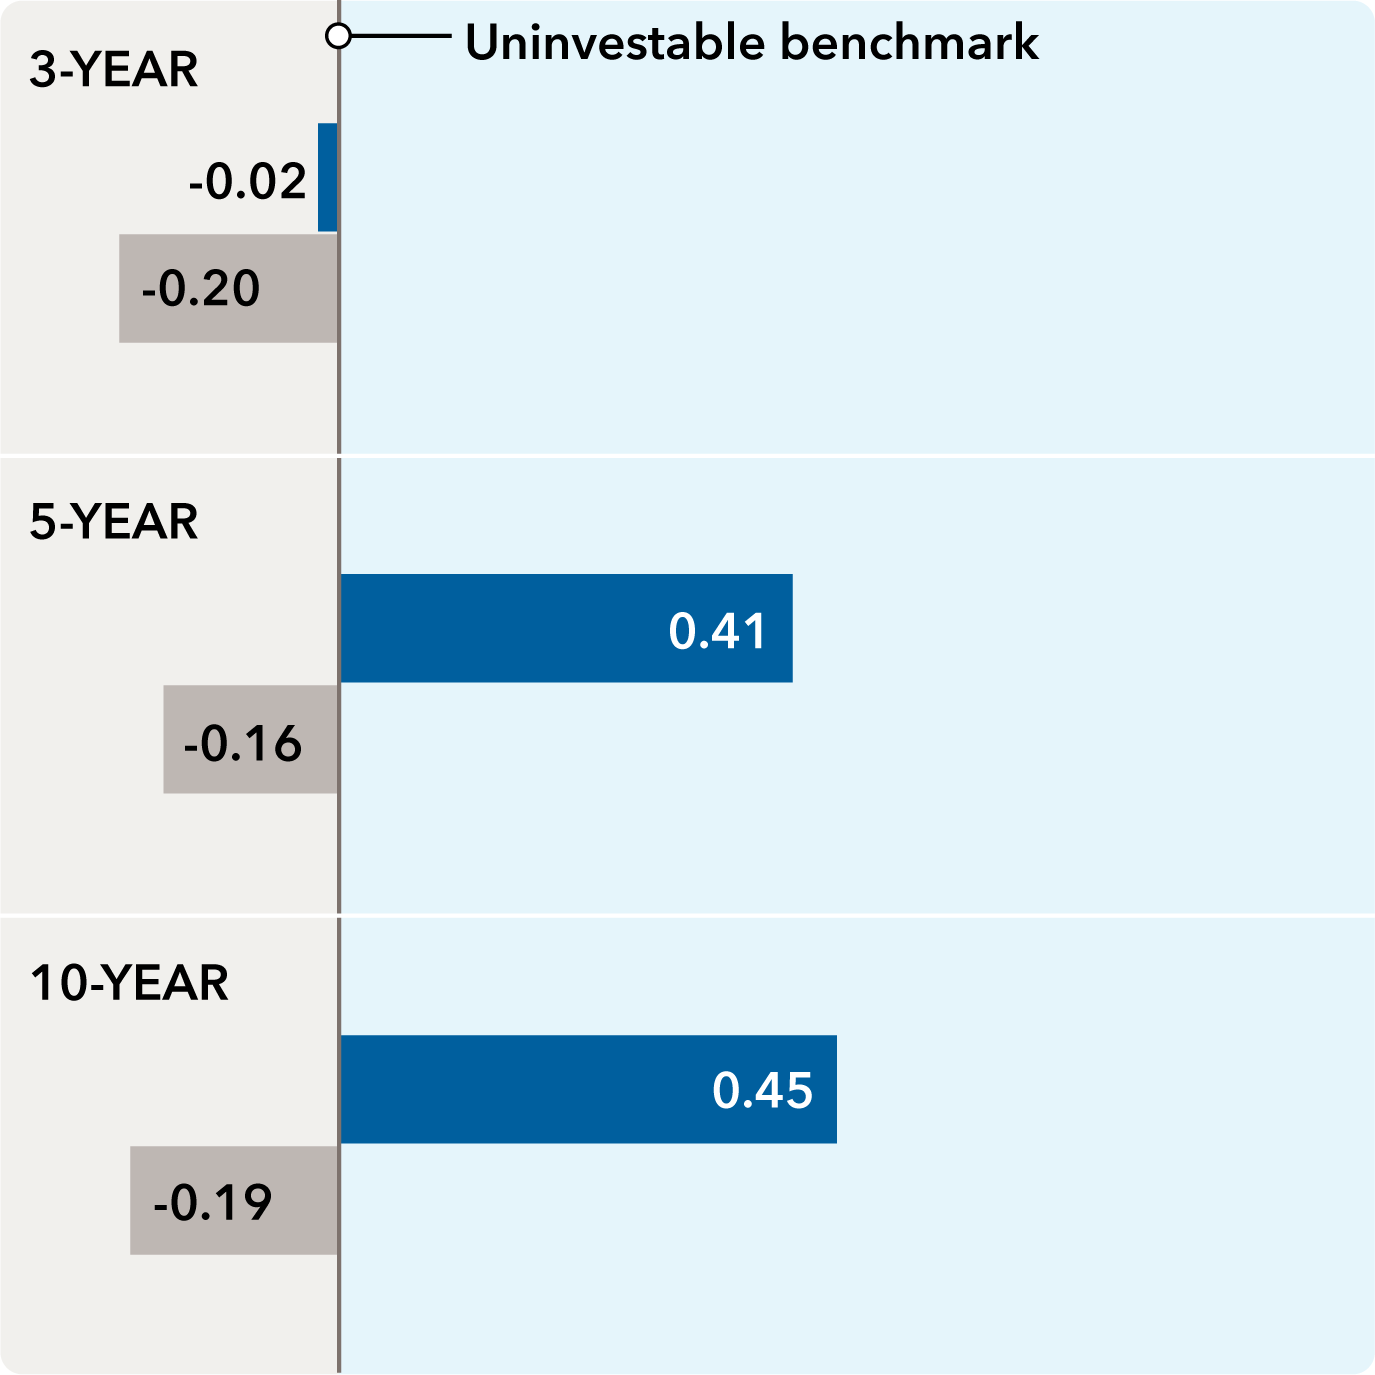
While differing in specific objective, our other core offerings rely on a similar investing approach to BFA when seeking to provide a degree of resilience and producing excess returns versus their index and passive peers.
Sources: Capital Group, Morningstar. As of 9/30/25. Index funds (passive) are not striving to outpace their benchmarks; rather, they seek to replicate the benchmark’s return pattern. When contemplating index funds versus active fixed income funds, it’s also important to consider, among other things, each fund’s investment objectives and policies, risks, tax implications from portfolio turnover and expenses. BFA excess returns shown vs. the Bloomberg U.S. Aggregate Index. For passive peers, excess returns shown vs. funds' respective prospectus benchmark net of fees from the Morningstar Intermediate Core Bond category.
-
core-plus approach
Core-plus for added return or income potential
For investors seeking a fixed income allocation that seeks to provide more return or income than a traditional core fund alongside a measure of ballast, core-plus funds are an option. Here, two distinct flavors are available, credit- or rates-driven core-plus.
-
-
Credit-driven: CGCP
CGCP
Pursuing enhanced yield
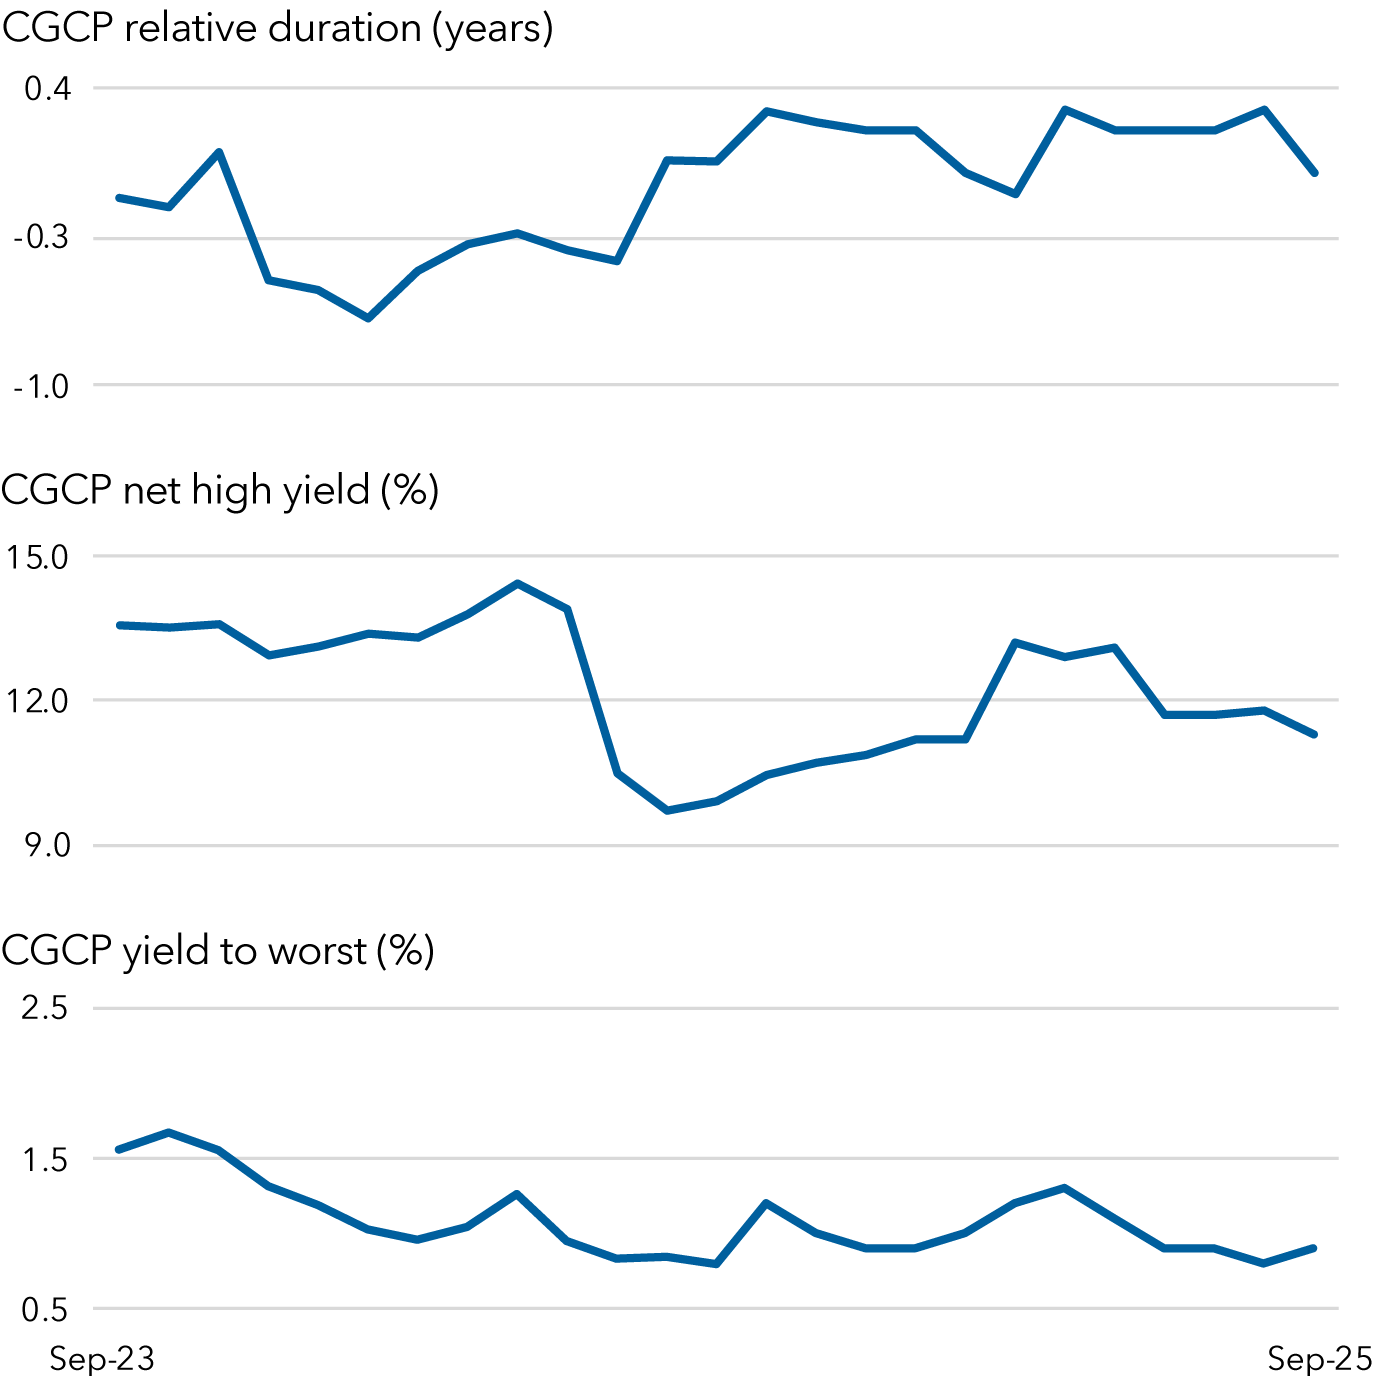
CGCP - Capital Group Core Plus Income ETF, takes a balanced approach to preserving capital and pursuing income, while seeking total return. It uses two central levers – exposure to credit sectors (corporate bonds and other non-Treasury fixed income securities) and duration positioning – to seek a higher level of income than core bond funds, alongside a multi-
faceted approach to security selection.Sources: Capital Group, Bloomberg Index Services Limited. As of 9/30/25. Relative duration and relative yield are shown versus the Bloomberg U.S. Aggregate Index. The index does not contain high-yield securities. Yield shown is yield to worst. "Net high-yield" reflects the percentage of net assets consisting of bonds rated BB/Ba and below, net the impact of credit default swap protection which are derivatives used to hedge systematic market risk.
-
Rates-driven: SBF
SBF
Seeking strong total return
⬤ American Funds Strategic Bond Fund (SBF) (F-2)
▉ Morningstar Core-Plus Category Average
○ Bloomberg U.S. Aggregate Index
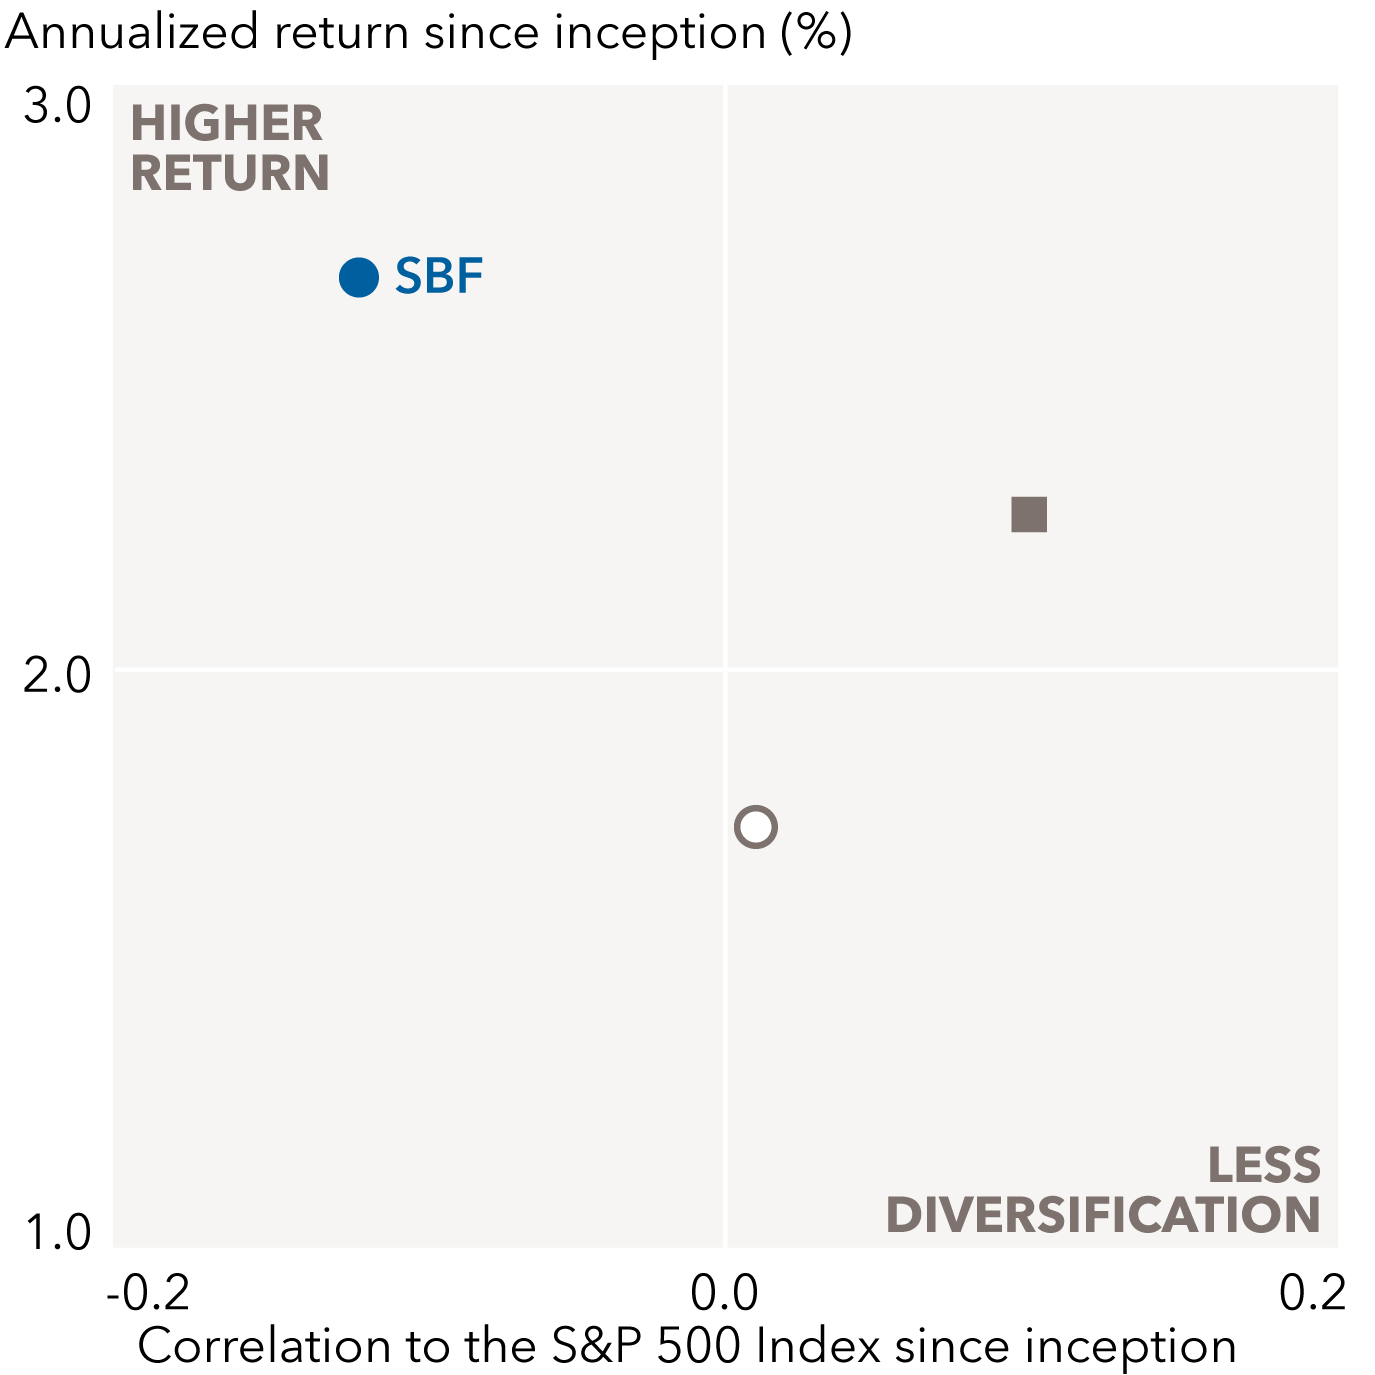
American Funds Strategic Bond Fund seeks higher returns than core bond funds with generally low equity correlation. It is a differentiated approach, which aims to drive returns primarily through interest rate positioning, generally resulting in liquid investments with high credit quality.
Sources: Capital Group, Morningstar. As of 9/30/25. Data reflects annualized return and correlation to the S&P 500 since the fund's inception. Category shown is the Morningstar Intermediate Core-Plus category.
-
Constructing a core/core-plus bond allocation
Core-plus can complement core to create a bond allocation that seeks strong return or income, while also seeking ballast.
-
-
ETF
ETF
Consider a portfolio foundation with CGCB and CGCP
A 75% CGCB, 25% CGCP
B 50% CGCB, 50% CGCP
C 25% CGCB, 75% CGCP
D Morningstar Core Category Average
E Morningstar Core-Plus Category Average
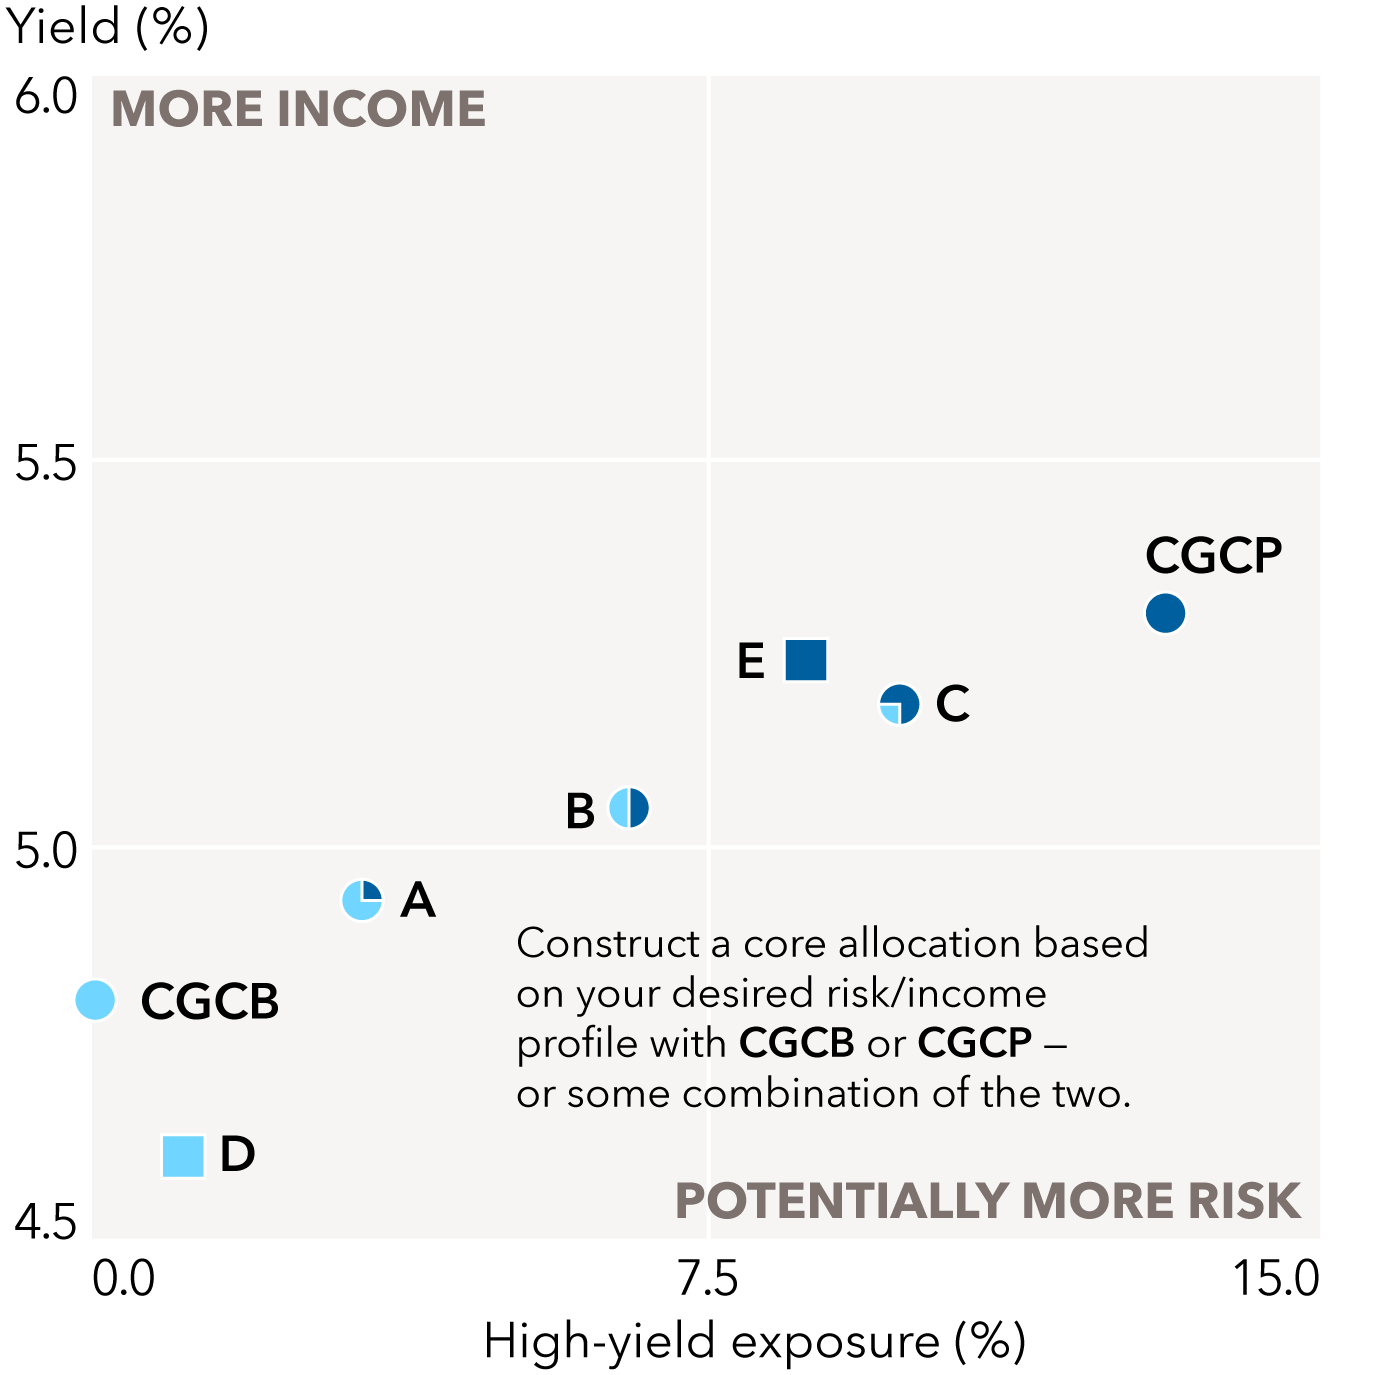
Core-plus can complement core to create a bond allocation that can provide strong return or income, while also seeking ballast.
Data reflects yield to maturity and high-yield exposure. As of 9/30/25. Sources: Capital Group, Morningstar. Morningstar Core-Plus Category Average and Morningstar Core Category Average represent the Morningstar Intermediate Core Bond Category Average and the Morningstar Intermediate Core-Plus Bond Category Average, respectively. CGCB is Capital Group Core Bond ETF. CGCP is Capital Group Core Plus Income ETF. The portfolio statistics for A, B and C are a weighted average of the funds in the asset allocation approach. The asset allocation approach is hypothetical and for illustrative purposes only. Data shown do not reflect an actual portfolio. Financial professionals should tailor client recommendations to their individual circumstances.
-
Mutual fund
MUTUAL FUND
Consider a portfolio foundation with BFA and SBF
A 75% BFA (F-2), 25% SBF (F-2)
B 50% BFA (F-2), 50% SBF (F-2)
C 25% BFA (F-2), 75% SBF (F-2)
D Morningstar Core-Plus Category Average
E Morningstar Core Category Average
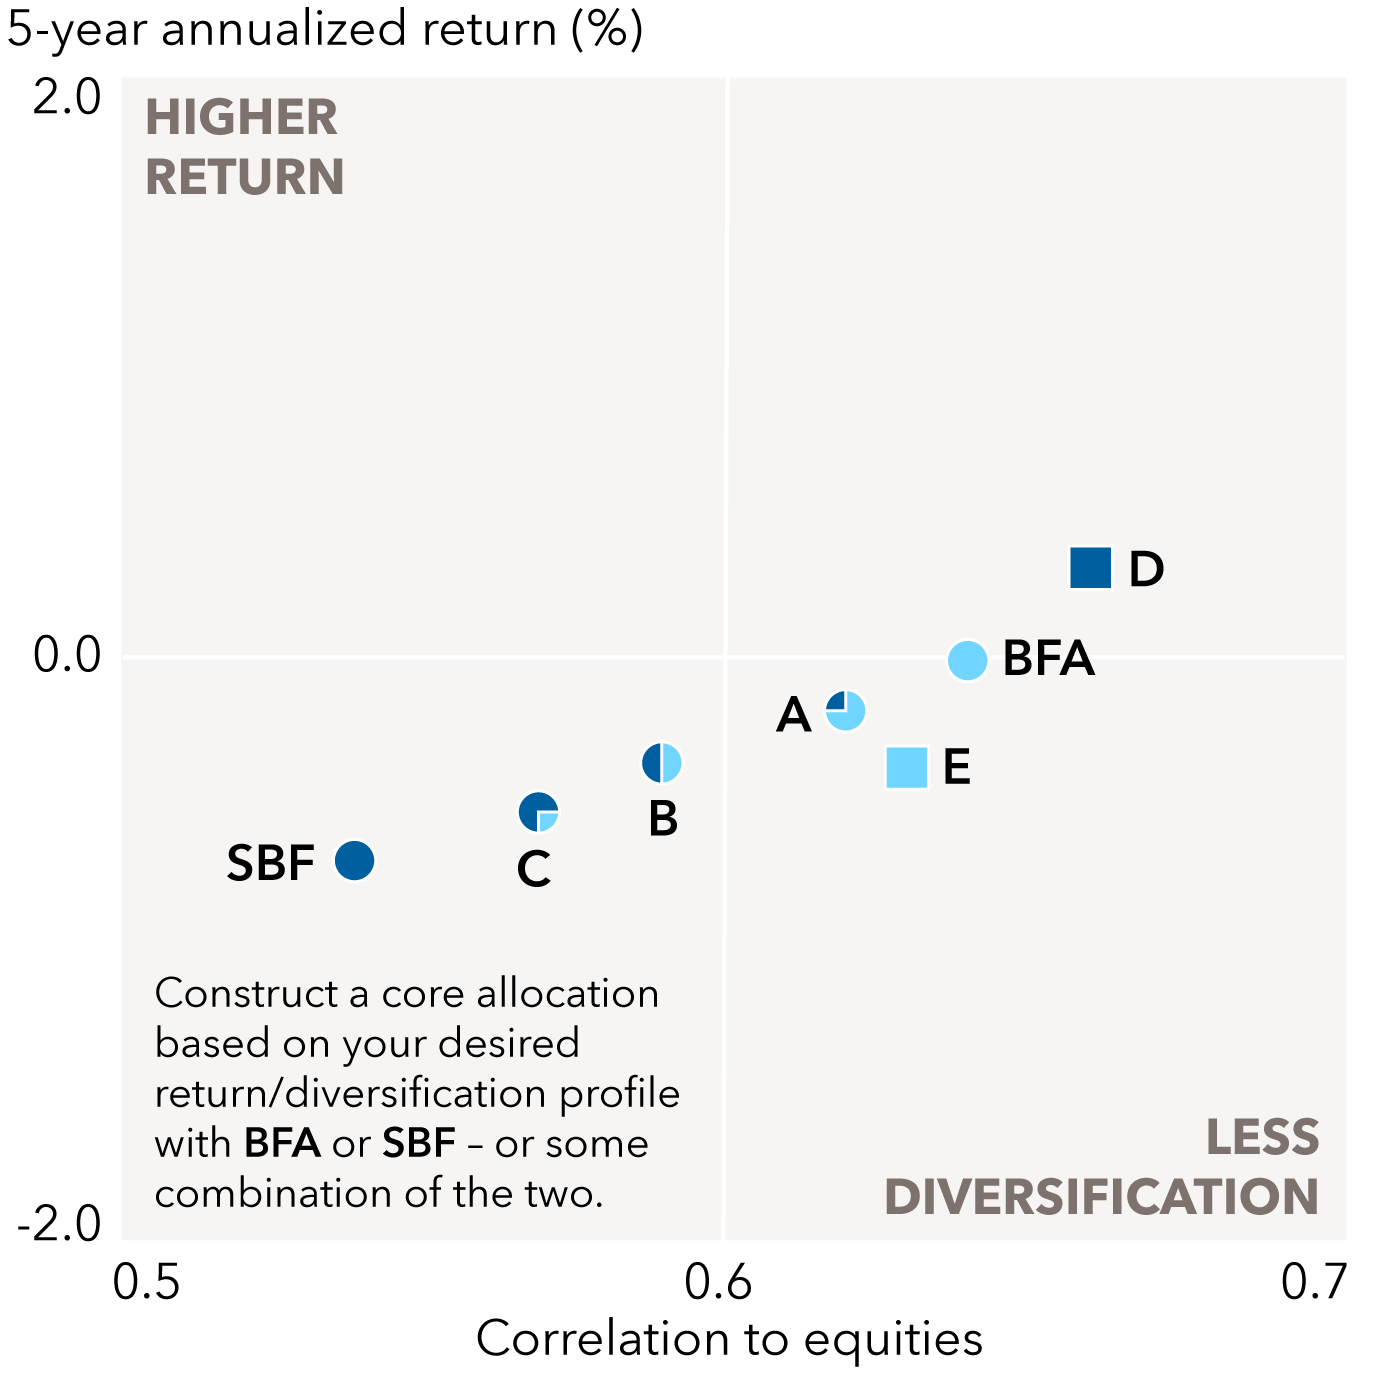
Core-plus can complement core to create a bond allocation that seeks strong return or income, while also seeking ballast.
Data reflects annualized 5-year return and 5-year correlation to the S&P 500 Index. As of 9/30/25. Class F-2 share class shown for our funds. Source: Capital Group, Morningstar. Morningstar Core-Plus Category Average and Morningstar Core Category Average represent the Morningstar Intermediate Core Bond Category Average and the Morningstar Intermediate Core-Plus Bond Category Average, respectively. BFA is The Bond Fund of America. SBF is American Funds Strategic Bond Fund. The portfolio statistics for A, B and C are a weighted average of the funds in the asset allocation approach. The asset allocation approach is hypothetical and for illustrative purposes only. Data shown do not reflect an actual portfolio. Financial professionals should tailor client recommendations to their individual circumstances.
-
Figures shown are past results and are not predictive of results in future periods. Current and future results may be lower or higher than those shown. Investing for short periods makes losses more likely. Prices and returns will vary, so investors may lose money. Market price returns for ETFs are determined using the official closing price of the fund’s shares and do not represent the returns you would receive if you traded shares at other times. View mutual fund expense ratios and returns. View ETF expense ratios and returns. View mutual fund SEC yields. View ETF SEC yields.
* The Morningstar Medalist Rating™ is the summary expression of Morningstar’s forward-looking analysis of investment strategies as offered via specific vehicles using a rating scale of Gold, Silver, Bronze, Neutral, and Negative. The Medalist Ratings indicate which investments Morningstar believes are likely to outperform a relevant index or peer group average on a risk-adjusted basis over time. Investment products are evaluated on three key pillars (People, Parent, and Process) which, when coupled with a fee assessment, forms the basis for Morningstar’s conviction in those products’ investment merits and determines the Medalist Rating they’re assigned. Pillar ratings take the form of Low, Below Average, Average, Above Average, and High. Pillars may be evaluated via an analyst’s qualitative assessment (either directly to a vehicle the analyst covers or indirectly when the pillar ratings of a covered vehicle are mapped to a related uncovered vehicle) or using algorithmic techniques. Vehicles are sorted by their expected performance into rating groups defined by their Morningstar Category and their active or passive status. When analysts directly cover a vehicle, they assign the three pillar ratings based on their qualitative assessment, subject to the oversight of the Morningstar Medalist Rating Committee, and monitor and reevaluate them at least every 14 months. When the vehicles are covered either indirectly by analysts or by algorithm, the ratings are assigned monthly. For more detailed information about these ratings, including its methodology, please go to global.morningstar.com/ managerdisclosures/.
The Morningstar Medalist Ratings are not statements of fact, nor are they credit or risk ratings. The Morningstar Medalist Rating (i) should not be used as the sole basis in evaluating an investment product, (ii) involves unknown risks and uncertainties which may cause expectations not to occur or to differ significantly from what was expected, (iii) are not guaranteed to be based on complete or accurate assumptions or models when determined algorithmically, (iv) involve the risk that the return target will not be met due to such things as unforeseen changes in management, technology, economic development, interest rate development, operating and/or material costs, competitive pressure, supervisory law, exchange rate, tax rates, exchange rate changes, and/or changes in political and social conditions, and (v) should not be considered an offer or solicitation to buy or sell the investment product. A change in the fundamental factors underlying the Morningstar Medalist Rating can mean that the rating is subsequently no longer accurate. Capital Group did not compensate Morningstar for the ratings and comments contained in this material. However, the firm has paid Morningstar a licensing fee to access and publish its ratings data. The payment of this subscription fee does not give rise to a material conflict with Morningstar.
The Bond Fund of America is the largest actively managed bond fund by assets under management in the Morningstar U.S. Intermediate Core Bond category, as of 12/31/24.
Yield to maturity is the rate of return anticipated on a bond if it is held until the maturity date.
For CGCB and CGCP, the return of principal for bond portfolios and for portfolios with significant underlying bond holdings is not guaranteed. Investments are subject to the same interest rate, inflation and credit risks associated with the underlying bond holdings.
For CGCB and CGCP, the use of derivatives involves a variety of risks, which may be different from, or greater than, the risks associated with investing in traditional securities, such as stocks and bonds.
For CGCB and CGCP, investing outside the United States involves risks, such as currency fluctuations, periods of illiquidity and price volatility. These risks may be heightened in connection with investments in developing countries.
For CGCB, nondiversified funds have the ability to invest a larger percentage of assets in the securities of a smaller number of issuers than a diversified fund. As a result, poor results by a single issuer could adversely affect fund results more than if the fund invested in a larger number of issuers. See the applicable prospectus for details.
For CGCP, higher yielding, higher risk bonds can fluctuate in price more than investment-grade bonds, so investors should maintain a long-term perspective.
For CGCP, investments in mortgage-related securities involve additional risks, such as prepayment risk.
For CGCP, frequent and active trading of portfolio securities may occur, which may involve correspondingly greater transaction costs, adversely affecting the results.
Investment results assume all distributions are reinvested and reflect applicable fees and expenses.
S&P 500 Index is a market capitalization-weighted index based on the results of approximately 500 widely held common stocks.
Bloomberg U.S. Aggregate Index represents the U.S. investment-grade fixed-rate bond market.
The Core category contains portfolios that invest primarily in investment-grade U.S. fixed-income issues and hold less than 5% in below-investment-grade exposures. The Core-Plus category contains portfolios that invest primarily in investment-grade U.S. fixed-income issues but have greater flexibility than core offerings to hold non-core sectors such as corporate high yield, bank loan, emerging-markets debt, and non-U.S. currency exposures.
