Capital Group Ultra Short Income ETF
- Abbreviation
- CGUI
- Vehicle
- ETF
- Category
- Ultrashort Bond
Short-term bonds strive to provide compelling income relative to cash-like investments with low interest rate sensitivity. Amid market uncertainty, short-term bonds may be an attractive option for investors.
seek opportunity
Average yields on short-term bonds rose materially from a low of 0.22% in January 2021 to peak at 5.40% in October 20231 and remain elevated compared to the past 15 years. Yields on short-term bonds are outpacing those of money market securities. Our short-term bond funds strive to provide investors with attractive income opportunities, while also seeking to limit interest rate risk and preserve capital.
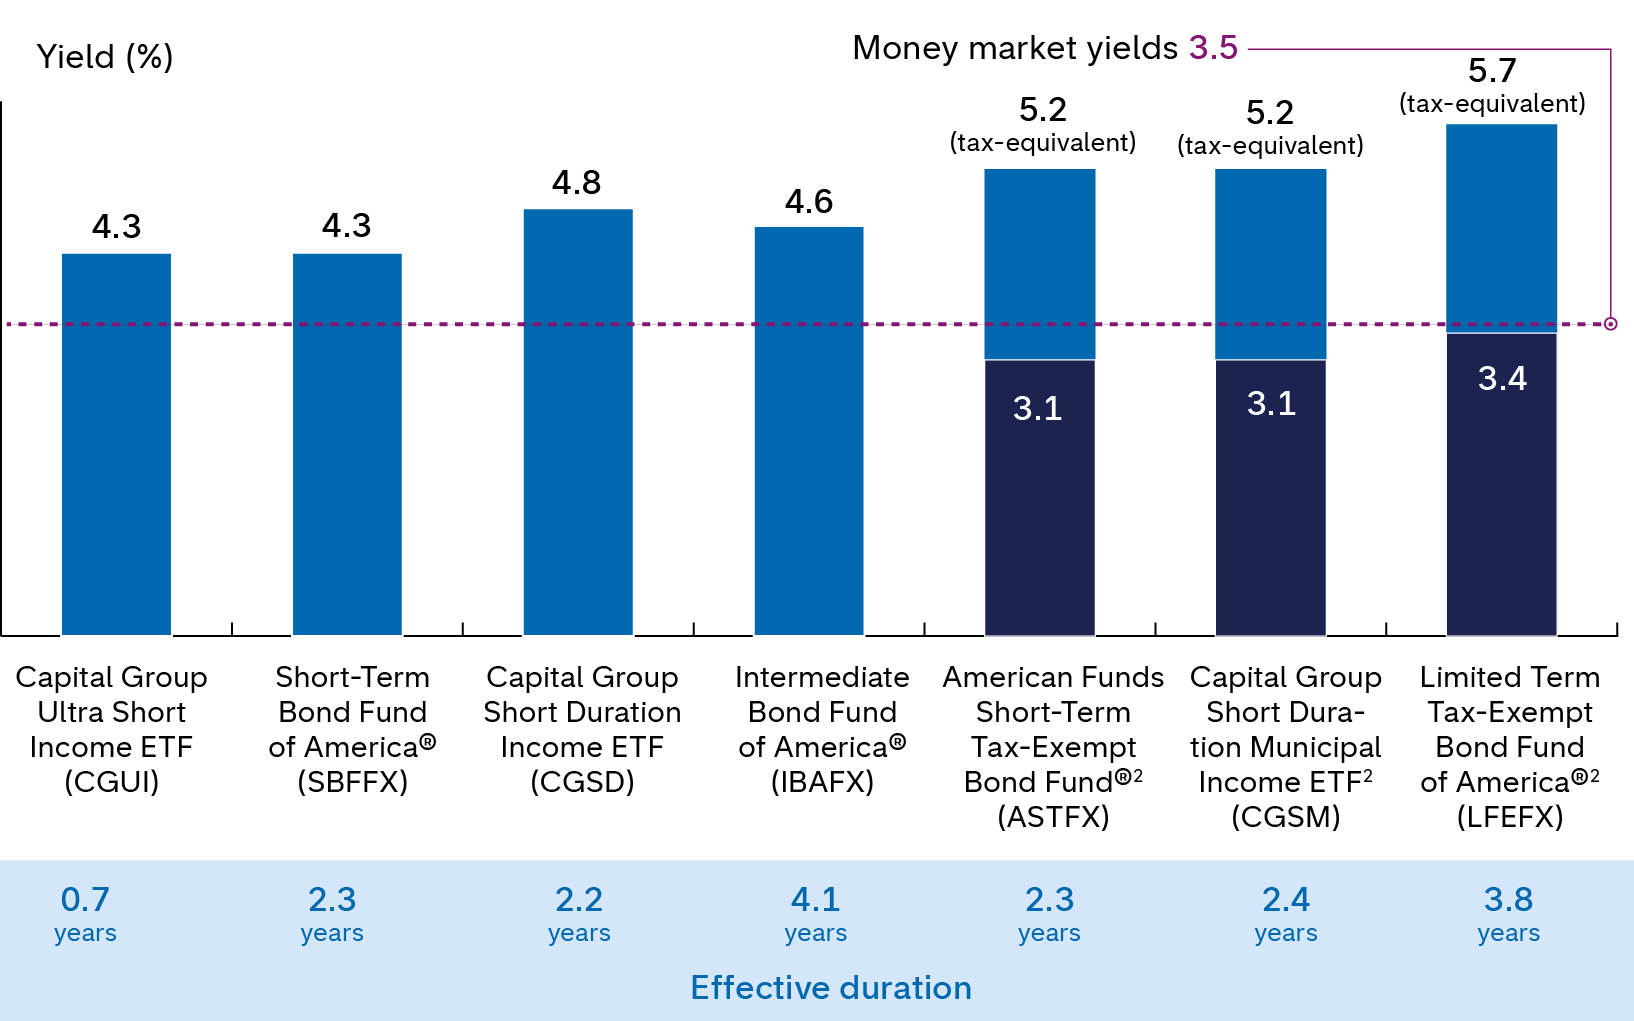
Sources: Bloomberg Index Services, Ltd., Capital Group, Morningstar. Data as of 3/31/26. Yields shown are yield to worst for the taxable funds and tax-equivalent yields for the tax-exempt funds. Money market yields represent Morningstar U.S. Prime Money Market category average.
Footnotes/Important information:
1Figures displayed are yield to worst for the Bloomberg U.S. Government/Credit (1–3 years) Index.
2Yields shown are tax-equivalent yields (TEY). TEY = tax-free municipal bond yield / (1 - tax rate). (Based on federal marginal tax rate of 37%, the top 2026 tax bracket. In addition, we have applied the 3.8% Medicare tax.)
FUND DETAILS
Explore our range of offerings to find the right fit for your portfolio.
Capital Group's suite of short-term bond funds take an active, risk-aware approach to short-term bond investing, building high-quality and diversified portfolios through deep fundamental research.
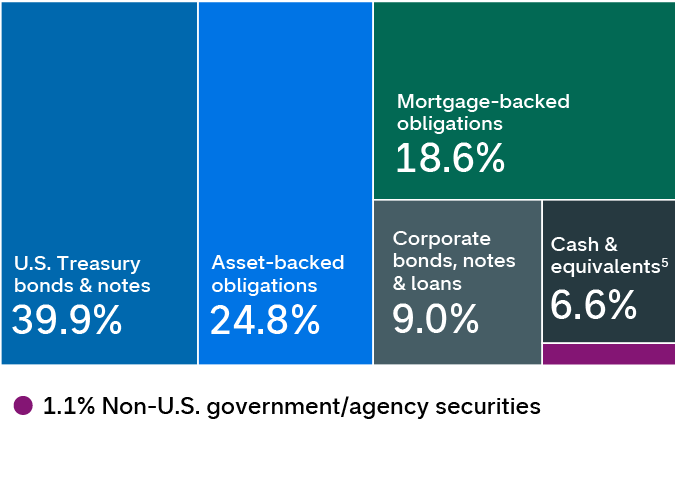
CGUI
67.9%
of the fund's holdings are rated A- or higher, or held in cash
2.5%
of the fund's holdings are rated BB+ or lower
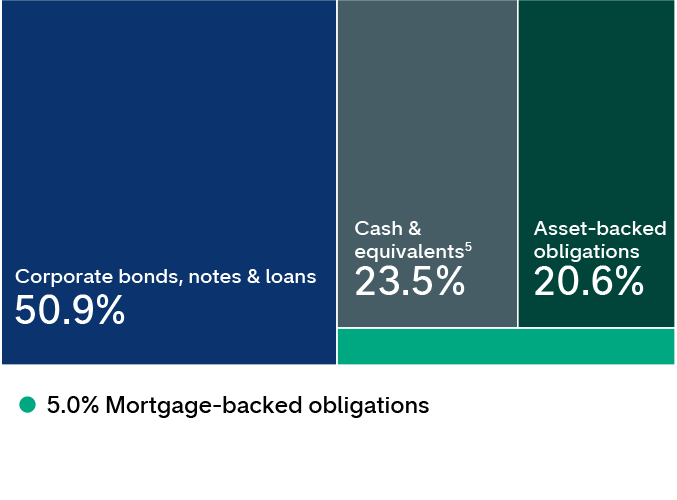
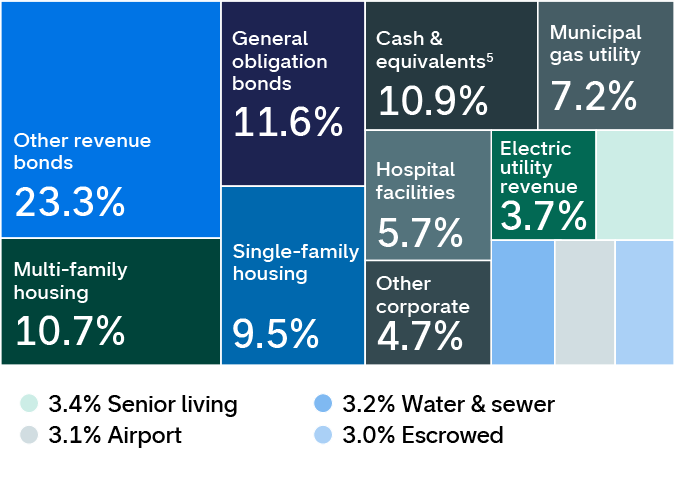
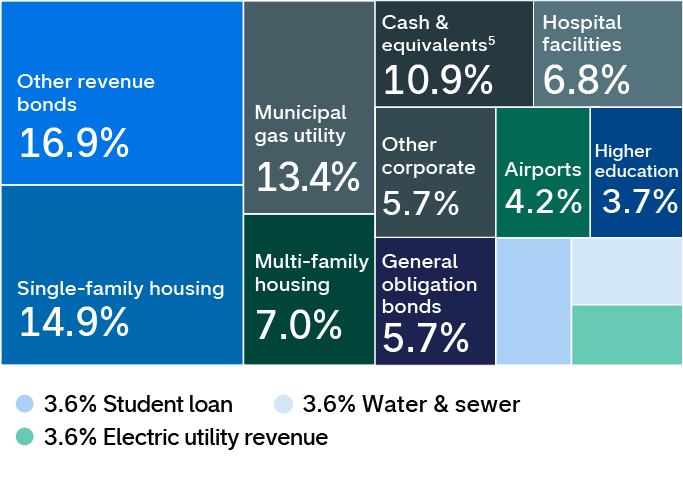
Data as of 3/31/26. Totals may not reconcile due to rounding and/or cash flows.
5Cash and equivalents includes cash, short-term securities, other assets less liabilities, and certain accruals. It may also include investments in money market or similar funds managed by the investment adviser or its affiliates that are not offered to the public.
Targeting attractive income opportunities with a focus on liquidity and capital preservation
CGUI
The fund aims to pursue superior returns relative to cash while seeking capital preservation and liquidity. Utilizing deep fundamental research, managers invest primarily in a high-quality mix of corporate bonds, asset-backed securities and short-term money market instruments such as commercial paper. The fund targets an average portfolio duration of one year or less.
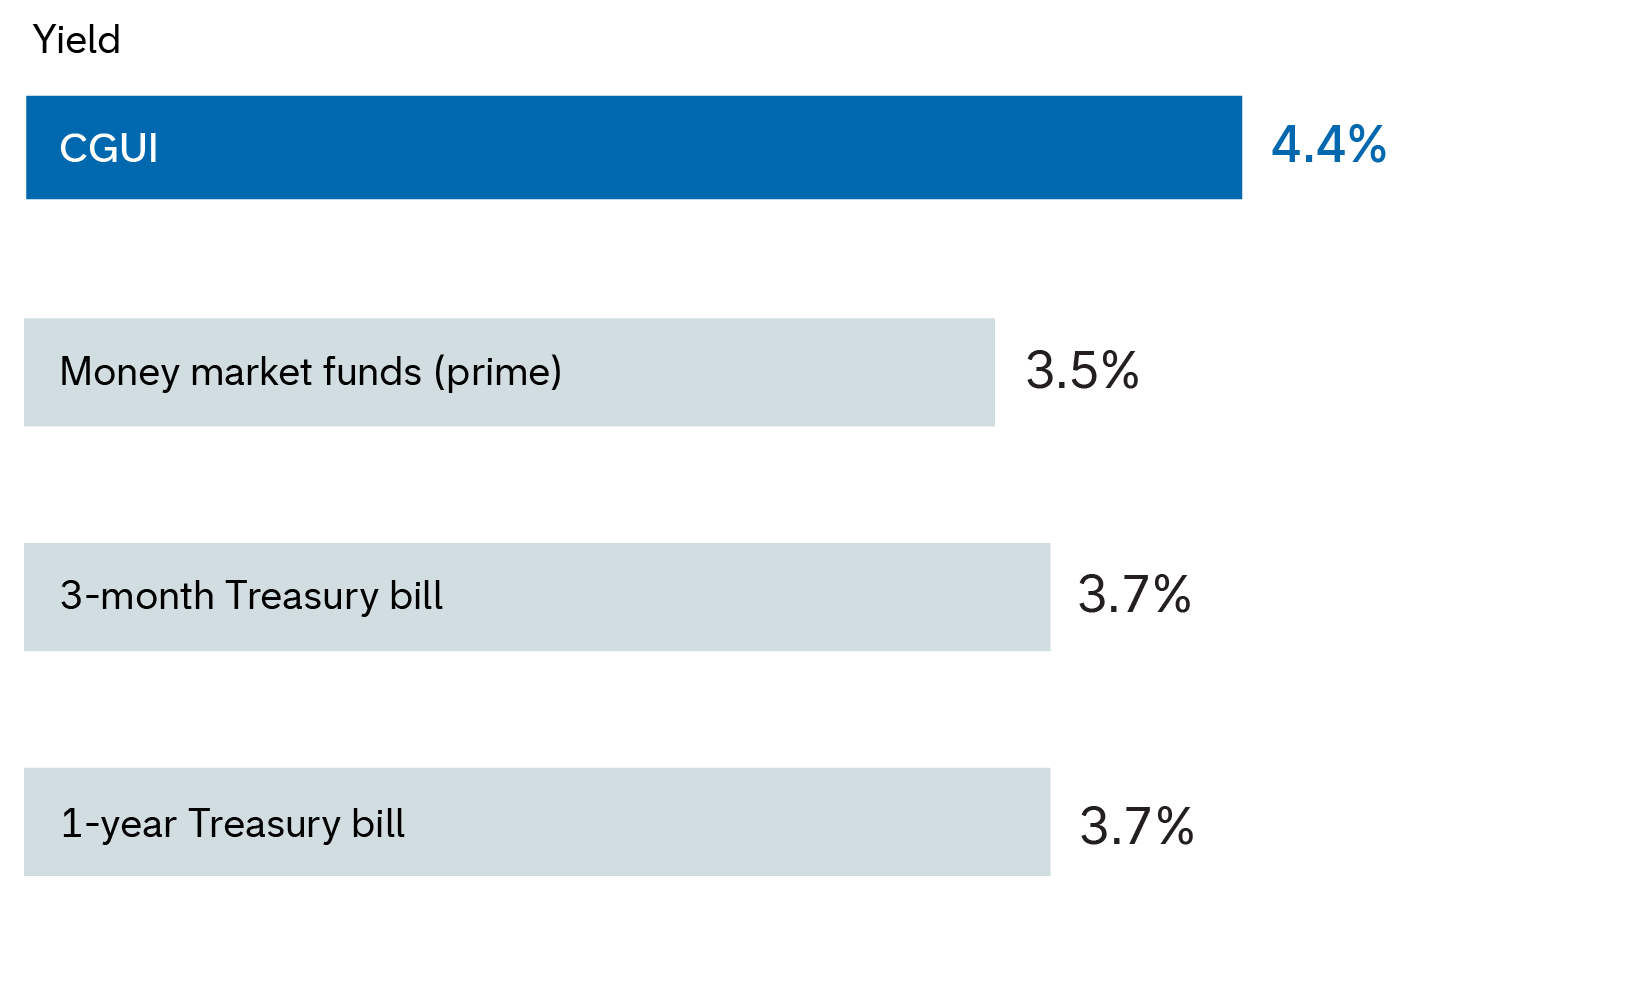
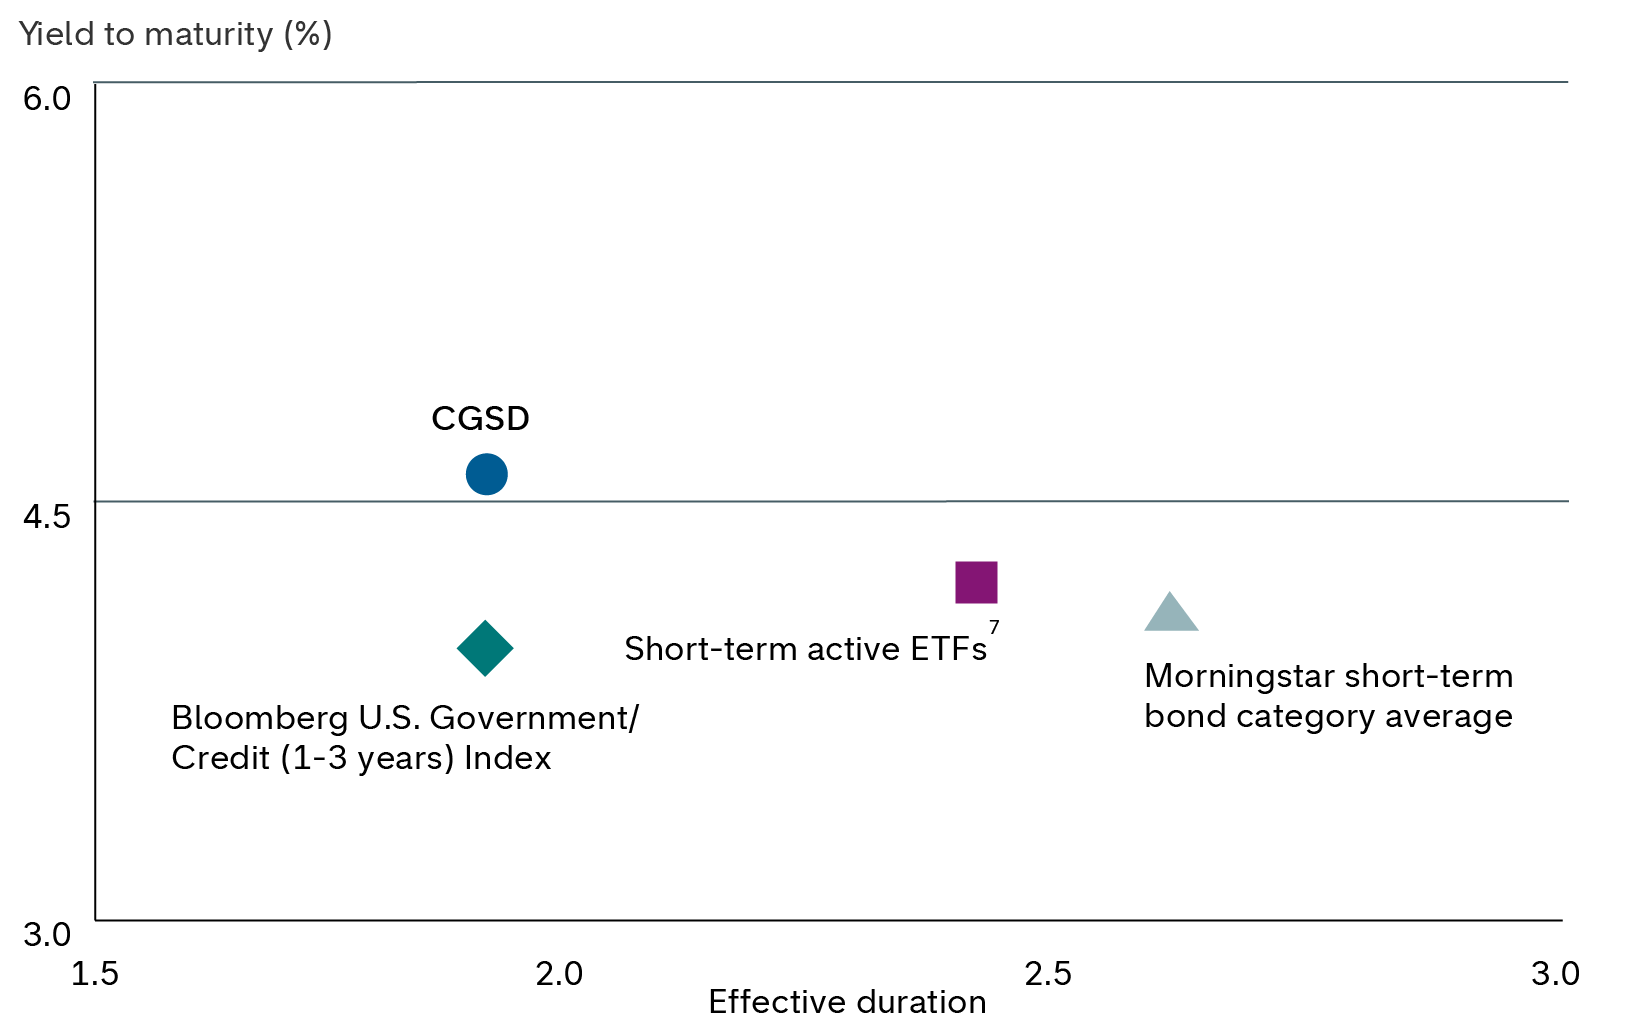
Sources: Bloomberg, Capital Group, Morningstar. As of 3/31/26. Yields for CGUI and 3-month Treasury bill are yield to worst. Money market fund yields are 7-day yields based on the Morningstar Category median. ETF statistics based on NAV. Prime money market funds invest in floating-rate debt and commercial paper of non-Treasury assets, including those issued by corporations. Taxable money market funds invest in debt issued by the U.S. Treasury, U.S. government agencies and government-sponsored enterprises (GSEs), to maintain a focus on capital preservation.
Data as of 3/31/26.
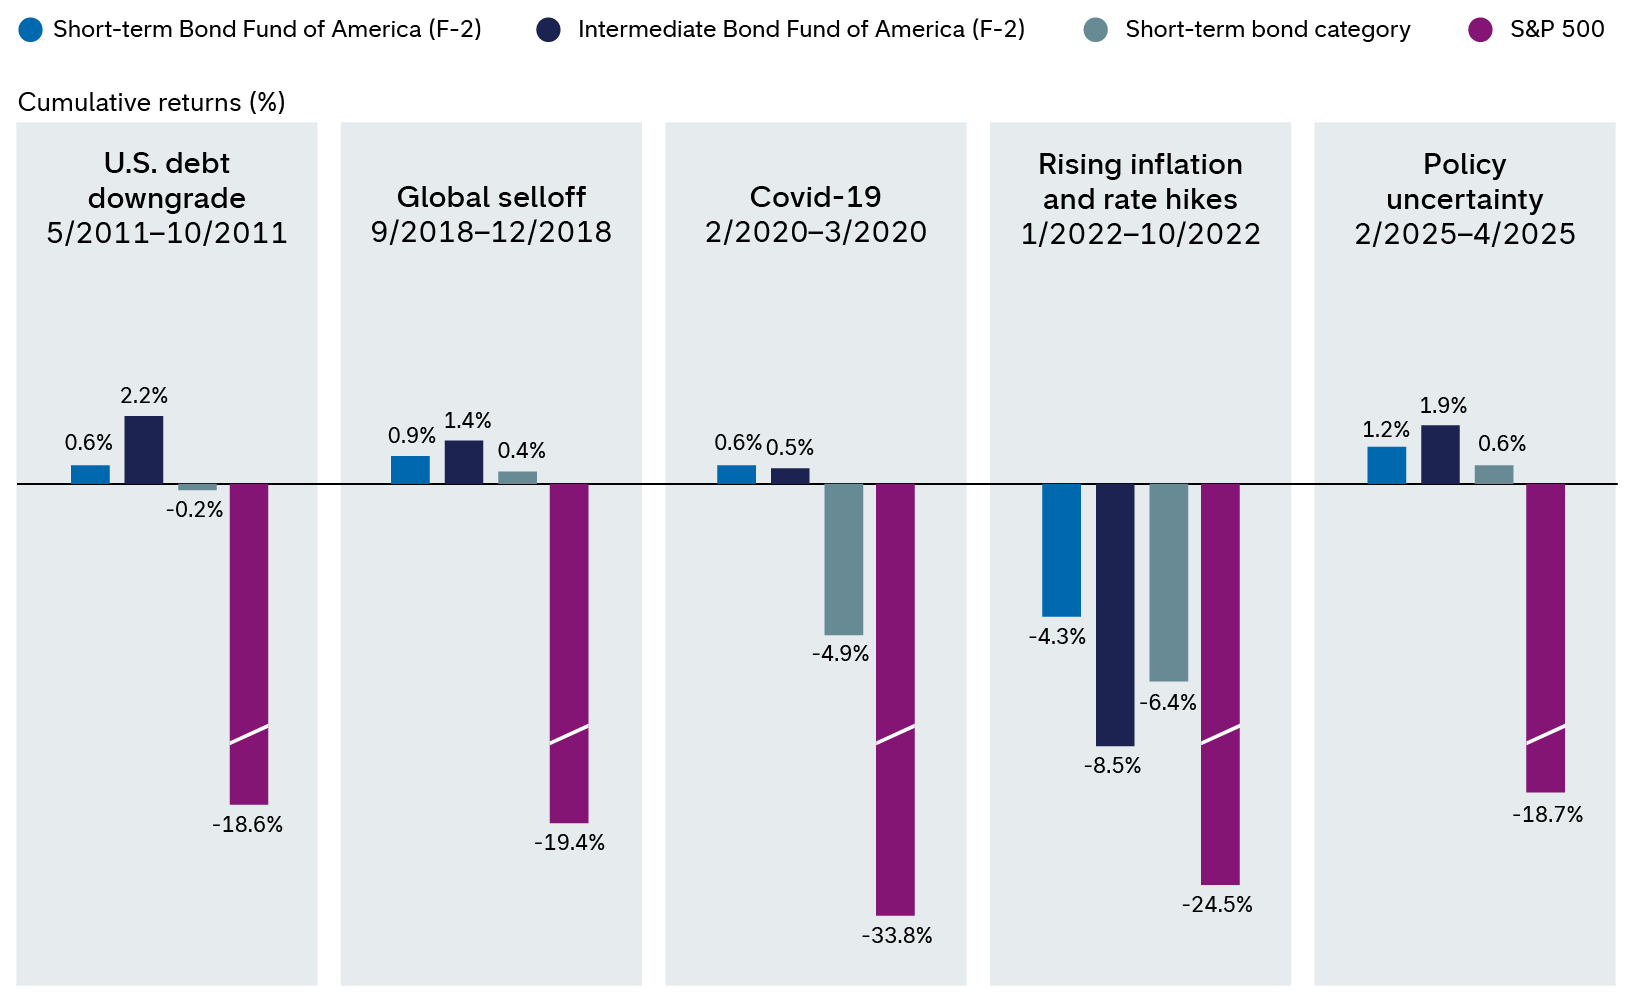
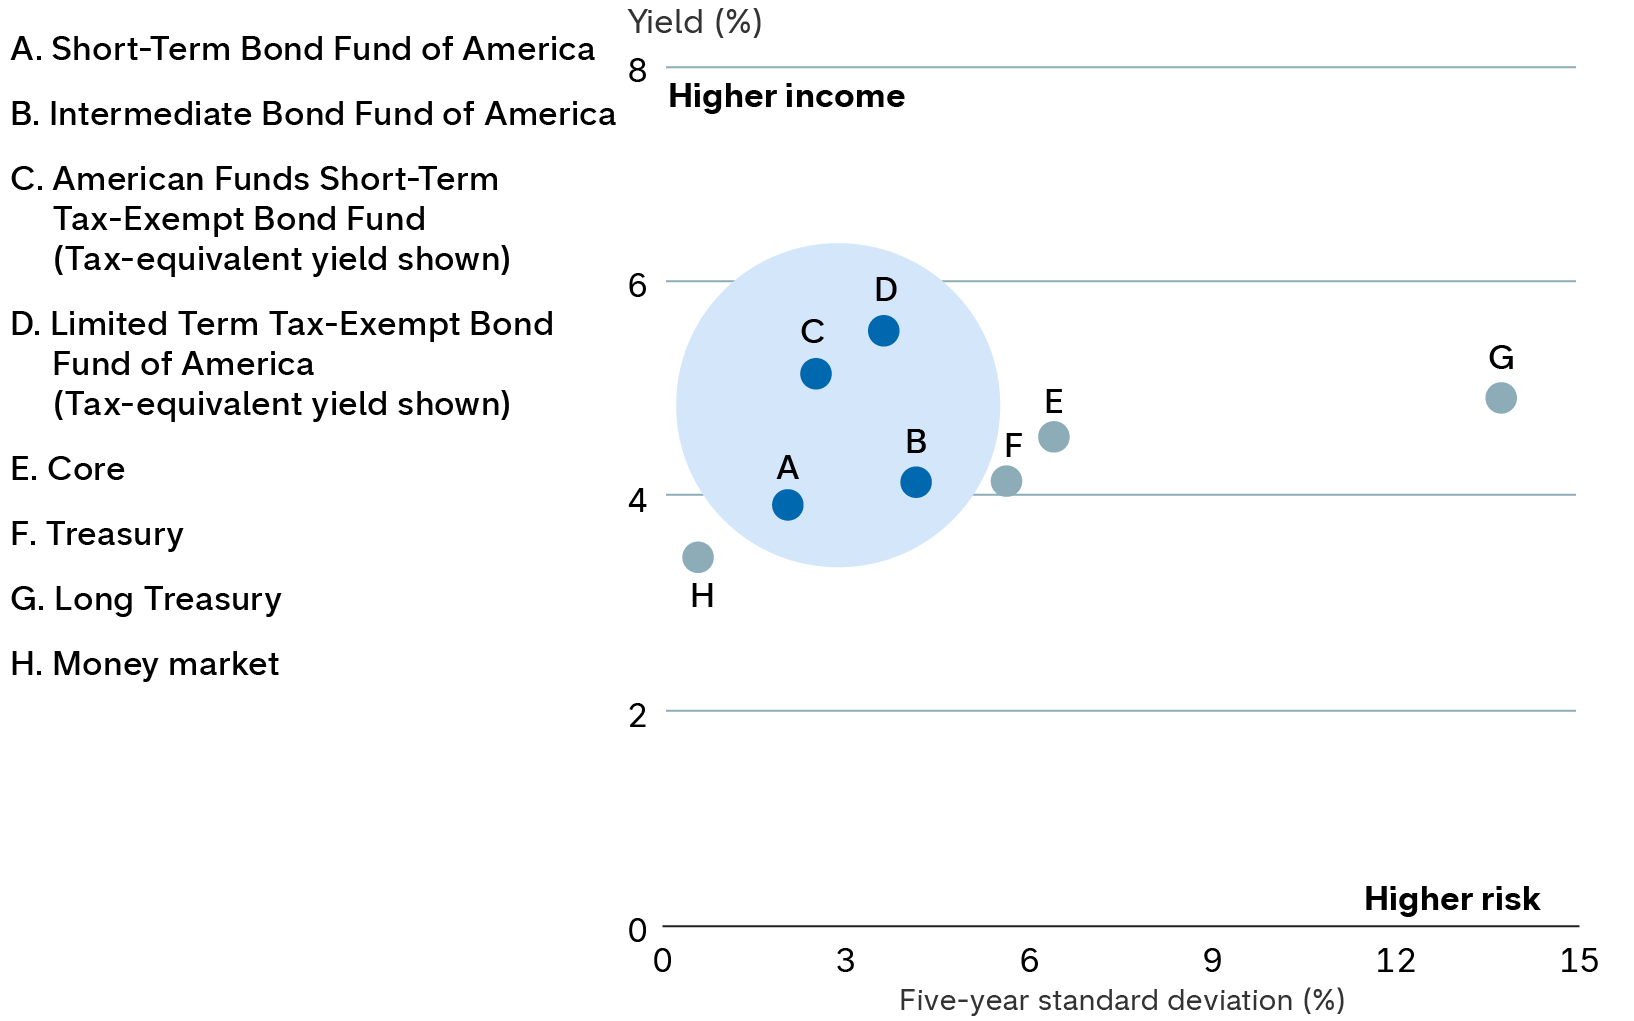
Look to short-term bonds for a measure of capital preservation when facing potential equity market turbulence.
NAVIGATING EQUITY CORRECTIONS
Seek capital preservation and aim to reduce volatility during stock market downturns with short-term bonds. Learn more about how our taxable short-term mutual funds have stacked up against the short-term category during periods of equity stress.
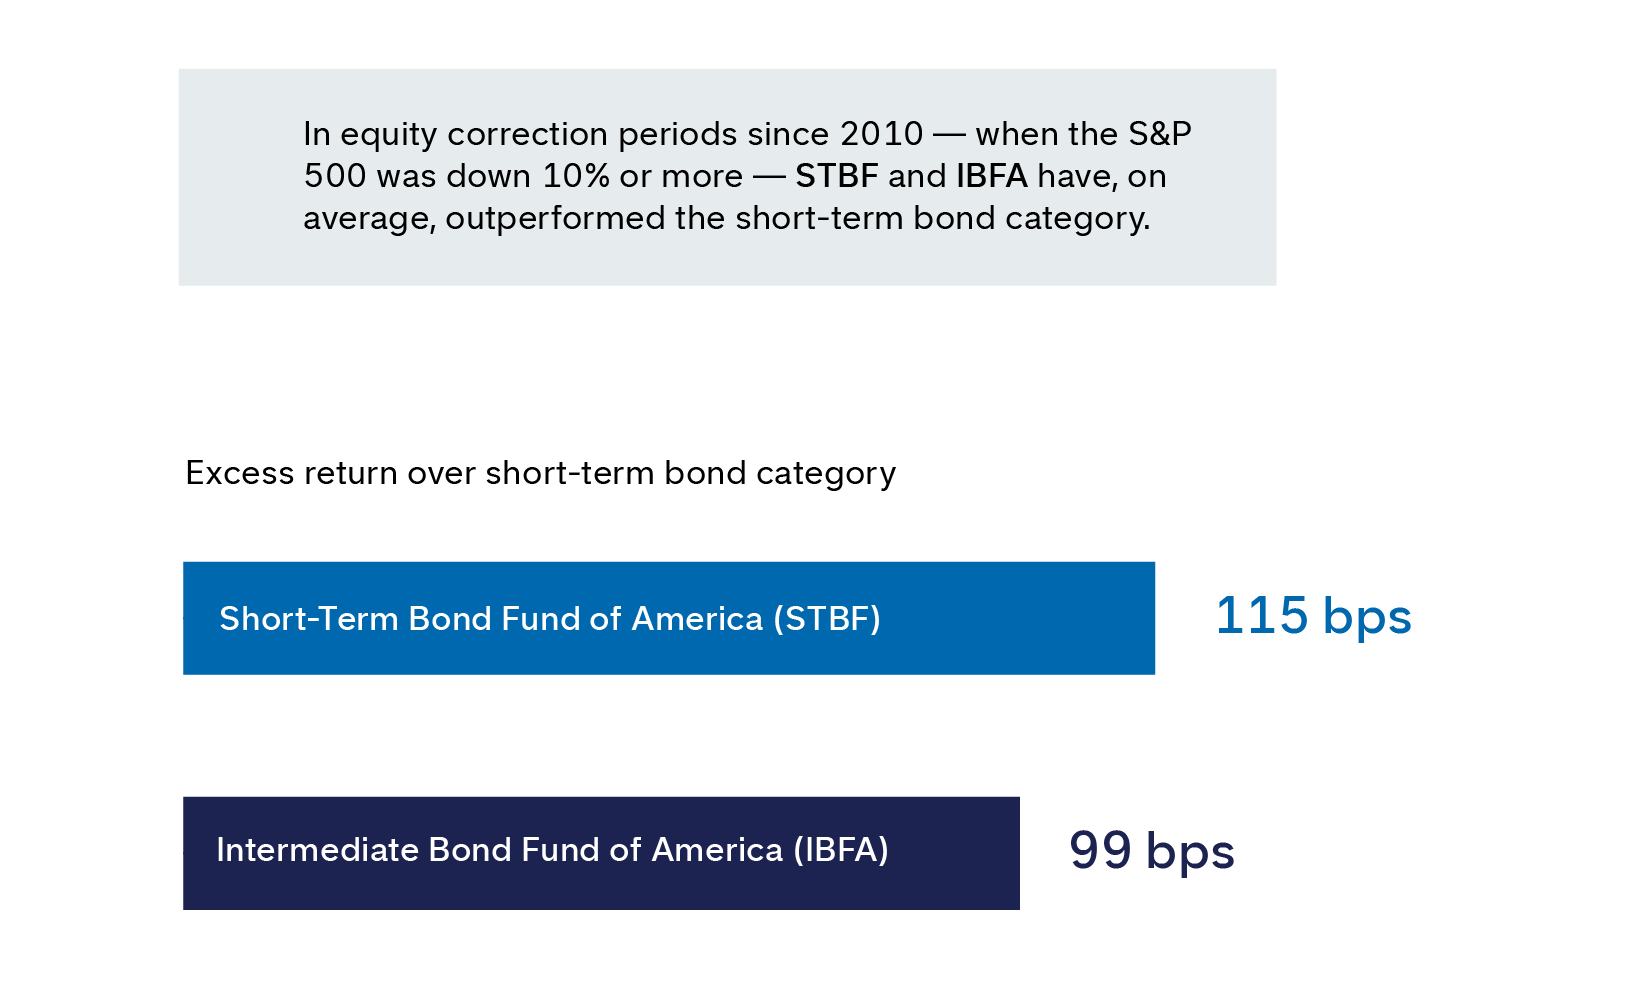
Sources: Capital Group, Morningstar. Data as of 3/31/26. Figures were calculated by using the average cumulative returns of funds versus the average cumulative returns of the Morningstar Short-term Bond category shown during the 10 equity market correction periods since 2010. Corrections are based on price declines of 10% or more (without dividends reinvested) in the S&P 500 with at least 75% recovery. The cumulative returns are based on total returns. Ranges of returns for the equity corrections measured: Short-Term Bond Fund of America: -4.25% to 1.20%; Intermediate Bond Fund of America: -8.49% to 2.29%; Morningstar U.S Fund Short-Term Bond category: -6.38% to 0.66%; S&P 500 Index: -33.79% to -9.94%. There have been periods when the funds have lagged the categories and the index, such as in rising equity markets.
Figures shown are past results and are not predictive of results in future periods. Current and future results may be lower or higher than those shown. Investing for short periods makes losses more likely. Prices and returns will vary, so investors may lose money. View mutual fund expense ratios and returns. View ETF expense ratios and returns. View current mutual fund SEC yields. View current ETF SEC yields.
Investments are not FDIC-insured, nor are they deposits of or guaranteed by a bank or any other entity, so they may lose value.
Investors should carefully consider investment objectives, risks, charges and expenses. This and other important information is contained in the ETF prospectuses and summary prospectuses, which can be obtained from a financial professional and should be read carefully before investing. This and other important information is contained in the mutual fund prospectuses and summary prospectuses, which can be obtained from a financial professional and should be read carefully before investing.
Capital Group exchange-traded funds (ETFs) are actively managed and do not seek to replicate a specific index. ETF shares are bought and sold through an exchange at the then current market price, not net asset value (NAV), and are not individually redeemed from the fund. Shares may trade at a premium or discount to their NAV when traded on an exchange. Brokerage commissions will reduce returns. There can be no guarantee that an active market for ETFs will develop or be maintained, or that the ETF's listing will continue or remain unchanged.
The expense ratios are as of each fund's prospectus available at the time of publication.
Bond ratings, which typically range from AAA/Aaa (highest) to D (lowest), are assigned by credit rating agencies such as Standard & Poor's, Moody's and/or Fitch, as an indication of an issuer's creditworthiness. Unless otherwise noted below, if agency ratings differ, a security will be considered to have received the highest of those ratings, consistent with applicable investment policies. Securities in the Unrated category have not been rated by any of the rating agencies referenced above; however, the investment adviser performs its own credit analysis and assigns comparable ratings that are used for compliance with applicable investment policies.
The S&P 500 (“Index”) is a product of S&P Dow Jones Indices LLC and/or its affiliates and has been licensed for use by Capital Group. Copyright © 2026 S&P Dow Jones Indices LLC, a division of S&P Global, and/or its affiliates. All rights reserved. Redistribution or reproduction in whole or in part is prohibited without written permission of S&P Dow Jones Indices LLC.
For CGUI, funds that concentrate investments in specific asset classes, industries, markets or sectors may underperform or be more volatile than, the general securities markets or funds that do not have such concentration.
Investments in mortgage-related securities involve additional risks, such as prepayment risk (also applies to CGSD).
The use of derivatives involves a variety of risks, which may be different from, or greater than, the risks associated with investing in traditional securities, such as stocks and bonds (also applies to CGSD and CGUI).
The return of principal for bond portfolios and for portfolios with significant underlying bond holdings is not guaranteed. Investments are subject to the same interest rate, inflation and credit risks associated with the underlying bond holdings (also applies to CGSD, CGSM and CGUI).
Income from municipal bonds may be subject to state or local income taxes and/or the federal alternative minimum tax. Certain other income, as well as capital gain distributions, may be taxable (also applies to CGSM).
Investing outside the United States involves risks, such as currency fluctuations, periods of illiquidity and price volatility. These risks may be heightened in connection with investments in developing countries (also applies to CGSD and CGUI).
Higher yielding, higher risk bonds can fluctuate in price more than investment-grade bonds, so investors should maintain a long-term perspective (also applies to CGSM).
Nondiversified funds have the ability to invest a larger percentage of assets in the securities of a smaller number of issuers than a diversified fund. As a result, poor results by a single issuer could adversely affect fund results more than if the fund invested in a larger number of issuers (also applies to CGSM and CGUI). See the applicable prospectus for details.
Portfolios are managed, so holdings will change. Certain fixed income and/or cash and equivalents holdings may be held through mutual funds managed by the investment adviser or its affiliates that are not offered to the public.
Footnote/Important information:
4Cash-like instruments like money market funds seek to provide some level of income. Bond funds can, at times, include an objective of providing greater income versus those cash-like investments, but may carry more risk. Money market funds often invest in higher quality, short-term investments issued by the U.S. government and corporations compared to the increased credit, interest rate and default risks that investors may be exposed to when holding bonds that have relative higher duration (interest rate risk) and lower credit quality. Short-term bond funds have exposure both to interest rate and credit risk. They invest primarily in sectors such as U.S. Treasuries, corporate bonds, securitized credit and municipal bonds. U.S. Treasuries are bonds backed by the U.S. government but prices may fluctuate based on interest rate changes. Corporate bonds contain both interest rate risk and credit risk, with debt payments reliant on the companies that issue the bonds. Securitized credit poses risks tied to their underlying investments in mortgages or other loans. Municipal bonds contain interest rate risk, credit risk, with debt payments reliant on municipal issuers. Payments and return of bond principal aren’t guaranteed, as markets and valuations can fluctuate. Money market funds are not guaranteed but seek to maintain a stable net asset value of $1 per share.
Bloomberg U.S. Government/Credit 1-3 Years Index is a market-value weighted index that tracks the total return results of fixed-rate, publicly placed, dollar-denominated obligations issued by the U.S. Treasury, U.S. government agencies, quasi-federal corporations, corporate or foreign debt guaranteed by the U.S. government, and U.S. corporate and foreign debentures and secured notes that meet specified maturity, liquidity and quality requirements, with maturities of one to three years.
Bloomberg U.S. Treasury Index includes public obligations of the U.S. Treasury, i.e. U.S. government bonds. Certain Treasury bills are excluded by a maturity constraint. In addition, certain special issues, such as state and local government series bonds (SLGs), as well as U.S. Treasury TIPS, are excluded.
The Bloomberg U.S. Treasury: Long Index measures US dollar-denominated, fixed-rate, nominal debt issued by the U.S. Treasury with 10 years or more to maturity.
The average yield to worst is the lowest yield that can be realized by either calling or putting on one of the available call/put dates, or holding a bond to maturity.
Duration indicates a bond fund’s sensitivity to interest rates. Higher duration indicates more sensitivity. Effective duration is a duration calculation for bonds that takes into account that expected cash flows will fluctuate as interest rates change.
The after-tax (or tax-equivalent) yield of a municipal bond investment is the yield a taxable bond would have to offer to equal the same amount as the tax-exempt bond. Highest tax rate assumes the 3.8% Medicare tax and the top federal marginal tax rate for 2026 of 37%.
The five-year standard deviation measures the variability of returns over the preceding 60-month period. Bloomberg U.S. Aggregate Index represents the U.S. investment-grade fixed-rate bond market. This index is unmanaged, and its results include reinvested dividends and/or distributions but do not reflect the effect of sales charges, commissions, account fees, expenses or U.S. federal income taxes.
This content, developed by Capital Group, home of American Funds, should not be used as a primary basis for investment decisions and is not intended to serve as impartial investment or fiduciary advice.
S&P 500 Index is a market capitalization-weighted index based on the results of approximately 500 widely held common stocks.