Module 4: Supporting client needs through public-private solutions 4.2 Understanding semi-liquidity

This video outlines strategies for managing semi-liquidity, including an overview of the liquidity spectrum, how to gauge client liquidity needs and key liquidity considerations.

6MINVIDEO

[upbeat music]


Wesley Phoa, Solutions portfolio manager at Capital Group


One key aspect of private credit is that it isn’t as liquid as more traditional public fixed income. Even if those private loans are accessed through a semi-liquid interval fund, investors need to be comfortable with the fact that they are restricted in their ability to immediately withdraw funds. That’s because interval funds are vehicles that typically contain less liquid assets which makes them better suited for investors with a long-term investment horizon. This is consistent with Capital Group’s core belief in long-term investing.


In this video, we’ll take a look at how interval funds are structured, and we’ll give you pointers on how to talk to your clients about them. Let’s get started.


[upbeat music]


First and foremost, you’ll need to gauge your clients’ liquidity needs.


You likely have a sense of this already, as understanding those needs is a central part of comprehensive financial planning. Since needs change over time, it’s good practice to periodically check in with clients to understand where they currently stand.


You’ll want to know when they’ll need funds, how much they’ll spend, and at what rate, and their overall capacity for risk. Let’s dig a little deeper on that last point. How big a liquidity risk does any given investment within a portfolio represent?


As you can see on the chart, we believe there are three key liquidity considerations: the size of an asset’s position, how quickly it might need to be sold and the markdown incurred in the event of a sale. The question isn’t whether an asset can be liquidated, because in most situations it can, albeit at a cost. 


The primary challenge is how to liquidate assets while minimizing costs and maintaining an acceptable level of portfolio risk. We believe it’s all about finding the right balance between these trade-offs.


Liquidity plays a critical role in portfolio construction by offering flexibility and risk management. The more liquid an asset, the more easily it can be sold if needed, or converted into other assets.


It's important to have a framework that aligns an investment’s liquidity to your client’s broader portfolio risk and return objective and their investment horizon.


In this waterfall chart, you will see a liquidity spectrum at an asset and vehicle level. Cash and cash equivalents are most liquid, with publicly traded assets next. We believe active management should be done with a long-term perspective; therefore, it’s our view that investors should liquidate passive before active. If you liquidate active first, you can lose the benefit of the investment strategies and active management. The remaining categories are semi-liquid, which include interval funds, and finally highly illiquid assets.


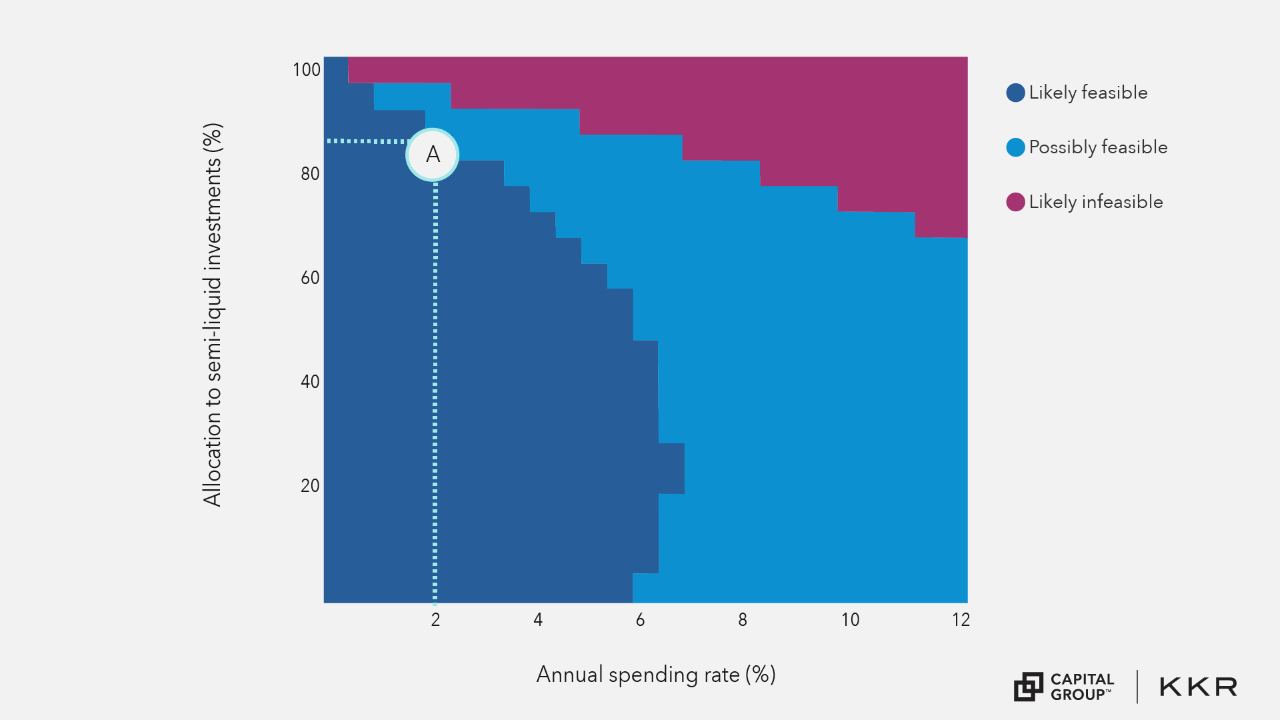
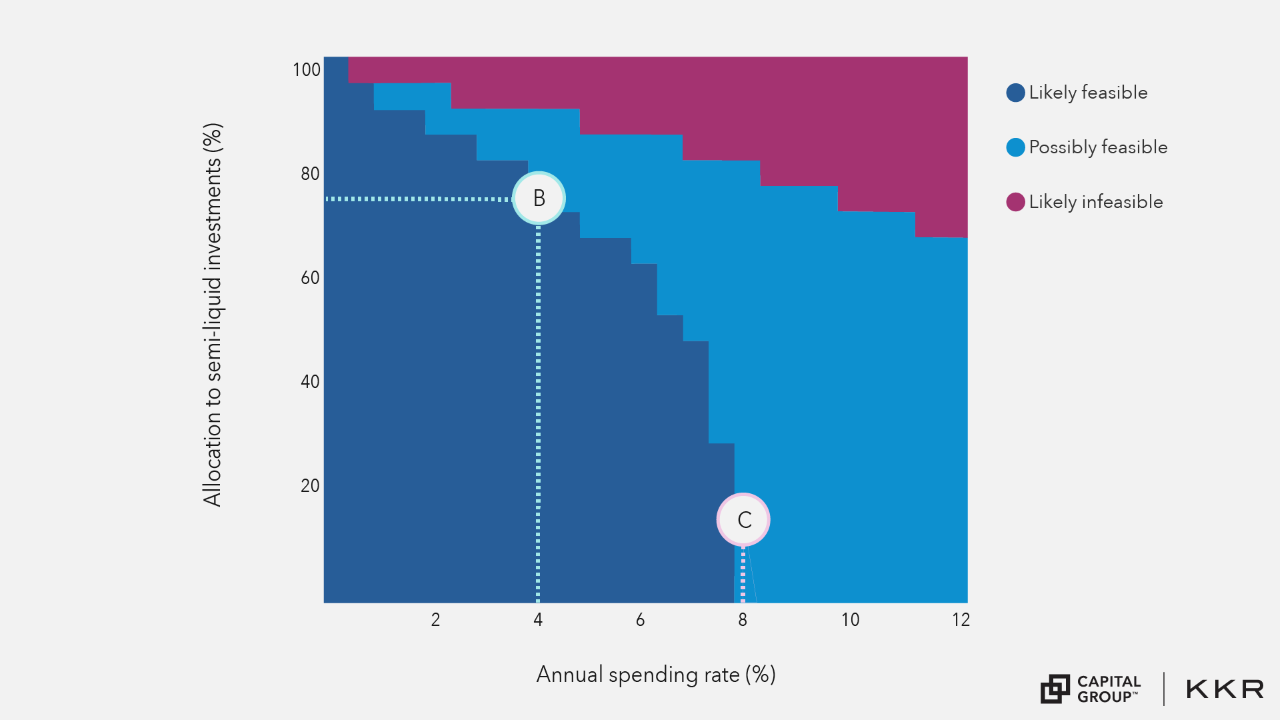
What’s the right proportion of less liquid assets in a portfolio? You’ll need to consider your client’s capacity for risk, time horizon and cash flow needs. If they have multiple short-term commitments, semi-liquid investments like interval funds, might not be for them. Keep in mind the inverse relationship between your client's annual spending rate and the allocation to semi-liquid assets.


Investors with a longer time horizon are typically in the accumulation phase, likely making them a more suitable for a higher proportion of semi-liquid investments within their portfolio. Conversely, those needing cash in the near term are in the distribution phase and may require more liquid assets. Additionally, liquidating portions of a portfolio can disrupt its overall balance. Therefore, we believe it is essential to consider rebalancing the overall portfolio to maintain its intended asset allocation when sourcing liquidity.


[upbeat music]


Your clients will likely have legitimate concerns about the trade-offs that come with semi-liquid investments. First, make sure your clients understand that the semi-liquidity conversation is about both the vehicle type and the assets it holds. Capital Group’s public-private funds combine traditional public assets, such as fixed income, and private credit in interval funds, a less liquid vehicle than mutual funds or ETFs.


You can think of the interval funds as a liquidity compromise: one that allows clients access to typically more liquid assets but with a restricted ability to manage their redemptions compared to traditional mutual funds or ETFs.


Next, you should gauge their liquidity needs, as we discussed earlier in this video. Doing so will help identify those clients who can tolerate a less liquid investment in exchange for potentially higher returns and diversified risk exposures.


As we know, when working with investments with limited liquidity like those found in interval funds, reminding investors of the long-term nature of these assets is important. Realizing the value of these investments, and the potential positive impact on their long-term financial plan, requires holding these investments through a full market cycle.


Riding out market turbulence can often produce better long-term results and interval funds have that “hold tight” mentality already baked into them. Many investors already have a “buy and hold” mindset. If yours do as well, it may be worth noting how these funds complement that idea of being in it for the long haul.


That concludes this video on portfolio considerations for allocating to semi-liquid interval funds. As a next step, you may want to think about who among your investors might be a fit for investing in less liquid products. Until next time.


[upbeat music]


Deepen your understanding

Select each resource below to learn more.


The graphs below compare private credit’s annualized yield to those of core bonds and high-yield bonds. By deconstructing the components of each asset class’s yields, we can estimate the secured direct lending and illiquidity premium.


Since private credit is not traded daily on public markets, it’s less liquid than public credit. Due to this decreased liquidity, as well as the credit spread, private credit tends to offer higher yields than comparable public assets.


The graphs below compare private credit’s annualized yield to those of core bonds and high-yield bonds. By deconstructing the components of each asset class’s yields, we can estimate the credit spread and illiquidity premium.


Hover over each bar below to view precise estimates for the components of each yield figure.


For illustrative purposes only.

Liquidity is a key consideration when designing a client’s portfolio. How quickly will the client need access to cash and how much? For illiquid and semi-liquid investments, such as interval funds, knowing the answers to these questions may help avoid cash shortfalls or a bad experience when seeking to liquidate investments.


Semi-liquid allocation vs. spending


We believe that maintaining a public portfolio balance that offers inflation of at least three times the investor’s projected annual spending requirements is a prudent criterion for portfolio liquidity management. Starting from this baseline, the examples that follow show how feasible different levels of allocation to semi-liquid investments to the same extent (if at all) might be for an investor, based on their annual spending rate.


Each of the examples includes a chart of semi-liquid allocation (a semi-liquid investment is an asset that can be converted into cash more easily than illiquid investments but not as quickly as liquid investments) vs. annual spending rate, based on our simulation framework. (See the footnote for the assumptions behind these charts.)


Here’s how to interpret the charts:


  • The dark blue area of each chart represents combinations of semi-liquid allocations and annual spending rates that are most likely feasible for investors — in our analysis, the success criterion is satisfied by at least 95% of our simulations. The lower an investor’s spending rate and therefore the lower their liquidity need, the more they may feasibly invest in semi-liquid funds. It is less likely that they will frequently need access to the money invested in the semi-liquid funds.
  • The light blue area represents combinations of semi-liquid allocation and annual spending that are likely infeasible — that is, the success criterion is satisfied by less than 25% of our simulations. An investor with a higher spending rate should not consider allocating to semi-liquid investments to the same extent (if at all) as an investor with lower spending. The higher-spending investor will need more of their money on demand and semi-liquid investments make it more difficult to access that money.
  • The magenta area represents combinations between the extremes that we consider only possibly feasible. As the spending rate rises, even a low allocation to semi-liquid assets becomes markedly less feasible.


These charts are only a starting point for the upper bound of allocations to semi-liquid investments, not a definitive tool for every individual investor. Every investor is unique and will have personal investment preferences and constraints to consider before investing in semi-liquid assets.


Example: Equities-heavy portfolio, 2% spending rate

A man with dark hair and a light blazer leans forward in his chair.

Walter is in the middle of his career, with steady income and the following investment profile:


  • Walter expects to spend 2% of his initial portfolio balance each year.
  • He currently holds 80% global equities, 15% U.S. bonds and 5% in semi-liquid private credit.


Here is a chart describing the feasibility of various levels of semi-liquid private credit investment for Walter based on his specific portfolio allocations, according to our analysis:


A graph of Walter’s annual sending rate and allocation to semi-liquid investments, color-coded by the feasibility of combinations. At low spending rates (2 to 5 percent), Walter has higher likely feasible allocations to semi-liquid assets. Allocations to semi-liquid all become less likely feasible past 6 percent spending, and likely infeasible at higher rates of both allocation and spending. The point at 2% spending and 85% allocation is labeled Point A.

For illustrative purposes only.

In our analysis, Walter could allocate up to 85% of his portfolio to semi-liquid private credit investments (Point A) while still reasonably expecting to accommodate his 2% spending rate. This is significantly higher than his current allotment of 5% to semi-liquid private credit. Exactly how much Walter should allocate will be up to other strategic considerations, but he may have a lot of room to grow that proportion.


If Walter’s spending expectation increased beyond 2%, this potentially feasible proportion would be lower. At 4% spending, for example, his maximum likely feasible semi-liquid private credit allotment would be around 70%. At 8%, any semi-liquid private credit investment would become less feasible.


Let’s look at another hypothetical example.


Example: Approaching retirement, 4% spending rate

A woman with grey hair and a grey shirt smiles toward the camera as she leans on her desk. Her laptop is open in front of her.

Joan is approaching retirement. More of her portfolio is in fixed income and she’s looking to generate income from her portfolio while still maintaining some growth potential. Here’s her investment profile:


  • Joan anticipates spending 4% of her initial portfolio balance each year.
  • She currently holds 50% in global equities, 35% in U.S. bonds and 15% in semi-liquid private credit.


Here is a chart describing the feasibility of various levels of semi-liquid private credit investment for Joan, according to our analysis:


A graph of Joan’s annual sending rate and allocation to semi-liquid investments, color-coded by the feasibility of combinations. At low spending rates (2 to 5 percent), Joan has higher likely feasible allocations to semi-liquid assets. Allocations to semi-liquid all become less likely feasible past 8 percent spending, and likely infeasible at higher rates of both allocation and spending. The point at 4% spending and 75% allocation is labeled Point B. The point at 8% spending at 15% allocation is labeled Point C.

For illustrative purposes only.

In our analysis, Joan could allocate up to 75% of her portfolio to semi-liquid private credit investments (Point B) while still reasonably expecting to accommodate her 4% spending rate. This is significantly higher than her current allotment of 15% to semi-liquid private credit. There’s potential to grow the semi-liquid, private credit allotment, if she’s interested and it would accord with her overall strategy.


If Joan’s spending expectation increased beyond 4%, her potential feasible proportion of semi-liquid assets would be lower. If her spending rose to 8%, for example, even her current allocation rate of 15% would be less feasible (Point C).


Observations


For each investor, raising their anticipated spending rate significantly reduces their feasible allotment to semi-liquid private credit. In both scenarios provided, semi-liquid allotment becomes less feasible at around a 6–8% annual spending rate. When planning around liquidity with your clients, it is critical to have a realistic estimate of their future spending rates.


Keeping all potential risks in mind, incorporating private credit into portfolios may deliver potential benefits — from enhanced yields to improved diversification. However, the success of such a strategy hinges on a tailored approach that considers your client’s liquidity needs, capacity for risk and long-term objectives.


Footnotes/Important information


The assumptions behind these visuals are as follows:


  • Public asset classes are categorized as liquid and private asset classes as semi-liquid.
  • An interval fund’s repurchase offer, made on a quarterly basis, is 5% to 10% of the fund’s outstanding shares.
  • Public assets form a “public portfolio” of a client account that is rebalanced to target weights on a quarterly basis.
  • Private assets form a “private portfolio” of a client account that is rebalanced to target weights on an annual basis.
  • The portfolio target weights are determined for a 60-month time horizon.
  • The spending amount is the spending rate as a percentage of the initial portfolio balance.
  • We simulated 5,000 paths using historical asset class quarterly returns from 3/31/2004 – 3/31/2024.
  • The success rate is measured as the public portfolio balance being greater than or equal to three times the annual spending rate over the simulated time horizon.

For financial professionals only. Not for use with the public.

Investments are not FDIC-insured, nor are they deposits of or guaranteed by a bank or any other entity, so they may lose value.
Investors should carefully consider investment objectives, risks, charges and expenses. This and other important information is contained in the interval fund prospectuses, which can be obtained from a financial professional and should be read carefully before investing.
For Public-Private+ Funds: Capital Group KKR Core Plus+ and Capital Group KKR Multi-Sector+ are interval funds that currently provides liquidity to shareholders through quarterly repurchase offers of up to 10% of its outstanding shares. Capital Group KKR U.S. Equity+ is an interval fund that currently provides liquidity to shareholders through quarterly repurchase offers of 5% of its outstanding shares. To the extent a higher percent of outstanding shares are tendered for repurchase, the redemption proceeds are generally distributed proportionately to redeeming investors (“proration”). Due to this repurchase limit, shareholders may be unable to liquidate all or a portion of their investment during a particular repurchase offer window. In addition, anticipating proration, some shareholders may request more shares to be repurchased than they actually wish, increasing the likelihood of proration. Shares are not listed on any stock exchange, and we do not expect a secondary market in the shares to develop. Due to these restrictions, investors should consider their investment in the fund to be subject to illiquidity risk.

- Investment strategies are not guaranteed to meet their objectives and are subject to loss. Investing in the fund is not suitable for all investors. Investors should consult their investment professional before making an investment decision and evaluate their ability to invest for the long term. Because of the nature of the fund's investments, the results of the fund's operations may be volatile. Accordingly, investors should understand that past performance is not indicative of future results.

- Investing outside the United States involves risks, such as currency fluctuations, periods of illiquidity and price volatility. These risks may be heightened in connection with investments in developing countries.

- Illiquid assets are more difficult to sell and may become impossible to sell in volatile market conditions. Reduced liquidity may have an adverse impact on the market price of such holdings, and the fund may be unable to sell such holdings when necessary to meet its liquidity needs or to try to limit losses, or may be forced to sell at a loss. Illiquid assets are also generally difficult to value because they rarely have readily available market quotations. Such securities require fair value pricing, which is based on subjective judgments and may differ materially from the value that would be realized if the security were to be sold. Situations involving uncertainties as to valuation of assets held by the fund could have an adverse effect on the returns of the fund.

- The fund is a non-diversified fund that has the ability to invest a larger percentage of assets in the securities of a smaller number of issuers than a diversified fund. As a result, poor results by a single issuer could adversely affect fund results more than if the fund were invested in a larger number of issuers.


For Public-Private Credit+ Funds:

- Bond investments may be worth more or less than the original cost when redeemed. High‐yield, lower‐rated, securities involve greater risk than higher‐rated securities; portfolios that invest in them may be subject to greater levels of credit and liquidity risk than portfolios that do not.

- The funds may invest in structured products, which generally entail risks associated with derivative instruments and bear risks of the underlying investments, index or reference obligation. These securities include asset-based finance securities, mortgage-related assets and other asset-backed instruments, which may be sensitive to changes in interest rates, subject to early repayment risk, and their value may fluctuate in response to the market's perception of issuer creditworthiness; while generally supported by some form of government or private guarantee, there is no assurance that private guarantors will meet their obligations.

- While not directly correlated to changes in interest rates, the values of inflation-linked bonds generally fluctuate in response to changes in real interest rates and may experience greater losses than other debt securities with similar durations. The use of derivatives involves a variety of risks, which may be different from, or greater than, the risks associated with investing in traditional securities, such as stocks and bonds.

- The fund invests in private, illiquid credit securities, consisting primarily of loans and asset-backed finance securities. The fund may invest in or originate senior loans, which hold the most senior position in a business's capital structure. Some senior loans lack an active trading market and are subject to resale restrictions, leading to potential illiquidity. The fund may need to sell other investments or borrow to meet obligations. The funds may also invest in mezzanine debt, which is generally unsecured and subordinated, carrying higher credit and liquidity risk than investment-grade corporate obligations. Default rates for mezzanine debt have historically been higher than for investment-grade securities. Bank loans are often less liquid than other types of debt instruments and general market and financial conditions may affect the prepayment of bank loans, as such the prepayments cannot be predicted with accuracy.


For Public-Private Equity+ Funds:

- The fund also intends to concentrate in the financial services group of industries, and to invest at least 80% of its assets in securities issued by companies based in the United States.

- K-PEC and co-investment risks: The fund's investments in KKR Private Equity Conglomerate LLC (“K-PEC”) and co-investments alongside K-PEC or one or more other KKR vehicles that pursue private equity strategies entail additional risks. Private equity investments are typically illiquid, speculative, and difficult to value, often requiring multi-year holding periods with returns generally realized only upon sale or refinancing of a portfolio company. These investments depend on access to financing, and market disruptions or increased competition may limit opportunities and affect performance. The fund's significant investment in K-PEC creates concentration risk and a decline in K-PEC's value could materially impact the fund's returns. Co‑investment opportunities are competitive and limited and there is no assurance the fund will receive allocations or comparable terms and will generally have less information than for public companies. Through its investments in K-PEC or other KKR Vehicles and co-investments, the fund may have exposure to portfolio companies with limited operating histories, evolving markets, unproven technologies, and inexperienced management, which may require significant capital and create heightened vulnerability to downturns. Most holdings are illiquid, subject to resale restrictions and may require consents or be sold at a discount. Costs associated with investments in private equity are generally greater than those of investments in other asset classes. In addition to bearing their portion of the fund's fees and expenses, shareholders in the fund will indirectly bear a portion of the asset-based fees, incentive fees and other expenses incurred by the fund as an investor in K-PEC or other KKR Vehicles and in co-investments. Incentive fees are paid to KKR when the fund's investments in K-PEC or other KKR Vehicles and/or co-investments deliver returns in excess of a specified hurdle; when paid, these fees reduce the net realized returns of such investments.

This material does not constitute legal or tax advice. Investors should consult with their legal or tax advisors.
Statements attributed to an individual represent the opinions of that individual as of the date published and do not necessarily reflect the opinions of Capital Group or its affiliates. This information is intended to highlight issues and should not be considered advice, an endorsement or a recommendation.
Capital Group and Kohlberg Kravis Roberts & Co. L.P. (“KKR”) are not affiliated. The two firms maintain an exclusive partnership to deliver public-private investment solutions to investors. KKR serves as the sub-adviser of Capital Group KKR Core Plus+ and Capital Group KKR Multi-Sector+ with respect to the management of each fund's private credit assets. KKR is not a sponsor, promoter, investment adviser, sub-adviser, underwriter or affiliate of Capital Group KKR U.S. Equity+.
All Capital Group trademarks mentioned are owned by The Capital Group Companies, Inc., an affiliated company or fund. All other company and product names mentioned are the property of their respective companies.
Use of this website is intended for U.S. residents only. Use of this website and materials is also subject to approval by your home office.
Capital Client Group, Inc.
This content, developed by Capital Group, home of American Funds, should not be used as a primary basis for investment decisions and is not intended to serve as impartial investment or fiduciary advice.