
Passive exposure to U.S. equity
48%
of average advisor portfolio
PORTFOLIO PERSPECTIVES
Get the latest insights and research shaping our approach to asset allocation
ADVISOR INSIGHTS
Many advisor portfolios are highly concentrated in passive equity, which can result in unintended risk and missed opportunities to add value through active management.
48%
of average advisor portfolio
29%
of average advisor portfolio
TAKEAWAY
Advisor exposure to heavily concentrated passive U.S. indexes may present portfolio risks.
TAKEAWAY
Advisors have continued to tiptoe into non-U.S. equity over the past year, but may be missing opportunities to add value from active management.
Source: Portfolio Consulting and Analytics team. The 48% statistic for passive U.S. equity allocations reflects the team's analysis of U.S. equity allocations in 2,560 portfolios from 1/1/26-6/30/26, including active and passive U.S. equity ETFs and open-ended mutual funds. The 29% statistic for passive non-U.S. equity allocations reflects the team's analysis of non-U.S. equity allocations in 2,380 portfolios for the same period, including active and passive ETFs and mutual funds.
ANALYTICS TOOLS & CONSULTING
Analyze potential portfolio risks amid elevated levels of market concentration
ASSESS YOUR PORTFOLIO VS. PEERS
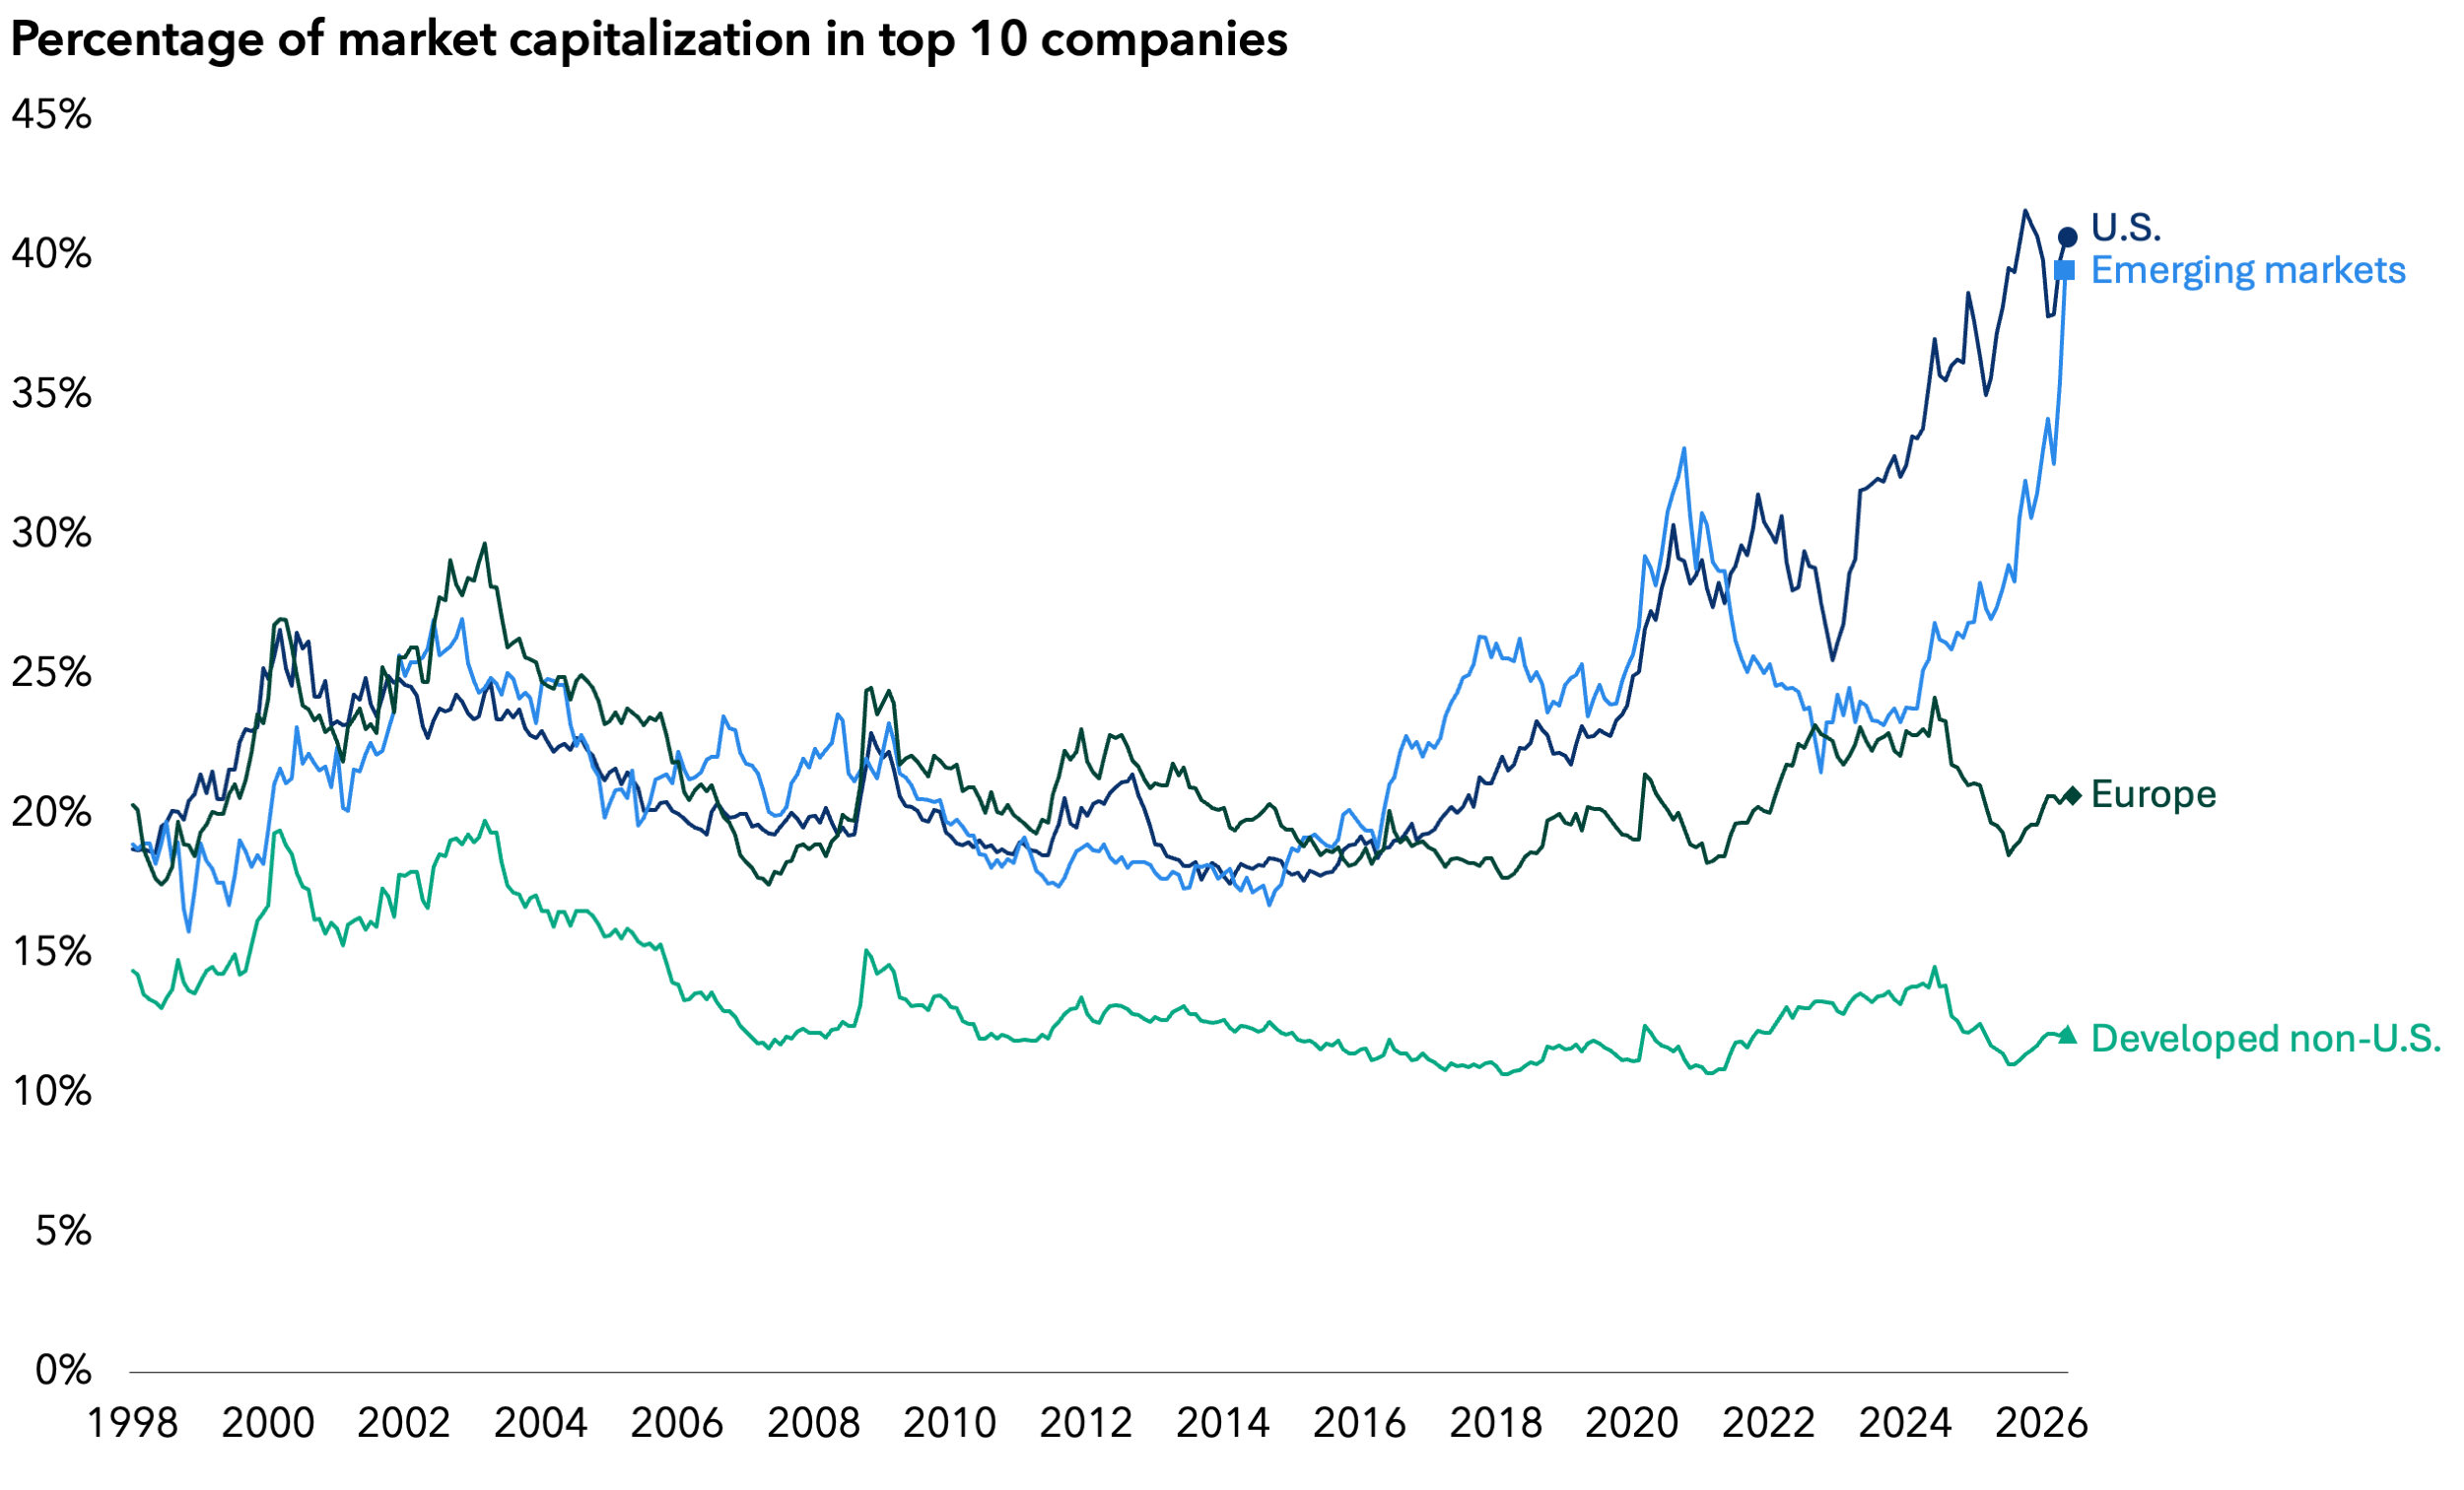
The market indexes are unmanaged and, therefore, have no expenses. Investors cannot invest directly in an index.
Sources: Capital Group, FactSet, MSCI, S&P Global. Figures represent the index concentration of the top 10 companies by market capitalization across the S&P 500 Index (U.S.), the MSCI Europe Index (Europe), the MSCI World ex USA Index (Developed non-U.S.) and the MSCI EM Index (Emerging markets). Data shown is monthly, from January 30, 1998, through May 31, 2026.

Why rising market concentration in the age of Al strengthens the case for active management.
Explore real-world examples of changes advisors made to their portfolios after meeting with our team
Portfolio makeover: Using active ETFs to reduce risk, save advisors time
3 reasons to rethink global equity
Capital Group's Portfolio Consulting and Analytics team meets with thousands of advisors a year. Our consultants can partner with you to analyze risks and opportunities in your portfolios.
Source: Capital Group. Portfolio Consulting and Analytics team data as of December 31, 2025.
MODEL PORTFOLIOS
We offer a range of models to meet client needs, including active ETFs, active-passive and tax-aware models.

Smaller company stocks entail additional risks, and they can fluctuate in price more than larger company stocks. The return of principal for bond funds and for funds with significant underlying bond holdings is not guaranteed. Fund shares are subject to the same interest rate, inflation and credit risks associated with the underlying bond holdings. Lower rated bonds are subject to greater fluctuations in value and risk of loss of income and principal than higher rated bonds. Investments in mortgage-related securities involve additional risks, such as prepayment risk. The use of derivatives involves a variety of risks, which may be different from, or greater than, the risks associated with investing in traditional securities, such as stocks and bonds. Income from municipal bonds may be subject to state or local income taxes and/or the federal alternative minimum tax. Certain other income, as well as capital gain distributions, may be taxable.
S&P 500 Index is a market capitalization-weighted index based on the results of approximately 500 widely held common stocks.
MSCI Europe Index is designed to measure developed equity market results across 15 developed countries in Europe.
MSCI World ex USA Index is designed to measure equity market results of developed markets. The index consists of more than 20 developed market country indexes, excluding the United States.
MSCI Emerging Markets Index captures large- and mid-cap representation across 27 emerging markets (EM) countries.
The MSCI information may only be used for your internal use, may not be reproduced or redisseminated in any form and may not be used as a basis for or a component of any financial instruments or products or indices. None of the MSCI information is intended to constitute investment advice or a recommendation to make (or refrain from making) any kind of investment decision and may not be relied on as such. Historical data and analysis should not be taken as an indication or guarantee of any future performance analysis, forecast or prediction. The MSCI information is provided on an "as is" basis and the user of this information assumes the entire risk of any use made of this information. MSCI, each of its affiliates and each other person involved in or related to compiling, computing or creating any MSCI information (collectively, the "MSCI Parties") expressly disclaims all warranties (including, without limitation, any warranties of originality, accuracy, completeness, timeliness, non-infringement, merchantability and fitness for a particular purpose with respect to this information. Without limiting any of the foregoing, in no event shall any MSCI Party have any liability for any direct, indirect, special, incidental, punitive, consequential (including, without limitation, lost profits) or any other damages (www.msci.com).
The S&P 500 Indexes are a product of S&P Dow Jones Indices LLC and/or its affiliates and have been licensed for use by Capital Group. Copyright © 2026 S&P Dow Jones Indices LLC, a division of S&P Global, and/or its affiliates. All rights reserved. Redistribution or reproduction in whole or in part is prohibited without written permission of S&P Dow Jones Indices LLC.