
In the centuries-old riverside town of West Newbury, Massachusetts, advisor Holly Colvin at Helm Financial Planning serves a wide range of clients with different backgrounds and needs. “Many of my clients are young and need more growth in their portfolios,” says Colvin. “At the same time, other clients have reached a stage in life when they need to draw on their assets.”
Published onDecember 26, 2023
6 MIN ARTICLE
Recently, Colvin identified a common theme in many of her client portfolios: a lack of global diversification following significant market shifts over the last few years. She reached out to Capital Group’s Portfolio Consulting and Analytics team to discuss options for international equity exposure. The team suggested a more flexible global equity model that could be easily customized to different clients. (International equity includes developed non-U.S. equity and emerging markets, whereas global also includes U.S.)
“I wanted a fresh point of view from professionals whose perspective I could trust,” Colvin says. A certified financial analyst and former municipal bonds trader, Colvin worked at Capital Group before becoming a financial advisor more than 20 years ago. She consulted with the team in the past and valued their suggestions. In the three years since they last met, her business had nearly tripled, and she felt that some of her models had morphed with the market.
Here are three insights that helped Colvin rethink her global equity allocations, which may help you rethink yours too:
1. International equity exposure may reduce concentration risk
It may not be surprising that some advisors have avoided international equity over the last decade, with the S&P 500 Index returning 11.91% for the last 10 years ended September 30, 2023, versus 3.35% for the MSCI All Country World Index ex US (ACWI ex US). “We see a lot of scenarios where advisors are underallocated to international equity,” says portfolio consultant Chris Lanctot. “What may be surprising,” he adds, “is the potential for international equity right now, especially given a heavily concentrated U.S. equity market.” In fact, international equities are far less concentrated than the U.S. equities market, where the top 10 stocks made up nearly a third of the S&P 500 Index as of September 30, 2023 — as much as during the height of the dot-com bubble. “A broader international landscape offers the potential for less concentration risk than domestic markets,” says Lanctot.
International equities are far less concentrated than the S&P 500
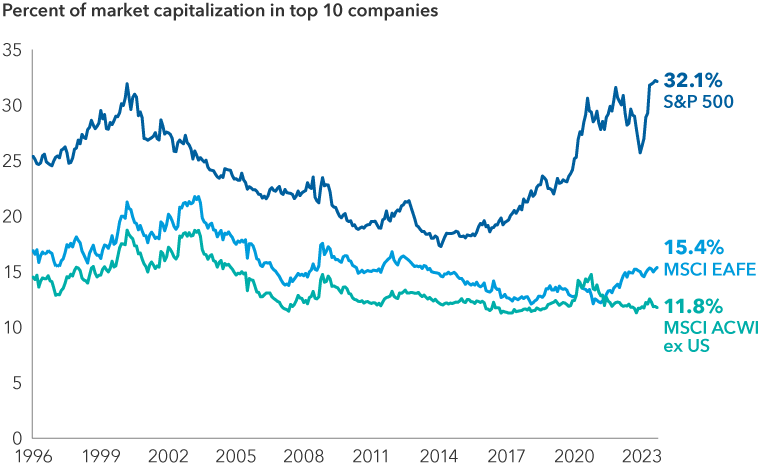
Source: Capital Group, Morningstar. As of 9/30/23. Past results are not predictive of results in future periods.
2. Company revenue is as important as domicile
“I was most interested in the analysis of where company revenues come from rather than where companies are domiciled,” says Colvin. “That’s a fantastic way to approach global diversification, rather than only focusing on where companies are based. It’s a more targeted approach to global diversification to think about how good a company is at accessing consumers in every part of the world,” she says.
Average advisor regional allocations by revenue versus domicile
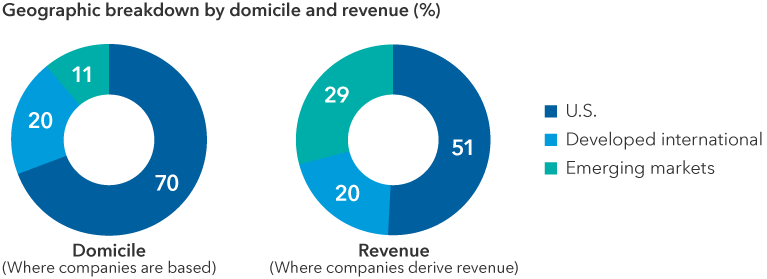
Sources: Capital Group, FactSet, and Morningstar. Totals may not reconcile due to rounding. The average advisor portfolio is representative of the aggregate exposures of 1,188 advisor portfolios analyzed by Capital Group’s Portfolio Consulting and Analytics team from 7/1/23 to 9/30/23.
By domicile (where companies are based), advisor equity exposure averaged about 70% U.S. and 30% non-U.S. equities (20% in developed international and more than 10% in emerging markets). When analyzing the underlying holdings based on where companies derived revenues, the total non-U.S. exposure increased to almost 50%. “We find revenue exposure to be a compelling way to deconstruct risk and diversification, while positioning the benefits of research-driven global flexibility,” Lanctot says.
3. Global flexibility can help as markets shift
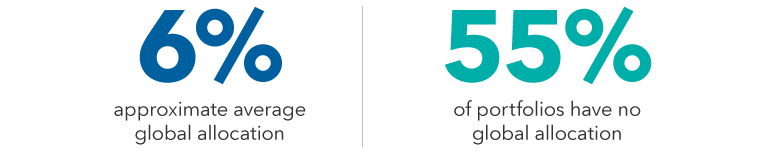
“Most advisors do not have global flexibility in their client portfolios,” says Lanctot. In fact, the average advisor portfolio has only a 6% global average allocation. Fifty-five percent of advisors have no global allocation at all, according to our research.* Meanwhile, institutional allocators for defined benefit plans steadily increased exposure to global equity mandates from 5% in 2010 to 17% in 2021. “Over the years, average advisor exposure to global equity hasn’t kept pace with increased global allocations to defined benefit plans,” says Mark Barile, manager of the Capital Group Portfolio Consulting and Analytics team. “Now may be the time for advisors to rethink that and stay ahead of the curve, especially given that advisors tend to follow institutional trends like this over time,” says Barile.
“We encourage advisors to make their portfolios more dynamic via global exposure,” says Lanctot. “Many advisors are using regional exchange-traded funds (ETFs) to access global exposures. But using active global ETFs instead can be a good way to take advantage of opportunities around the globe in real time, based on direct investment research,” Lanctot says. Ultimately, Colvin decided on a global model that includes Capital Group ETFs with flexible global allocations.
Advisors may be underallocated to global strategies
Could advisors follow rising global allocations in defined benefit plans?
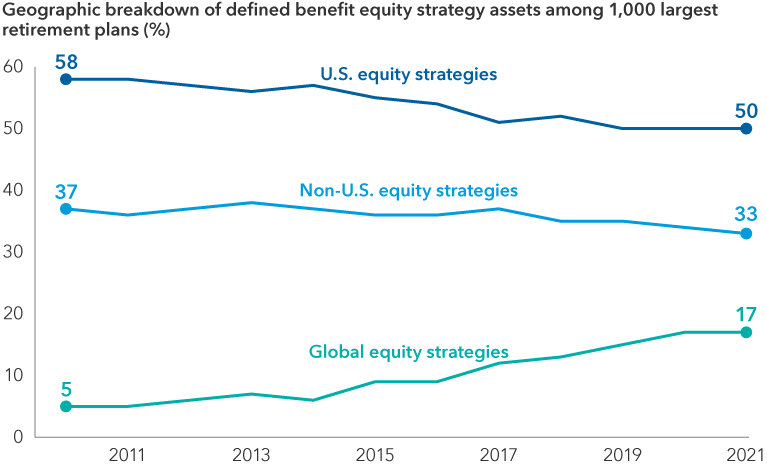
Sources: First chart: Capital Group. Second chart: Pensions & Investment Research Center (as of 12/31/21).
“International equity research is a major strength at Capital Group, from my point of view,” says Colvin. “We looked at a range of vehicles for the global model. I liked the flexibility of the global and international ETFs and how they were able to access company opportunities across emerging and developed markets.” While she likes to dig into the details of portfolio construction and conduct her own analysis, she says she appreciates having access to the team’s sophisticated tools and software used to discuss different success metrics.
To Colvin, it was also important that the team took an unbiased look at the characteristics of different vehicles from many different firms in the industry and was able to point out the pros and cons of different investment options relative to her client portfolio goals. “They respected all the portfolio design and research I had done. The team also recognized that many of my client portfolios are tax-sensitive, and kept the analysis focused on my preferred investment vehicle of ETFs,” says Colvin.
“I got the second opinion I was looking for to think through a global model that could be adapted for different clients,” she says.
Looking for another perspective on global allocations?
Get an unbiased point of view on portfolios and talk through solutions with trusted partners. Connect to your Capital Group representative or sign up for an in-depth portfolio analysis and review today.

Mark Barile is a Senior Manager, Portfolio Consulting and Analytics with 20 years of industry experience as of 12/31/2025. He holds a bachelor's degree in studio art from Trinity University. He also holds the Certified Investment Management Analyst® designation.

Chris Lanctot is a portfolio consultant at Capital Group, home of American Funds. He has 10 years of industry experience, all with Capital Group. Earlier in his career at Capital, he was an advisory specialist. He holds a bachelor's degree in financial management from Hillsdale College. He also holds the Certified Investment Management Analyst® designation. Chris is based in Indianapolis.

Holly Colvin is a financial advisor with 30 years of experience in finance. She began her career at Capital Group in their bond department, and currently runs Helm Financial Planning based in West Newbury, Massachusetts, which specializes in wealth management for individuals and families. Holly Colvin earned a BS and BA from Boston University in 1991 and holds both the CFA and CFP designations.