
How are financial advisors allocating client portfolios in today’s uncertain environment? Our Portfolio Consulting and Analytics team meets with thousands of advisors every year to discuss portfolio challenges and recommend allocation changes based on client goals. We’ve identified the most common issues found in client portfolios and how we’ve worked with advisors to help reduce risks.
Published onDecember 15, 2023
6 MIN ARTICLE
1. Market concentration has left investors under-diversified
Some advisors we work with are surprised to learn that today’s market concentration among top stocks in the S&P 500 Index is as high as it was during the dot-com bubble. (Often referred to as the Magnificent 7, this group includes mega-caps such as Amazon and Apple.) For comparison, exposure to information technology and communication services made up 25% of the S&P 500 Index at the peak of the tech bubble in March 2000. Currently, those sectors occupy 36% of the index’s total market capitalization. What’s more, the top five largest companies in the S&P 500 represented 24% of the index, as of September 30, 2023, but only 14% of recurring earnings (the amount of a company’s earnings expected to continue).
Meanwhile, key bond indices fell sharply in 2022 and mostly posted negative three-year average annual returns as of September 30, 2023. High yield, as measured by the Bloomberg U.S. Corporate High Yield 2% Issuer Capped Index, proved to be the main exception, with three-year average annual returns, as of September 30, 2023, at 1.75%. In general, many advisor portfolios appear to be unbalanced in this environment, with too much equity concentration risk and not enough fixed income diversification. Our analysis of advisor portfolios has shown that correlations between the fixed income sleeve of the average advisor portfolio versus the S&P 500 have climbed overall, with the three-year correlation jumping from 0.43 at the beginning of 2021 to 0.68 as of September 30, 2023.
Our takeaway: Bonds are one way to balance out heavy equity concentration. “We encourage advisors to think about the longer term role that fixed income can play in a balanced portfolio to provide a measure of protection against potential downside moves in equities,” says Mark Barile, manager of the Portfolio Consulting and Analytics team. This includes discussions about rolling correlations, scenario analysis and credit/curve positioning, among other factors, to assess fixed income allocations. Credit analysis is based on credit quality (whether bond holdings are BB/Ba-rated or below), curve positioning refers to duration (sensitivity to interest rates) and scenario analysis refers to how portfolios have held up during market corrections of 10% or more. “Advisors who have the discipline to stay diversified through these market conditions and use fixed income both as a ballast and to generate income are likely to benefit going forward,” adds Barile.
Market concentration now as high as during the dot-com bubble
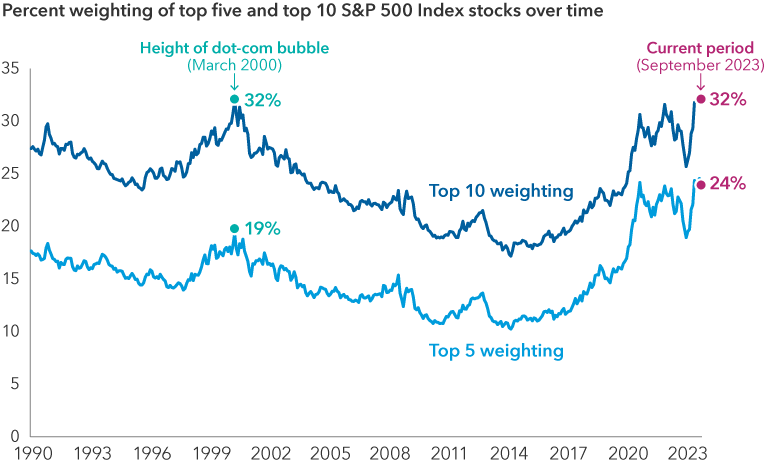
Source: Factset, September 30, 2023.
2. Portfolios hold more high yield than advisors realize
“Advisors are usually surprised by the amount of high yield, lower rated bonds in their portfolios,” says senior portfolio consultant Casey Dregits. They are also surprised, at times, by the risk these holdings can add. As of September 30, 2023, we found that the average advisor had a 17% allocation to high yield (or lower rated) investments versus 14% for the American Funds Moderate Growth and Income model (which typically aligns with a 60% equity/40% bond portfolio). In general, high yield, lower rated bonds usually have a lower sensitivity to interest rates and tend to fare better than other fixed income asset classes in a rising rate environment and in the face of higher inflation. Duration (interest rate sensitivity) in the average advisor portfolio was 4.55 years versus 6.28 years for the model, as of September 30, 2023.
More high yield than the model
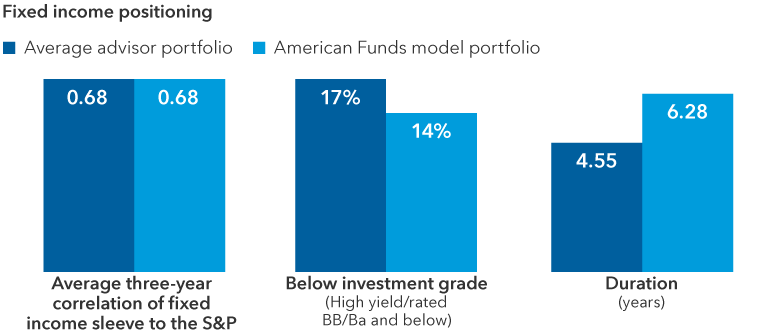
Source: Capital Group, FactSet, and Morningstar as of September 30, 2023. The American Funds model portfolio represents the most recent available data, as of September 30, 2023, for the American Funds Moderate Growth and Income Model Portfolio. Average three-year correlation of the fixed income sleeve for each portfolio is relative to the S&P 500. Below investment grade/high yield refers to companies with a debt rating of BB/Ba and below or whose debt is not rated by agencies.
Our takeaway: Balancing core bond allocations with flexible exposure to higher yielding sectors can be useful in growth and income and income-oriented portfolios, according to Samir Mathur, chairman of Capital Group’s Portfolio Solutions Committee, which oversees model portfolios. “We recommend taking a flexible approach to high yield and duration rather than trying to make a call on interest rates,” adds Dregits. “Our team can make suggestions to advisors on where to focus core allocations in portfolios and how not to go to extreme ends in order to mitigate volatility,” Dregits says.
3. Portfolios have limited international diversification
Some advisors shy away from international stocks, especially given that non-U.S. equities lagged U.S. stocks over the last decade. For the 10-year period ending September 30, average annual returns for the S&P 500 Index were 11.91% versus 3.35% for the MSCI All Country World Index ex US (ACWI ex US). Many advisors who do invest internationally tend to favor emerging markets. For example, as of September 30, the average advisor portfolio allocated 11% to emerging markets versus 7% for the American Funds Moderate Growth and Income model. But the average advisor had a 20% exposure to developed international equity versus 25% for the model. This year, non-U.S. allocations in many of our model portfolios have increased further via shifts in underlying funds, according to Mathur. This includes increased non-U.S. allocations in the American Funds Moderate Growth and Income Model Portfolio in the 12 months ended September 30, 2023.
Equity allocations by domicile and revenue
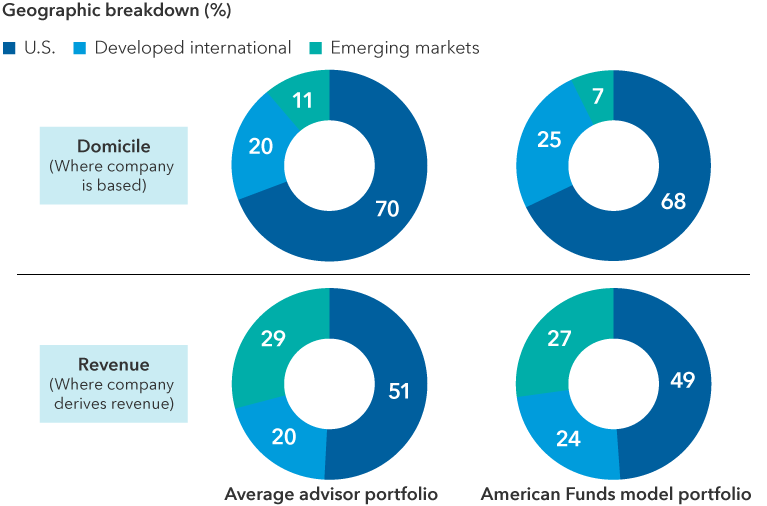
Sources: Capital Group, FactSet, and Morningstar as of September 30, 2023. The American Funds model portfolio represents the most recent available data, as of September 30, 2023, for the American Funds Moderate Growth and Income Model Portfolio. Totals may not reconcile due to rounding.
Our takeaway: Selecting strategies with an international focus can help provide non-U.S. diversification. “Our team often suggests international strategies that evaluate opportunities on a company-by-company basis,” Dregits says. “This includes developed market international companies that derive revenue from emerging markets.” Having a broader opportunity set to pick from is rarely a bad starting place. “Whether it’s the prevalence of dividend payers, views on currency, or simply seeking to identify market leaders, international equity allocations can play a key role in portfolio diversification,” says Dregits. Flexible strategies that invest across regions and sectors can also help investors stay focused on their goals through market uncertainty, according to Mathur.
4. Advisors are underweight dividend payers
Many advisors are also surprised to learn they are underweight dividend payers, especially in an environment where dividend payers could be relatively well positioned to withstand market volatility. This may be due to holding more passive investments that seek to track the S&P 500 and have typically had less exposure to higher dividend payers than exchange-traded funds (ETFs) that take a more active approach to dividend payers. The average advisor had a 28% allocation to high dividend payers within portfolio holdings compared to 37% for the American Funds Moderate Growth and Income model, as of September 30. As a result, many portfolios may miss out on the benefits higher dividend payers have historically provided, such as an enhanced measure of downside protection in difficult markets.
Limited dividend exposure versus model portfolio
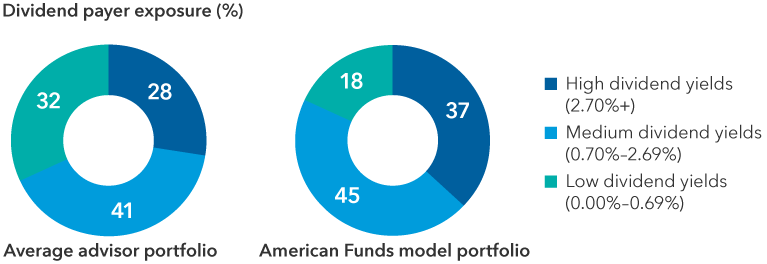
Source: Capital Group, FactSet, and Morningstar, as of September 30, 2023. The American Funds model portfolio represents the most recent available data, as of September 30, 2023, for the American Funds Moderate Growth and Income Model Portfolio.
Our takeaway: Consider focusing on dividend payers with the potential for sustainable dividend growth. Currently, many dividend payers are at or near all-time attractive valuations and can provide equity diversification during this period of heavy equity market concentration and potentially over the long term. In addition, we also find that many advisors who are focused on tax efficiency for their clients are interested in ETFs that can access dividend opportunities. “We regularly analyze dividend exposure with advisors to suggest a range of options, depending on their needs. This includes active dividend ETFs, which have tended to provide more diversification than passive ETFs that seek to track the S&P 500, especially given heavy levels of concentration in the top 10 S&P stocks,” says Dregits.
Want to get another perspective on your client portfolios?
Many advisors we’ve worked with have told us that they like hearing an unbiased perspective on portfolios and talking through solutions with trusted partners. This is especially valuable through periods of market uncertainty. We are here to analyze portfolios along with you and talk through any challenges you may be facing. Here’s how you can request a portfolio consultation from one of our portfolio specialists to help you address your clients’ specific investment goals. Book a consultation here: Portfolio Consultation | Capital Group

Mark Barile is a Senior Manager, Portfolio Consulting and Analytics with 20 years of industry experience as of 12/31/2025. He holds a bachelor's degree in studio art from Trinity University. He also holds the Certified Investment Management Analyst® designation.

Casey Dregits is a senior portfolio consultant at Capital Group. He has 23 years of industry experience, all with Capital Group. He holds a bachelor’s degree in political science, history and Germanic studies from Indiana University and an MBA. Casey is also a certified Chartered Alternative Investment Analyst and Chartered Financial Analyst.
Samir Mathur is a solutions portfolio manager with 32 years of industry experience (as of 12/31/2024). He holds a master of business administration from the University of California at Berkeley, a master's degree in computer science from the University of Southern California and a bachelor of technology from the Indian Institute of Technology Delhi.