
American Funds® International Vantage Fund
- Vehicle
- Mutual Fund
- Objective
- Growth
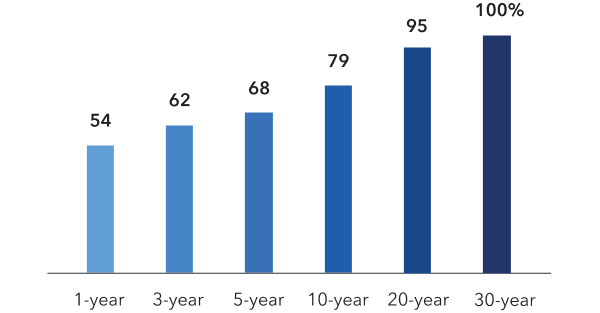
Percentage rolling success rates vs. benchmarks
Number of holdings
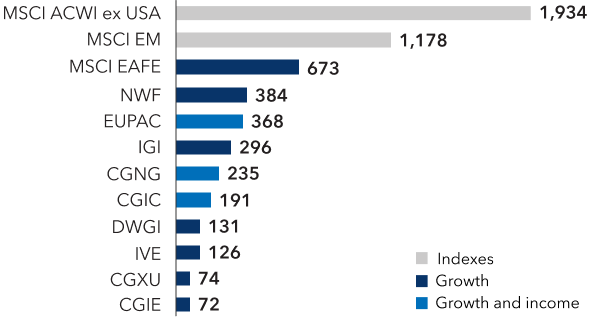
Source: Capital Group. As of 6/30/26. Rolling monthly success rates are for the American Funds® and exchange traded funds (ETFs) noted in the right-hand chart. Equity fund observation periods run from each fund’s inception through its full lifetime. Please refer to the footnotes/important information section for a list of indexes used for each comparison. MSCI ACWI ex USA – MSCI All Country World Index (ACWI) ex USA, MSCI EM – MSCI Emerging Markets Index, MSCI EAFE – MSCI EAFE (Europe, Australasia, Far East) Index, NWF – New World Fund®, EUPAC – EUPAC Fund™, IGI – International Growth and Income Fund, CGNG – Capital Group New Geography Equity ETF, CGIC – Capital Group International Core Equity ETF, DWGI – American Funds Developing World Growth and Income Fund, IVE – American Funds International Vantage Fund, CGIE – Capital Group International Equity ETF, CGXU – Capital Group International Focus Equity ETF.
“We cast a wide net outside the U.S. to find exceptional investment opportunities — often by meeting management on their home turf. That boots-on-the-ground approach helps us uncover opportunities others might miss.”
Nick Grace
Portfolio manager
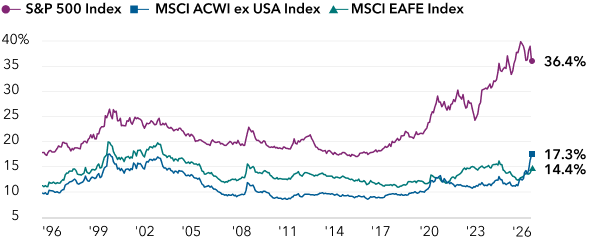
Sources: Capital Group, Morningstar, MSCI, S&P Dow Jones Indices. As of 6/30/26. Figures represent the sum of the top 10 largest holdings of the indexes on a monthly basis.
Share of index top 10 holdings comprised of information technology, consumer discretionary and communication services
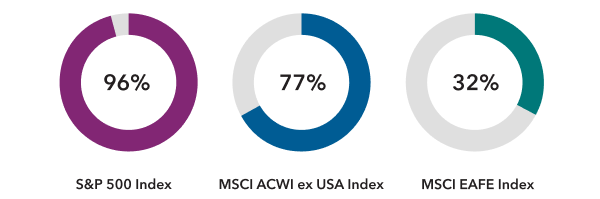
Sources: Capital Group, MSCI, S&P Dow Jones Indices. As of 6/30/26.
CAPITAL GROUP INTERNATIONAL EQUITY ETF

Analyst-Driven: 10%
Data Coverage: 76%
Source: Morningstar.
As of 7/31/26.
“Investing in established international companies that pay dividends allows us to participate in global growth while buffering volatility. Those dividend payers can act like an anchor in rough markets.”
Steve Watson
Portfolio manager
Relative dividend yield indexed to 100
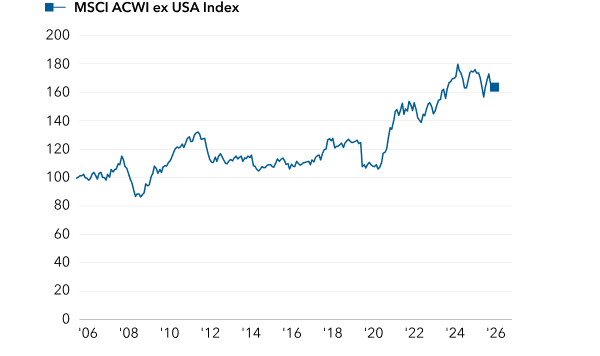
Forward P/E ratio, MSCI ACWI ex USA Index relative to the S&P 500 Index
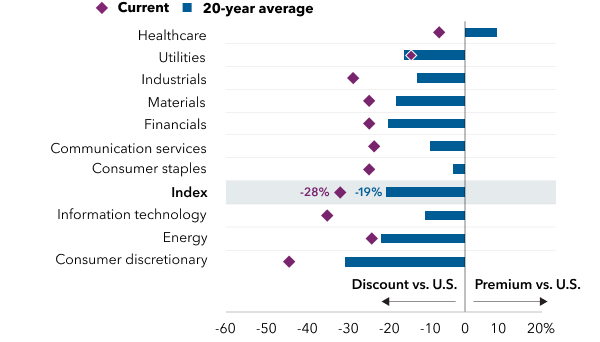
Sources: Capital Group, FactSet. As of 6/30/26. Forward P/E represents the P/E multiple for the next fiscal year. Price-to-earnings (P/E) ratio: Stock price divided by earnings per share. Valuation: An estimate of a company’s worth based on metrics including earnings, revenue or assets. Relative dividend yield and relative forward P/E ratios are calculated by dividing each valuation metric for the MSCI ACWI ex USA Index by the corresponding metric for the S&P 500 Index. Dividend yields are based on last 12 months.
Capital Group International Core Equity ETF
Analyst-Driven: 100%
Data Coverage: 100%
Source: Morningstar.
As of 5/11/26.

Perspectives
Success rate: How often a fund outpaced peers or benchmarks.
Past results are not predictive of results in future periods.
MSCI All Country World Index ex USA is a free-float-adjusted market-capitalization-weighted index that is designed to measure equity market results in the global developed and emerging markets, excluding the United States. The index consists of more than 40 developed- and emerging-market country indexes. When applicable, results through December 31, 2000, reflect dividends gross of withholding taxes, and dividends net of withholding taxes thereafter.
MSCI EAFE® (Europe, Australasia, Far East) Index is a free float-adjusted market capitalization weighted index that is designed to measure developed equity market results, excluding the United States and Canada. Results reflect dividends net of withholding taxes.
MSCI Emerging Markets Index is a free float-adjusted market capitalization weighted index that is designed to measure equity market results in the global emerging markets, consisting of more than 20 emerging market country indexes. Results reflect dividends gross of withholding taxes through December 31, 2000, and dividends net of withholding taxes thereafter.
S&P 500 Index is a market capitalization-weighted index based on the results of approximately 500 widely held common stocks. Results include reinvested dividends but excludes fees and taxes.
Index comparisons: EUPAC (EUPAC Fund Historical Benchmarks Index); IGI (International Growth and Income Fund Historical Benchmarks Index); IVE, CGIE (MSCI EAFE Index); NWF, CGNG (New Geography/New World Historical Benchmarks Index); DWGI (MSCI Emerging Markets Index); CGIC, CGXU (MSCI ACWI ex USA Index).
EUPAC Fund Historical Benchmarks Index returns reflect the results of the MSCI EAFE® Index through 03/31/2007 and the MSCI All Country World ex USA Index, the fund's current primary benchmark, thereafter. International Growth and Income Fund Historical Benchmarks Index returns reflect the results of the MSCI World ex USA Index through 06/30/2011 and the MSCI All Country World ex USA Index, the fund's current primary benchmark, thereafter. New Geography/New World Historical Benchmarks Index returns reflect the results of the MSCI All Country World Index (ACWI) through December 31, 2025, and the MSCI Emerging Markets Index, the primary benchmark, thereafter.
The return of principal for bond portfolios and portfolios with significant underlying bond holdings is not guaranteed. Investments are subject to the same interest rate, inflation and credit risks associated with the underlying bond holdings.
Lower rated bonds are subject to greater fluctuations in value and risk of loss of income and principal than higher rated bonds.
Investing outside the United States involves risks, such as currency fluctuations, periods of illiquidity and price volatility. These risks may be heightened in connection with investments in developing countries. (Also applies to CGIC, CGIE, CGNG and CGXU).
Nondiversified funds have the ability to invest a larger percentage of assets in the securities of a smaller number of issuers than a diversified fund. As a result, poor results by a single issuer could adversely affect fund results more than if the fund were invested in a larger number of issuers. See the applicable prospectus for details. (Also applies to CGIC, CGIE and CGNG).
The Morningstar Medalist Rating is the summary expression of Morningstar's forward-looking analysis of investment strategies as offered via specific vehicles using a rating scale of Gold, Silver, Bronze, Neutral, and Negative. The Medalist Ratings indicate which investments Morningstar believes are likely to outperform their Morningstar Category average on a risk-adjusted basis over time.
Investment products are evaluated on three fundamental pillars (People, Parent, and Process) and the Medalist Rating Price Score, which forms the basis for Morningstar's conviction in those products' investment merits and determines the Medalist Rating they are assigned. Pillar ratings take the form of Low (-2), Below Average (-1), Average (0), Above Average (+1), and High (+2). Pillars may be evaluated via an analyst's qualitative assessment (either directly to a vehicle the analyst covers or indirectly when the pillar ratings of a covered vehicle are mapped to a related uncovered vehicle) or using algorithmic techniques.
The cost of an investment product is evaluated using the Medalist Rating Price Score, which is a continuous score running from negative 2.5 to positive 2.5 based on the percentile rank of a vehicle's expense ratio within its Morningstar Category. Morningstar combines the pillar scores and Medalist Rating Price Score using predetermined weights for actively and passively managed vehicles to calculate a weighted score. The weighted score is then compared to a set of fixed numeric thresholds employed consistently across Morningstar Categories and regions, with separate thresholds for actively and passively managed investments. Rating thresholds are reviewed at least annually. Buffers and ratings caps are employed to prevent frequent ratings changes.
When analysts directly cover a vehicle, they assign the fundamental pillar ratings based on their qualitative assessment, subject to the oversight of the Analyst Rating Committee, and monitor and reevaluate them approximately once a year. When vehicles are covered either indirectly by analysts or by algorithm, the ratings are assigned monthly. For more detail information about the Medalist Ratings, including their methodology, please visit Morningstar’s website for more information.
The Morningstar Medalist Ratings are not statements of fact, nor are they credit or risk ratings. The Morningstar Medalist Rating (i) should not be used as the sole basis in evaluating an investment product, (ii) involves unknown risks and uncertainties which may cause expectations not to occur or to differ significantly from what was expected, (iii) is not guaranteed to be based on complete or accurate assumptions or models when determined algorithmically, (iv) involves the risk that return targets will not be met due to unforeseen changes in management, technology, economic development, interest rate development, operating and/or material costs, competitive pressure, supervisory law, exchange rates, tax rates, or political and social conditions, and (v) should not be considered an offer or solicitation to buy or sell the investment product.
A change in the fundamental factors underlying the Morningstar Medalist Rating may result in the rating no longer being accurate. Analysts do not have any other material conflicts of interest at the time of publication. Users wishing to obtain further information should contact their local Morningstar office.