5 things to know about Capital Group International Equity ETF

CGIE
 1

A conservative approach to international equities
 

  • The fund seeks prudent capital growth and conservation of principal by investing primarily in companies based in developed markets.
  • CGIE aims for a smoother return profile across full market cycles with lower volatility by focusing on companies with long-term growth potential and downside resilience attributes.
  • Historically, CGIE has exhibited lower standard deviation and beta than the MSCI EAFE® (Europe, Australasia, Far East) Index, indicating reduced volatility and smaller fluctuations around its average return.

CGIE volatility metrics since inception

Table compares volatility and market sensitivity for CGIE – Capital Group International Equity ETF and the MSCI EAFE (Europe, Australasia, Far East) Index. CGIE has a standard deviation of 12.4 and a beta of 0.9. The MSCI EAFE Index has a higher standard deviation of 13.4 and a beta of 1.

Source: Morningstar. Data from fund inception date of 9/26/23 to 3/31/26.

 2

Quality focus
 

  • The fund takes a prudent approach to international investing, limiting emerging markets (EM) exposure to no more than 10% of net assets.
  • Factor analysis suggests the ETF has consistently delivered greater exposure to the quality factor relative to the MSCI EAFE Index, reflecting differentiated holdings relative to the index.
  • Quality factor exposure measures a portfolio’s tilt toward companies with strong fundamentals — such as high profitability, stable earnings, and low leverage — compared to the broader market.

Quality factor exposure

Bar chart shows quality factor exposure for CGIE – Capital Group International Equity ETF and the MSCI EAFE Index since 2023 through 2026. CGIE has positive values ranging from about 0.17 to 0.29. The MSCI EAFE Index shows negative values, ranging from -0.01 to -0.06. The horizontal axis represents time in years, and the vertical axis ranges approximately from −0.10 to 0.35. Each period includes two bars: a darker bar that represents CGIE, and a lighter bar that represents the MSCI EAFE Index.

Source: Morningstar. Data from fund inception date of 9/26/23 to 3/31/26. This exhibit illustrates historical exposure to quality factor as defined and calculated by Morningstar, representing the amount of standard deviations that each factor exposure is away from the mean. Morningstar defines a quality firm as one with high profitability and low financial leverage. High scores imply high quality firms. A score of 0 can be interpreted as an average score with a nonzero score being interpreted as the amount of standard deviations from the mean. A quality score of a stock is the equally weighted score of the a company’s profitability (trailing 12-month return on asset) and the score of its financial leverage (trailing 12-month debt/invested capital. The factor is unbounded and higher scores indicate higher quality.

 3

Dynamic positioning
 

  • CGIE’s sector exposures are driven by bottom‑up security selection, not top‑down sector views or index weights.
  • As research conviction in individual holdings evolves, sector allocations naturally expand or contract based on where growth opportunities may emerge.
  • This approach can lead to dynamic sector positioning over time, rather than static alignment with benchmark sector weights.

Sector exposures (%)

Bar chart shows the sector exposures as percentage ranges across major sectors, including communication services, consumer discretionary, consumer staples, energy, financials, healthcare, industrials, information technology, materials and utilities. The vertical axis ranges from roughly 0 to 30%. For each sector, a shaded vertical bar indicates the highest and lowest values, a dashed line marks the average, and a dot shows the current value. Industrials and financials display the highest overall ranges and the current values, followed by information technology. Healthcare, consumer discretionary and consumer staples sectors cluster in the mid-range, showing moderate spreads. Energy, materials and utilities exhibit narrower ranges and lower overall values, while communication services has the lowest values across the sectors.

Source: Capital Group based on data from FactSet. Data from fund inception date of 9/26/23 to 3/31/26.

 4

Access to global leaders beyond U.S. markets
 

  • CGIE’s underlying managers look beyond the U.S. for a broad range of opportunities as global leaders have often been found in international markets.
  • While leadership has been concentrated within the U.S. in a historic way, new opportunities are emerging in markets outside the United States.
  • These opportunities include areas like artificial intelligence (AI), where the fund seeks to participate through the broader AI ecosystem, including semiconductor manufacturers, as well as utilities and electrification.

Market leadership by decade

Bar chart shows the geographic dispersion and consistency of the world’s top 10 companies based on market capitalization by decade from 1980 through 2025. The top row shows how many companies remained in the top 10 in the following decade, with only 3 in 1980 and 2 in 1990, 2000 and 2010, before rising to 6 in 2020, while 2025 is marked as not available as it is still mid-decade. The lower section shows the domicile of the top 10 in each decade, with U.S.-based companies vacillating in representation from 8 of 10 in 1980, to 4 of 10 in 1990, to 6 of 10 in 2000, to 3 of 10 in 2010, to 6 of 10 in 2020 and finally 9 of 10 this decade as of 2025. Non-U.S. companies represent the remainder, peaking at 7 of 10 in 2010 and declining to 1 of 10 by 2025.

Sources: Capital Group, MSCI, RIMES. Largest companies are based on market capitalization in USD. All returns are annualized 10-year total returns in USD, starting on the observation date. Observation date for each set of holdings is December 31 of the year.

For example, for 1980, the observation date for the largest companies is December 31, 1980. The exception is for 2000, which uses the observation date of February 28, 2000, as it reflects the closest month-end peak of the tech bubble. Next 10 years refers to the average annual total return of the stock or index from the current decade’s beginning observation date to the beginning of the next decade. As of 12/31/25.

 5

A differentiated approach
 

  • Using a bottom‑up approach, CGIE maintains sector exposures that differ from the MSCI EAFE Index.
  • The fund is overweight industrials, information technology and utilities, while underweight financials, healthcare and consumer staples.
  • This approach is designed to support the objective of prudent capital growth and principal preservation.
Table shows sector allocation comparisons for CGIE – Capital Group International Equity ETF versus the MSCI EAFE Index, along with representative top CGIE holdings by sector. Industrials represents 19.4 percent of the MSCI EAFE Index and 26.9 percent of CGIE, with Safran (aerospace and defense) listed as a top holding. Financials accounts for 24.5 percent in the index and 20.5 percent in CGIE, with Skandinaviska Enskilda Banken (banks) as a top holding. Information technology is 8.5 percent in the index and 15.0 percent in CGIE, with ASML (semiconductors) listed as a top holding. Healthcare represents 11.2 percent in the index and 8.5 percent in CGIE, with AstraZeneca (pharmaceuticals) as a top holding. Consumer staples is 7.3 percent in the index and 6.9 percent in CGIE, with Nestlé (packaged food) listed as a top holding. Utilities accounts for 4.2 percent in the index and 6.4 percent in CGIE, with RWE (electricity) as a top holding. Consumer discretionary represents 8.5 percent in the index and 5.0 percent in CGIE, with Inditex (fashion) listed as a top holding. Materials accounts for 6.0 percent in the index and 3.5 percent in CGIE, with Glencore (metals and minerals) as a top holding. Energy represents 4.4 percent in the index and 3.4 percent in CGIE, with TotalEnergies (oil and gas) listed as a top holding. Communication services accounts for 4.3 percent in the index and 1.4 percent in CGIE, with Tencent (digital entertainment) as a top holding. Real estate represents 1.8 percent in the index and zero percent in CGIE.

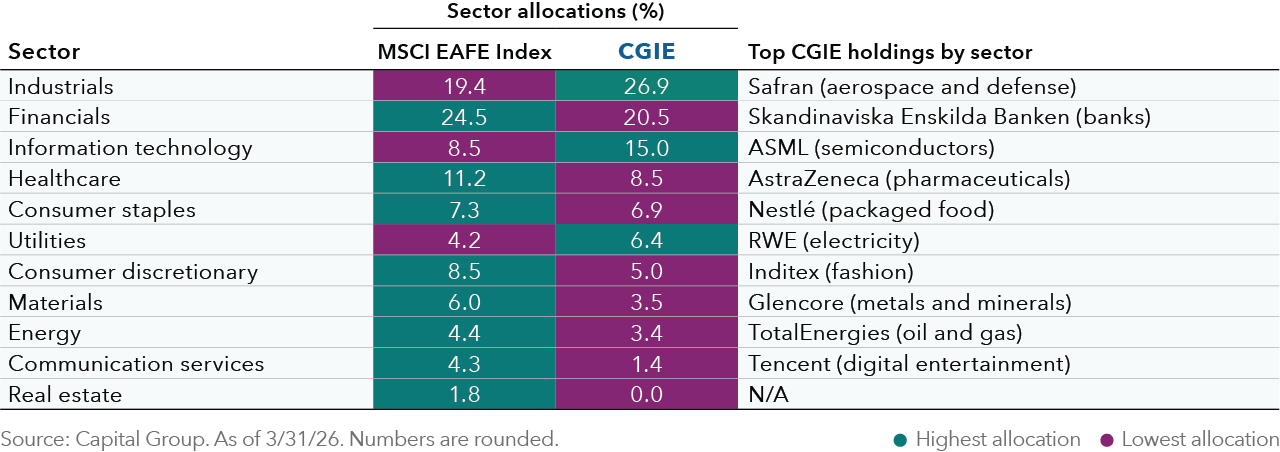
Source: Capital Group. As of 3/31/26. Numbers are rounded.

CGIE fund details

Read more perspectives on equity markets

Investments are not FDIC-insured, nor are they deposits of or guaranteed by a bank or any other entity, so they may lose value.
Investors should carefully consider investment objectives, risks, charges and expenses. This and other important information is contained in the ETF prospectuses and summary prospectuses, which can be obtained from a financial professional and should be read carefully before investing.
Capital Group exchange-traded funds (ETFs) are actively managed and do not seek to replicate a specific index. ETF shares are bought and sold through an exchange at the then current market price, not net asset value (NAV), and are not individually redeemed from the fund. Shares may trade at a premium or discount to their NAV when traded on an exchange. Brokerage commissions will reduce returns. There can be no guarantee that an active market for ETFs will develop or be maintained, or that the ETF's listing will continue or remain unchanged.
Investing outside the United States involves risks, such as currency fluctuations, periods of illiquidity and price volatility. These risks may be heightened in connection with investments in developing countries.
Nondiversified funds have the ability to invest a larger percentage of assets in the securities of a smaller number of issuers than a diversified fund. As a result, poor results by a single issuer could adversely affect fund results more than if the fund invested in a larger number of issuers. See the applicable prospectus for details.
There have been periods when the results lagged the index(es) and/or average(s). The indexes are unmanaged and, therefore, have no expenses. Investors cannot invest directly in an index.
Source: MSCI. The MSCI information may only be used for your internal use, may not be reproduced or redisseminated in any form and may not be used as a basis for or a component of any financial instruments or products or indices. None of the MSCI information is intended to constitute investment advice or a recommendation to make (or refrain from making) any kind of investment decision and may not be relied on as such. Historical data and analysis should not be taken as an indication or guarantee of any future performance analysis, forecast or prediction. The MSCI information is provided on an “as is” basis and the user of this information assumes the entire risk of any use made of this information. MSCI, each of its affiliates and each other person involved in or related to compiling, computing or creating any MSCI information (collectively, the “MSCI Parties”) expressly disclaims all warranties (including, without limitation, any warranties of originality, accuracy, completeness, timeliness, non-infringement, merchantability and fitness for a particular purpose) with respect to this information. Without limiting any of the foregoing, in no event shall any MSCI Party have any liability for any direct, indirect, special, incidental, punitive, consequential (including, without limitation, lost profits) or any other damages. Please visit the data provider's website for more information.
All Capital Group trademarks mentioned are owned by The Capital Group Companies, Inc., an affiliated company or fund. All other company and product names mentioned are the property of their respective companies.
Use of this website is intended for U.S. residents only. Use of this website and materials is also subject to approval by your home office.
Capital Client Group, Inc.
This content, developed by Capital Group, home of American Funds, should not be used as a primary basis for investment decisions and is not intended to serve as impartial investment or fiduciary advice.
© 2026 Morningstar, Inc. All rights reserved. The information contained herein: (1) is proprietary to Morningstar and/or its content providers; (2) may not be copied or distributed; and (3) is not warranted to be accurate, complete or timely. Neither Morningstar, its content providers nor Capital Group are responsible for any damages or losses arising from any use of this information. Past performance is no guarantee of future results. Information is calculated by Morningstar. When applicable, due to differing calculation methods, the figures shown here may differ from those calculated by Capital Group.

Beta is an indicator of the price volatility of a stock or other asset in comparison with the broader market. It suggests the level of risk that an investor takes on in buying the stock. The higher the beta number, the higher the risk.


Factor analysis is a statistical data-reduction technique that breaks down asset or portfolio returns into underlying drivers of risk and return.


Standard deviation measures how much an investment’s returns fluctuate from its average over time. It is the metric used to quantify volatility and risk.


MSCI EAFE® (Europe, Australasia, Far East) Index is a free float-adjusted market capitalization weighted index that is designed to measure developed equity market results, excluding the United States and Canada.


FactSet is a registered trademark of FactSet Research Systems Inc. All FactSet data contained herein is provided "as is" and is for informational purposes only. FactSet makes no warranties as to the accuracy, completeness or timeliness of the data and shall not have any liability for any errors or omissions.


RIMES: RIMES data contained herein is the property of RIMES Technologies Corporation and/or its data providers, is provided "as is" and is for informational purposes only. RIMES makes no warranties as to the accuracy, completeness or timeliness of the data and shall not have any liability for any errors or omissions. The data may not be further redistributed or used as a basis for other indexes or any securities or financial products.