
Markets are changing. Are you ready?
Risks are rising, but opportunities remain
Many valuation measures look extended. Indexes are concentrated. Passive exposure is high. Yet markets are broadening, earnings growth is strong and the AI cycle is evolving.
We’ve delivered better outcomes
Our U.S. equity funds have delivered index-beating results. We believe greater diversification, flexible positioning, deep research and a long-term orientation promote better outcomes.
S&P 500 concentration reaches new high
Percentage of market capitalization in top 10 companies
Sources: Capital Group, Morningstar, MSCI, S&P Dow Jones Indices. As of 3/31/26. Figures represent the sum of the top 10 largest holdings of the index on a monthly basis.
Advisors expect pivot to active U.S. equity strategies
Percentage share of advisors anticipating change in asset class usage over next six months
Sources: Escalent, Cogent Syndicated, Advisor Brandscape® 2025.
Better outcomes and less concentration
Our U.S. equity funds have outpaced their indexes
Percentage rolling success rates vs. benchmarks
Portfolios with less concentration
Percentage weight in Magnificent 7 stocks
Source: Capital Group. As of 3/31/26. Rolling monthly success rates are for the American Funds® and ETFs noted in the right-hand chart. Observation periods for equity funds are based on individual inception dates and are for the full lifetime of each fund. The primary benchmark for all 10 of these funds is the S&P 500. Magnificent 7: Alphabet, Amazon, Apple, Meta, Microsoft, NVIDIA and Tesla. Alphabet is represented by both Class A and Class C shares. R1KG – Russell 1000 Growth Index, CGGR – Capital Group Growth ETF, AMCAP – AMCAP Fund®, CGUS – Capital Group Core Equity ETF, GFA – The Growth Fund of America®, ICA – The Investment Company of America®, CGDV – Capital Group Dividend Value ETF, FI – Fundamental Investors®, WMIF – Washington Mutual Investors Fund, CGCV – Capital Group Conservative Equity ETF, AMF – American Mutual Fund®.
- Growth
- Dividends
Participate with dynamic growth
While valuations remain elevated, they’re supported by strong earnings growth and robust free cash flows bolstering AI investment. Beyond technology, opportunities exist across sectors such as consumer goods, industrials and healthcare — creating a broader landscape for growth.
Forward P/E multiple of S&P 500 top and bottom valuation quintiles (sector-neutral)
Source: Goldman Sachs. As of 3/31/26. Forward P/E represents the P/E multiple for the next fiscal year. Price-to-earnings (P/E) ratio: Stock price divided by earnings per share. Valuation: An estimate of a company’s worth based on metrics including earnings, revenue or assets.
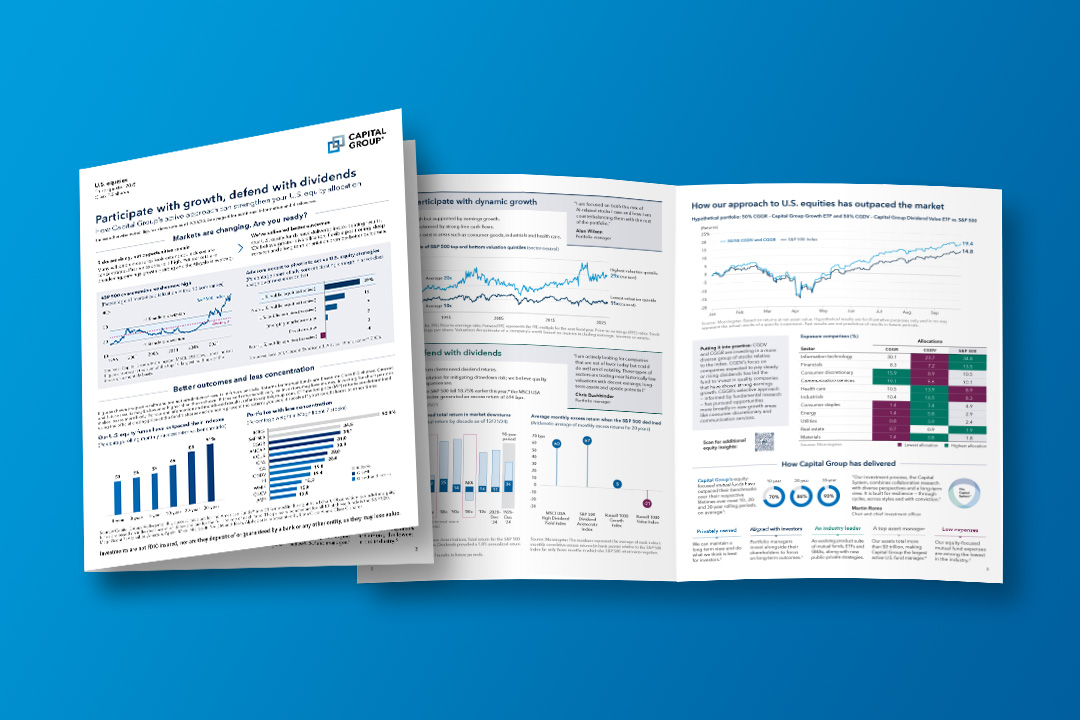
How our approach to U.S. equities has outpaced the market
Hypothetical portfolio: 50% CGGR — Capital Group Growth ETF and 50% CGDV — Capital Group Dividend Value ETF vs. S&P 500
Putting it into practice: CGDV and CGGR have invested in a more diverse group of stocks relative to the index. CGDV’s focus on companies expected to pay steady or rising dividends has led the fund to invest in quality companies that have shown strong earnings growth. CGGR’s selective approach — informed by fundamental research — has pursued opportunities more broadly in new growth areas like consumer discretionary and communication services.
Source: Morningstar. As of 3/31/26.
U.S. equities brochure
Learn how our approach has delivered better outcomes on average across market cycles.
How Capital Group has delivered
Capital Group equity-focused mutual funds have outpaced their benchmarks over their respective lifetimes over most 10-, 20- and 30-year rolling periods, on average1:
Privately owned
We can maintain a long-term view and do what we think is best for investors.2
Aligned with investors
Portfolio managers invest alongside their shareholders to focus on long-term outcomes.3
An industry leader
With an evolving product suite and assets totaling more than $3 trillion, Capital Group is the largest active U.S. fund manager.4
Low expenses
Our equity-focused mutual fund expenses are among the lowest in the industry.5
About Capital Group
“Our investment process, The Capital System, combines collaborative research with diverse perspectives and a long-term view. It is built for resilience — through cycles, across styles and with conviction.”
Martin Romo
Chair and chief investment officer

Equities
A range of equity strategies following a long-term approach to help investors achieve their goals.
ETFs
Our active ETFs are objective-oriented strategies that offer more choice for our investors, along with the full support of Capital Group's extensive resources.
The Capital System™
Designed to combine the right selection of investment professionals, working together in the right way. See what sets our investment process apart.
Footnotes/Important information:
1 Source: Capital Group. As of 12/31/25. Calculations cover the time frame from January 1934 through December 2025 and are based on rolling monthly periods over each of the existing
funds’ respective lifetimes for Class F-2 shares at net asset value.
2 Portfolio manager compensation puts increasing emphasis on long-term results and is based on 1-, 3-, 5- and 8-year periods.
3 Source: Morningstar. As of 2/19/25. Ninety-seven percent of American Funds assets are invested in mutual funds in which at least one manager has invested more than $1 million.
4 Assets under management claim based on preliminary Capital Group data as of 3/31/26. Largest U.S. mutual fund manager information based on Morningstar data on open-ended mutual fund assets (excluding fund of funds) as of 3/31/26.
5 Source: Capital Group. Based on Morningstar Fee-Level Group - Distribution peers median and the prospectus expense ratio for F-2 American Funds. As of 3/31/26.
Multiple: A way to gauge company performance by dividing one metric by another. Above, it refers to the P/E ratio.
Success rate: How often a fund outpaced peers or benchmarks.
Standard deviation: A measure of return variance over time. Greater positive or negative values indicate greater volatility.
Volatility: A measure of how much a stock’s price fluctuates. Higher volatility means larger price swings and more risk.
Russell 1000 Growth Index: Tracks large-cap U.S. growth stocks by market capitalization.
Russell 1000 Value Index: Tracks large-cap U.S. value stocks by market capitalization.
S&P 500 Index: A market-capitalization-weighted index of about 500 major U.S. stocks. This index is unmanaged, and its results include reinvested dividends and/or distributions but do not reflect the effect of sales charges, commissions, account fees, expenses or U.S. federal income taxes.
S&P 500 Dividend Aristocrats Index: Equal-weighted index of S&P 500 companies that have raised dividends for more than 25 years.
MSCI USA High Dividend Yield Index: Focuses on U.S. large- and mid-cap stocks with strong, sustainable dividends, excluding REITs.
- Class F-2 shares were first offered on 8/1/2008.
ETF market price returns since inception are calculated using NAV for the period until market price became available (generally a few days after inception).
Investing outside the United States involves risks, such as currency fluctuations, periods of illiquidity and price volatility. These risks may be heightened in connection with investments in developing countries. (Also applies to CGGR and CGUS).
Nondiversified funds have the ability to invest a larger percentage of assets in the securities of a smaller number of issuers than a diversified fund. As a result, poor results by a single issuer could adversely affect fund results more than if the fund were invested in a larger number of issuers. See the applicable prospectus for details. (Also applies to CGCV and CGGR).