
5 things to know about Capital Group International Core Equity ETF

CGIC
 1

It's delivered both growth and income
 

  • CGIC seeks long‑term capital growth alongside current income, investing primarily in non‑U.S. companies including those in emerging and developing markets.
  • The fund focuses on established, high‑quality companies with strong earnings and consistent dividends, which may help moderate volatility. The fund has a 1.76% 30-day SEC yield as of 7/31/26.
  • This approach has resulted in historically higher risk-adjusted returns than the benchmark MSCI All Country World Index (ACWI) ex USA since inception.

Value of a hypothetical $10,000 investment (June 25, 2024 to June 30, 2026)
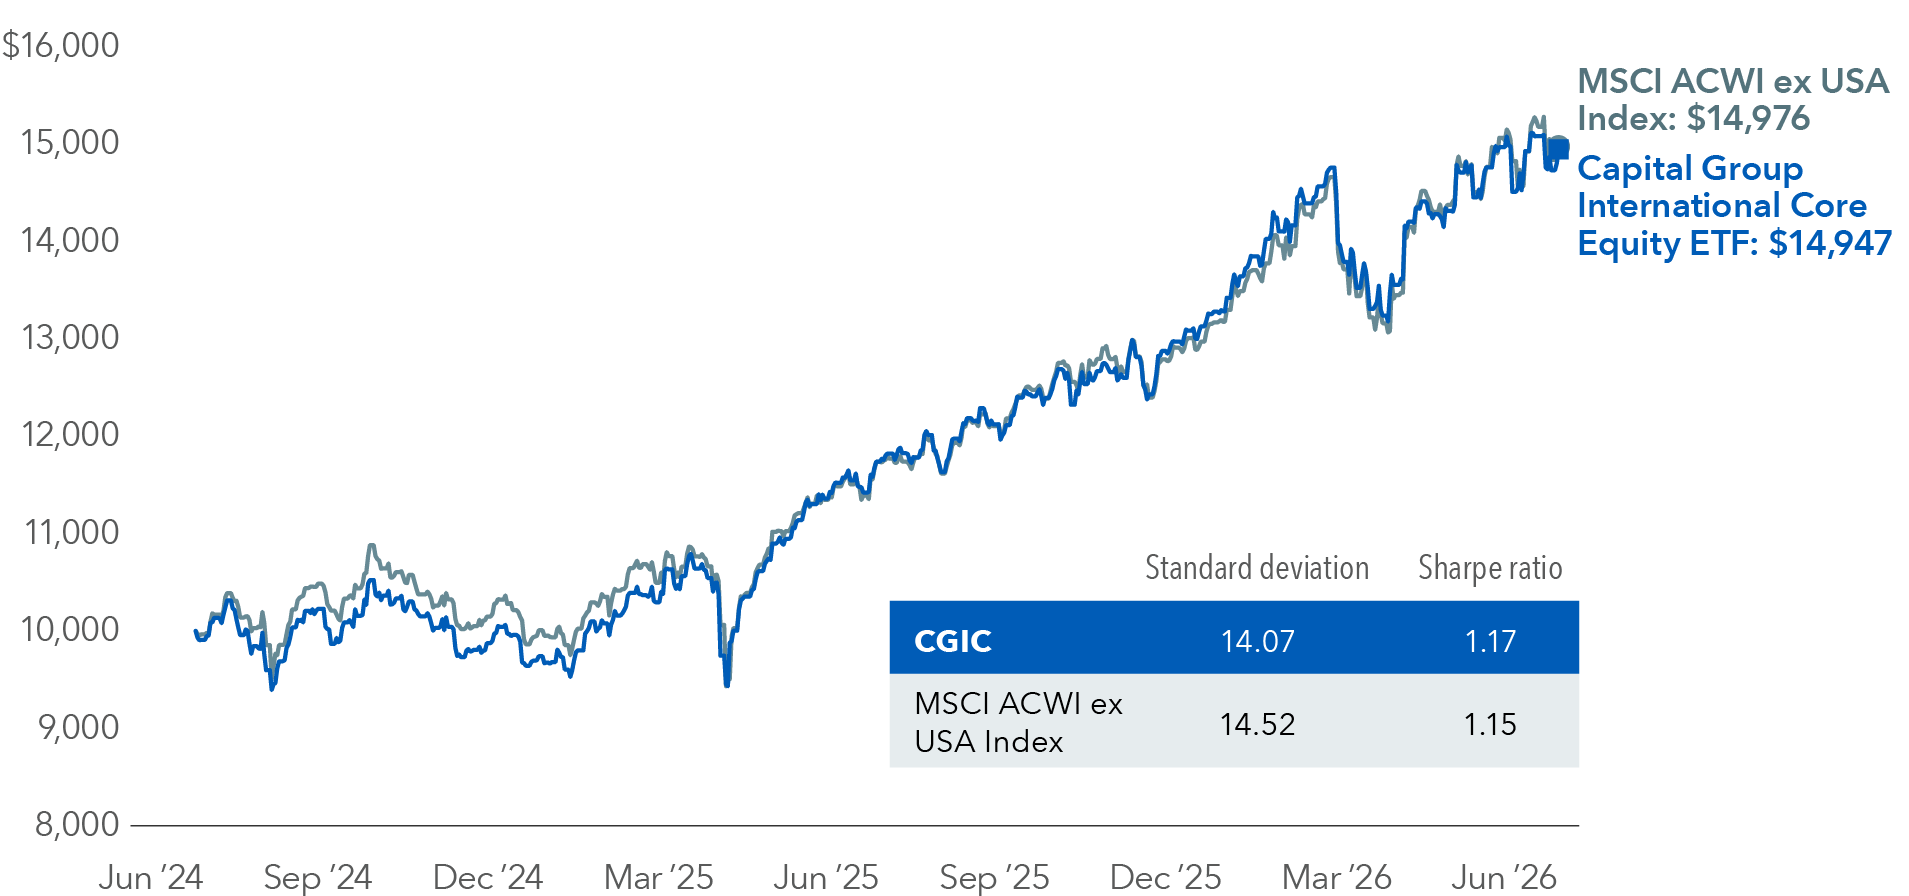
Line chart shows the value of a hypothetical $10,000 investment for CGIC – Capital Group International Core Equity ETF compared with the MSCI All Country World Index (ACWI) ex USA from June 25, 2024, to June 30, 2026. The vertical axis ranges from about $8,000 to $16,000, and the horizontal axis spans from June 2024 through June 2026. Both investments follow similar paths with periods of volatility, including a noticeable dip in early 2025, followed by a sustained upward trend. CGIC generally tracks closely with the index. Both lines rise steadily through late 2025, reaching peak values around $15,000 before declining modestly toward the end of the period. By June 30, 2026, CGIC ends at $14,947, compared with $14,976 for the MSCI ACWI ex USA. The line chart also features risk-adjusted performance metrics for the same time period. CGIC has a standard deviation of 14.07 and a Sharpe ratio of 1.17, while the MSCI ACWI ex USA has a standard deviation of 14.52 and a Sharpe ratio of 1.15.

Source: Morningstar. As of 6/30/26.

 2

Maintained a core approach
 

  • CGIC has offered investors balanced style exposure, holding a core profile without leaning too far toward value or growth.
  • The fund strikes a balance between companies that are undervalued and overlooked and companies with the potential for above-average growth in sales, earnings and dividends.
  • Currently, the fund intends to invest at least 90% of its assets in non-U.S. holdings.

Morningstar style box analysis
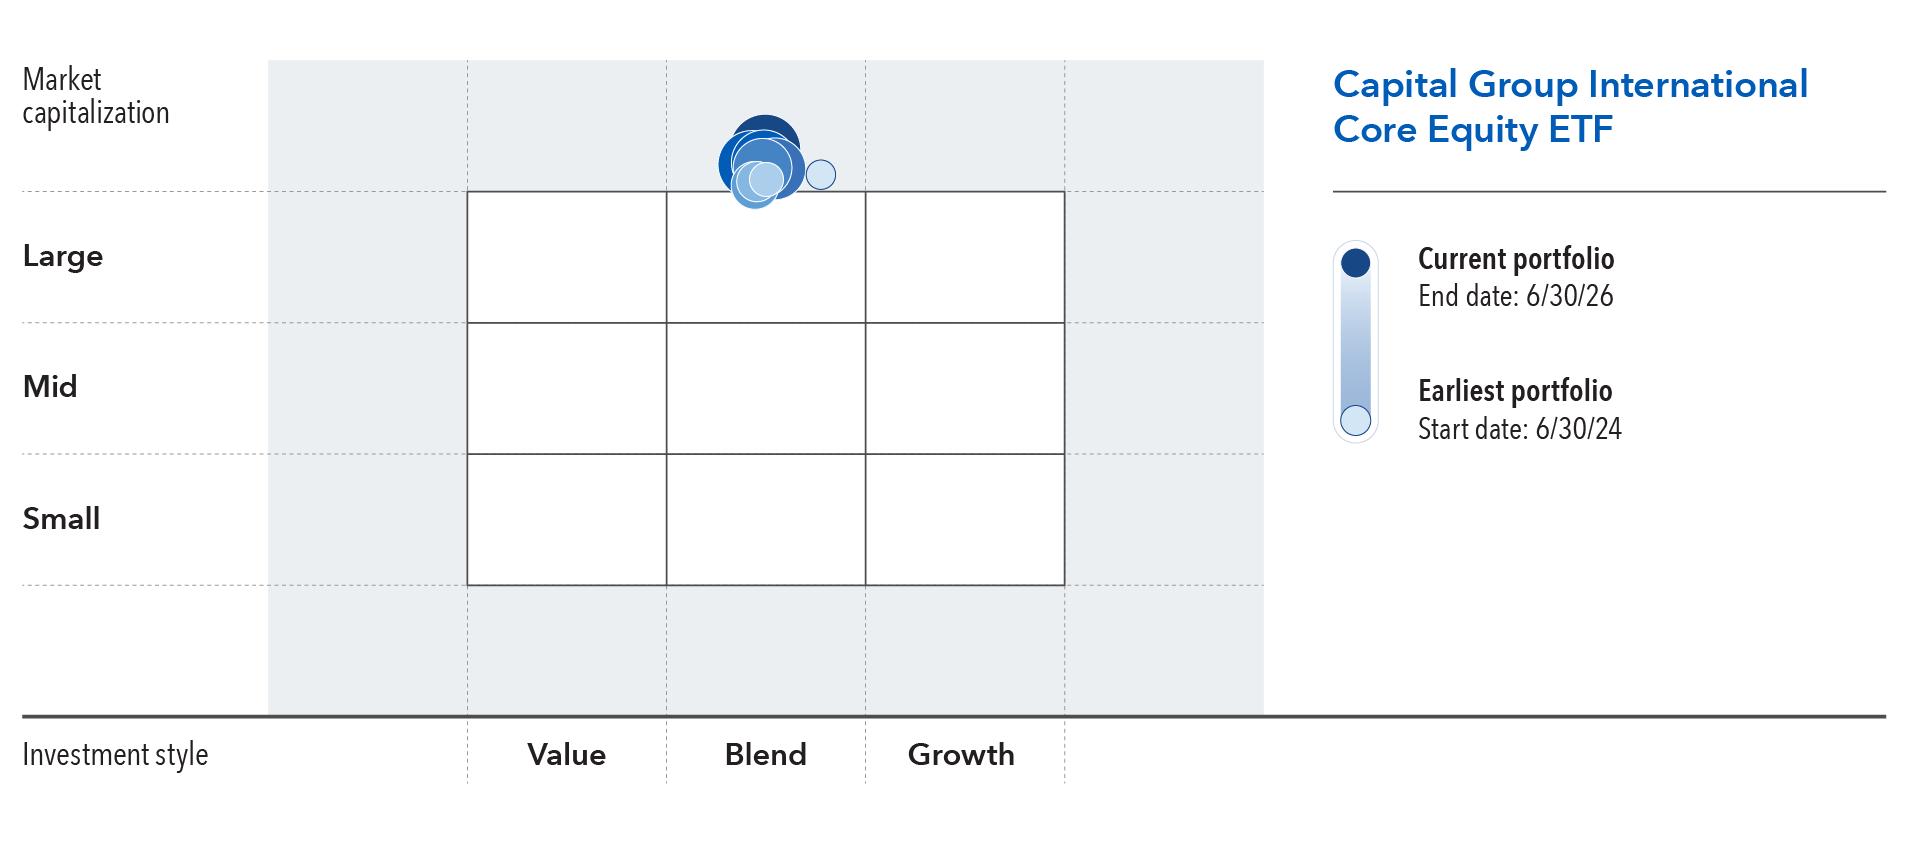
The Morningstar style box analysis shows the investment style and market capitalization positioning for CGIC – Capital Group International Core Equity ETF over time. The vertical axis represents market capitalization, ranging from small to large, and the horizontal axis represents investment style, spanning value, blend and growth. Multiple circles depict the portfolio’s positioning at different points in time, with darker and larger circles representing the most recent portfolio as of June 30, 2026, and lighter, smaller circles representing earlier periods beginning June 30, 2024. The cluster of circles is concentrated in the upper middle portion of the grid, indicating a consistent emphasis on large-cap stocks with a blend-to-growth orientation. Over time, the portfolio shows relatively limited movement, remaining primarily within the large-cap category while shifting modestly within the blend and growth range.

Source: Morningstar. Time period measured is from 6/30/24 to 6/30/26.

 3

Pursues diverse opportunities
 

  • With a core orientation, the fund’s managers seek opportunities for strong returns across the style spectrum, from value to growth.
  • The fund currently emphasizes select traditional growth industries, including semiconductors and semiconductor equipment, as well as aerospace and defense.
  • CGIC fund managers have also shown conviction in traditionally value-oriented industries, such as diversified telecommunication services and tobacco.

Industry weights (%)
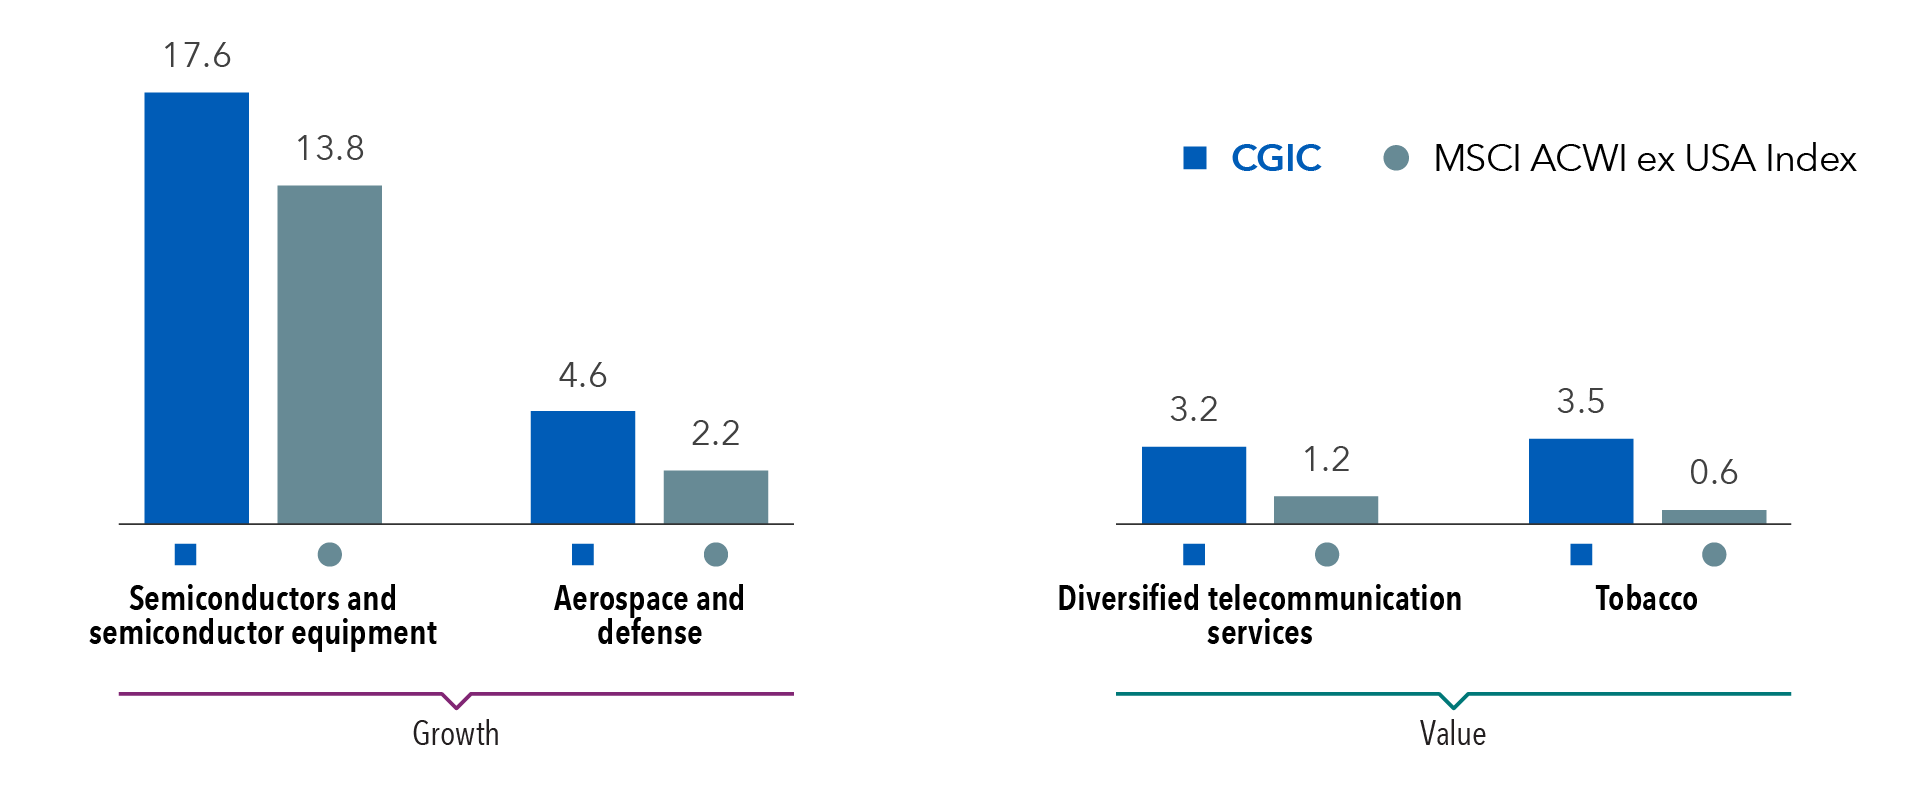
Bar chart shows industry weights for CGIC – Capital Group International Core Equity ETF compared with the MSCI All Country World Index (ACWI) ex USA across selected industries, grouped into growth and value categories. Within growth-oriented industries, semiconductors and semiconductor equipment represent the largest allocation, with CGIC at 17.6% compared with 13.8% for the index. Aerospace and defense shows a smaller allocation, with CGIC at 4.6% versus 2.2% for the index. Within value-oriented industries, diversified telecommunication services has a weight of 3.2% in CGIC versus 1.2% in the index, while tobacco represents 3.5% in CGIC compared with 0.6% for the index.

Source: Capital Group. As of 6/30/26.

 4

Multiple sources of return
 

  • The fund's managers capitalize on multiple sources of return by investing primarily in dividend-paying companies with attractive growth potential across regions, styles and sectors outside the U.S.
  • Amid growing market concentration tied to artificial intelligence (AI) and its related impacts, the fund has sought durable areas of investment that may be less exposed to disruption.
  • CGIC has a sizable allocation to tangible assets, with a track record of investment in materials that recently surpassed the benchmark.

Total allocation to materials (%)
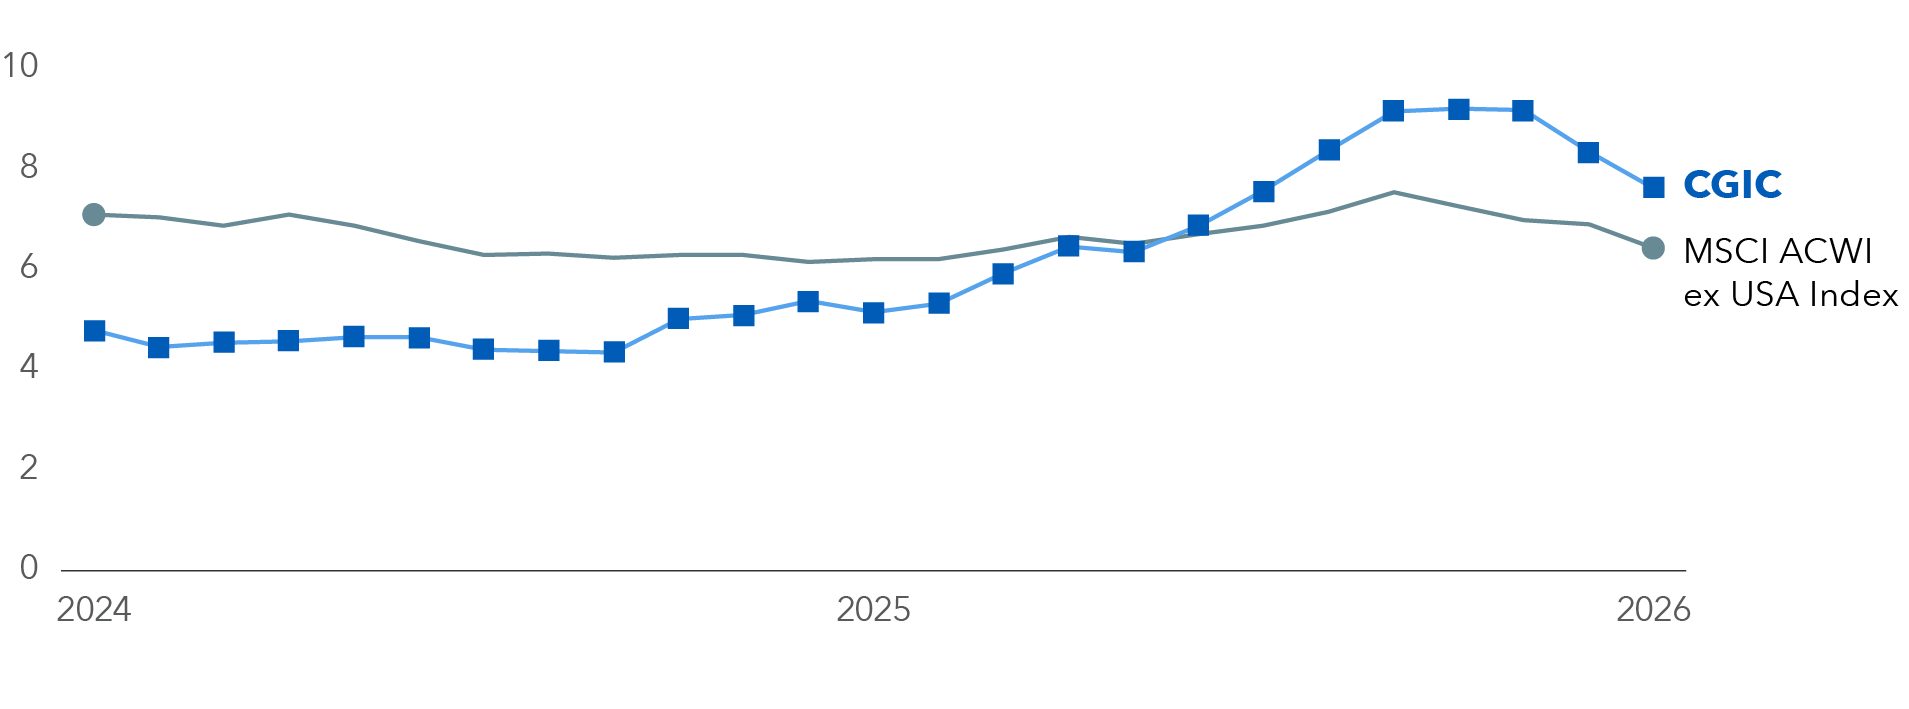
Line chart shows the combined allocation to capital goods, materials and utilities for CGIC – Capital Group International Core Equity ETF compared with the MSCI All Country World Index (ACWI) ex USA over time. The vertical axis ranges from 0% to 10%, and the horizontal axis spans from 2024 through 2026. The series begin at around 5% and 7% for CGIC and MSCI ACWI ex USA Index, respectively. Over time, CGIC trends steadily upward, moving from between 4% and 6% to about 7% and 9% by 2026, ending with a dip to around 7%. The index remains steady throughout the period with a small decline, starting around 7% and ending around 6%. By the end of the period, CGIC surpasses the index.

Source: Capital Group. As of 6/30/26.

 5

A differentiated approach
 

  • Using a bottom‑up approach, CGIC’s sector exposures differ from the benchmark MSCI ACWI ex USA Index.
  • Currently, the fund emphasizes exposure to materials, consumer staples and communication services, while limiting exposure to financials, healthcare and information technology.
  • This positioning aims to provide diversification away from extreme market concentration while maintaining global exposure.

Sector allocations (%)
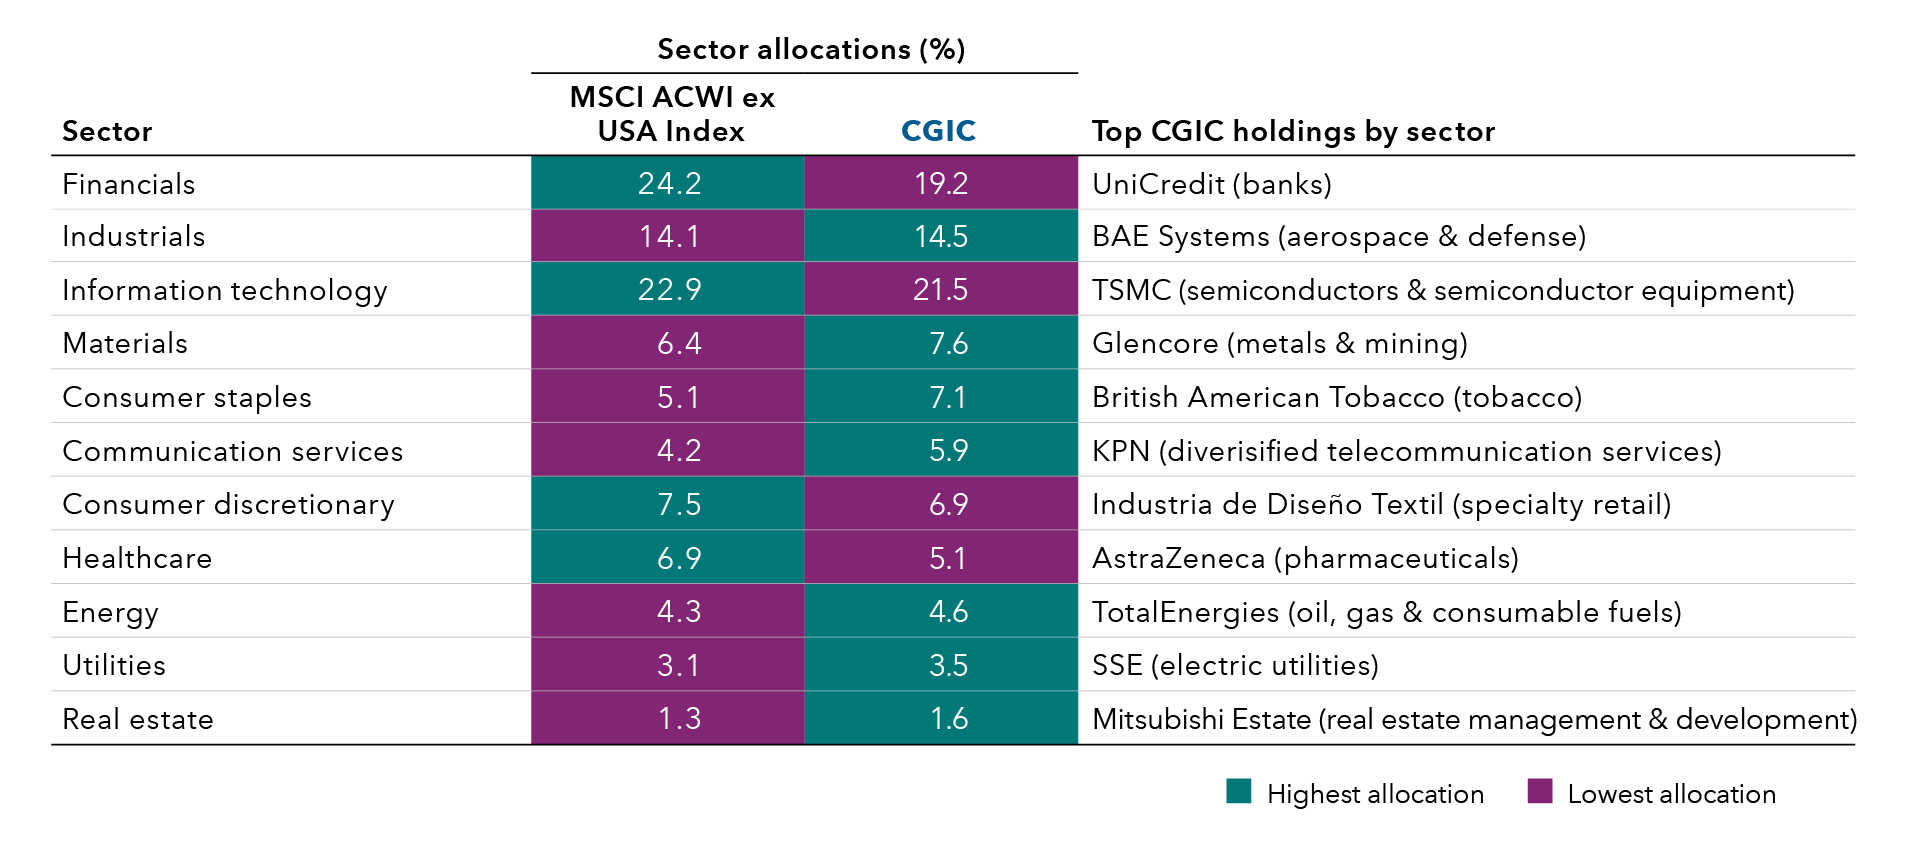
Table shows sector allocation comparisons for CGIC – Capital Group International Core Equity ETF versus the MSCI ACWI ex USA Index, along with representative top CGIC holdings by sector. Financials account for 24.2 percent for the index and 19.2 percent for CGIC, with UniCredit, the top holding for CGIC in the banking industry. Industrials represent 14.1 percent for the index and 14.5 percent for CGIC, with BAE Systems, the top holding for CGIC in the aerospace and defense industry. Information technology accounts for 22.9 percent for the index and 21.5 percent for CGIC, with Taiwan Semiconductor Manufacturing Company, the top holding for CGIC in the semiconductors and semiconductor equipment industry. Materials represent 6.4 percent for the index and 7.6 percent for CGIC, with Glencore, the top holding for CGIC in the metals and mining industry. Consumer staples account for 5.1 percent for the index and 7.1 percent for CGIC, with British American Tobacco, the top holding for CGIC in the tobacco industry. Communication services represent 4.2 percent for the index and 5.9 percent for CGIC, with KPN, the top holding for CGIC in the diversified telecommunication services industry. Consumer discretionary accounts for 7.5 percent for the index and 6.9 percent for CGIC, with Industria de Diseño Textil, the top holding for CGIC in the specialty retail industry. Healthcare represents 6.9 percent for the index and 5.1 percent for CGIC, with AstraZeneca, the top holding for CGIC in the pharmaceuticals industry. Energy accounts for 4.3 percent for the index and 4.6 percent for CGIC, with TotalEnergies, the top holding for CGIC in the oil, gas and consumable fuels industry. Utilities represent 3.1 percent for the index and 3.5 percent for CGIC, with SSE, the top holding for CGIC in the electric utilities industry. Real estate accounts for 1.3 percent for the index and 1.6 percent for CGIC, with Mitsubishi Estate, the top holding for CGIC in the real estate management and development industry.

Source: Capital Group. As of 6/30/26. Numbers are rounded.

CGIC fund details

Read more perspectives on equity markets

Figures shown are past results and are not predictive of results in future periods. Current and future results may be lower or higher than those shown. Investing for short periods makes losses more likely. Prices and returns will vary, so investors may lose money. View ETF expense ratios and returns. View current ETF SEC yields.
For Capital Group ETFs, market price returns are determined using the official closing price of the fund's shares and do not represent the returns you would receive if you traded shares at other times.
Investments are not FDIC-insured, nor are they deposits of or guaranteed by a bank or any other entity, so they may lose value.
Investors should carefully consider investment objectives, risks, charges and expenses. This and other important information is contained in the ETF prospectuses and summary prospectuses, which can be obtained from a financial professional and should be read carefully before investing.
Capital Group exchange-traded funds (ETFs) are actively managed and do not seek to replicate a specific index. ETF shares are bought and sold through an exchange at the then current market price, not net asset value (NAV), and are not individually redeemed from the fund. Shares may trade at a premium or discount to their NAV when traded on an exchange. Brokerage commissions will reduce returns. There can be no guarantee that an active market for ETFs will develop or be maintained, or that the ETF's listing will continue or remain unchanged.
Investing outside the United States involves risks, such as currency fluctuations, periods of illiquidity and price volatility. These risks may be heightened in connection with investments in developing countries.
Nondiversified funds have the ability to invest a larger percentage of assets in the securities of a smaller number of issuers than a diversified fund. As a result, poor results by a single issuer could adversely affect fund results more than if the fund invested in a larger number of issuers. See the applicable prospectus for details.
There have been periods when the results lagged the index(es) and/or average(s). The indexes are unmanaged and, therefore, have no expenses. Investors cannot invest directly in an index.
The MSCI information may only be used for your internal use, may not be reproduced or redisseminated in any form and may not be used as a basis for or a component of any financial instruments or products or indices. None of the MSCI information is intended to constitute investment advice or a recommendation to make (or refrain from making) any kind of investment decision and may not be relied on as such. Historical data and analysis should not be taken as an indication or guarantee of any future performance analysis, forecast or prediction. The MSCI information is provided on an “as is” basis and the user of this information assumes the entire risk of any use made of this information. MSCI, each of its affiliates and each other person involved in or related to compiling, computing or creating any MSCI information (collectively, the “MSCI Parties”) expressly disclaims all warranties (including, without limitation, any warranties of originality, accuracy, completeness, timeliness, non-infringement, merchantability and fitness for a particular purpose) with respect to this information. Without limiting any of the foregoing, in no event shall any MSCI Party have any liability for any direct, indirect, special, incidental, punitive, consequential (including, without limitation, lost profits) or any other damages. Please visit the data provider's website for more information.
All Capital Group trademarks mentioned are owned by The Capital Group Companies, Inc., an affiliated company or fund. All other company and product names mentioned are the property of their respective companies.
Portfolios are managed, so holdings will change. Certain fixed income and/or cash and equivalents holdings may be held through mutual funds managed by the investment adviser or its affiliates that are not offered to the public.
Totals may not reconcile due to rounding and/or cash flows.
Use of this website is intended for U.S. residents only. Use of our website and materials is subject to approval by your home office.
Capital Client Group, Inc.
This content, developed by Capital Group, home of American Funds, should not be used as a primary basis for investment decisions and is not intended to serve as impartial investment or fiduciary advice.
© 2026 Morningstar, Inc. All rights reserved. The information contained herein: (1) is proprietary to Morningstar and/or its content providers; (2) may not be copied or distributed; and (3) is not warranted to be accurate, complete or timely. Neither Morningstar, its content providers nor Capital Group are responsible for any damages or losses arising from any use of this information. Past performance is no guarantee of future results. Information is calculated by Morningstar. When applicable, due to differing calculation methods, the figures shown here may differ from those calculated by Capital Group.

MSCI All Country World Index ex USA is a free-float-adjusted market-capitalization-weighted index that is designed to measure equity market results in the global developed and emerging markets, excluding the United States. The index consists of more than 40 developed- and emerging-market country indexes.


ETF market price returns since inception are calculated using NAV for the period until market price became available (generally a few days after inception).


When applicable, results reflect fee waivers and/or expense reimbursements, without which they would have been lower. Please see capitalgroup.com for more information.
