Equity Market Commentary Q2
Semiconductors fueled wide dispersion amid AI dominance
David Polak
Equity investment director
Mike Pollgreen
Equity investment director
Key takeaways for the quarter ended June 30, 2026:
- Global markets staged a powerful comeback against first-quarter declines with lesser known names posting strong returns, which suggests stock selection may be an important driver of returns.
- Within the S&P 500 Index, strong returns from industrials, consumer discretionary and financials indicate a broadening beyond artificial intelligence themes.
- International equities rallied with emerging markets leading the way and strong results from small- and mid-cap companies, further indicating more opportunities for diversification.
Global equity markets staged a powerful recovery, more than reversing the first quarter's decline. The defining feature was not a simple rotation back into growth-oriented sectors but the dominance of a single theme — the artificial intelligence (AI) buildout and the semiconductors and memory chips that power it. What defined the quarter was the dispersion between the “spenders” on AI capex and its “receivers.” The receivers — chipmakers, memory producers and equipment suppliers — led, and they led in every major market globally.
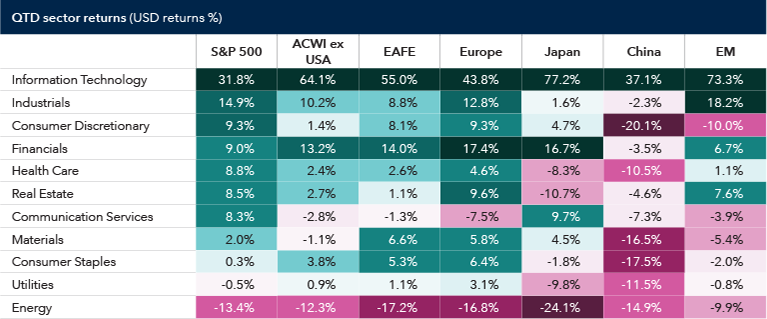
Within the U.S. large-cap market, dispersion was unusually wide. Semiconductors and semiconductor-equipment companies posted the strongest gains by far, and information technology returned 31.8% — the only sector to outpace the S&P 500 Index, which returned 15.2%. Energy was the only declining sector as the Iran-related risk premium unwound, with most other sectors landing well in between.
2026 Q2 returns by sector
Sources: Capital Group, Bloomberg Index Services, Ltd., MSCI, RIMES, Standard & Poor’s.
Lower-quality memory producers in the semiconductor industry outpaced the leading names signaling that security selection drove returns, not style or quality. The Russell 1000 Growth Index rose 16.8% quarter to date against 13.9% for Russell 1000 Value Index, and that relatively narrow gap is itself telling. As the technology sector grows to dominate more of the value index, the same AI leadership shows up on both sides of the style divide.
Beyond AI themes, strong returns from industrials, consumer discretionary and financials point to a genuine broadening in the S&P 500.
Outside of the U.S., headline indexes showed rebounds over the first quarter. The MSCI Emerging Markets (EM) Index rose 24.1%, the MSCI All Country World Index (ACWI) ex USA gained 14.5% and the MSCI EAFE (Europe, Australasia, Far East) Index finished up 10.9% — all on a quarter-to-date basis. Small- and mid-cap stocks (SMID-caps) also fared well globally, with the Russell 2500 Index, which tracks the SMID-cap universe, advancing 20.3%. Small caps alone also fared well as reflected in the MSCI ACWI Small Cap Index, which advanced 14.9% quarter to date.
Equity-focused strategies
The second quarter's narrow, semiconductor-led leadership was again decisive. Strategies exposed to the winners fared well, particularly those willing to hold the most volatile gainers, while strategies anchored in quality and dividends tended to participate in the rally but trailed the broader indexes.
Of the 36 Capital Group equity-focused mutual funds and ETFs, 16 outpaced their benchmarks in the quarter with 19 of 36 ranking above the median against peers. Year-to-date peer ranks are similar, with 15 out of 36 funds in the top half, as a strong second quarter offset a weaker previous quarter.
U.S.-focused strategies
Growth strategies were among the chief beneficiaries of the quarter's leadership, as their technology and AI exposure aligned with where returns were concentrated.
- The Growth Fund of America® gained approximately 19%, leading the S&P 500 by roughly 390 basis points (bps) and beating the peer median on investment decisions in information technology.
- CGGR – Capital Group Growth ETF advanced approximately 18%, supported by semiconductors and AI beneficiaries.
- CGMM – Capital Group U.S. Small and Mid Cap ETF returned about 12% but trailed the Russell 2500 Index by roughly 790 bps on its lighter relative exposure to memory and semiconductors.
As growth themes dominated, little premium was placed on quality or dividends. Certain growth-and-income funds trailed the S&P 500 despite solid absolute returns.
- American Mutual Fund® returned about 10% and trailed the S&P 500 by roughly 480 bps. This was somewhat expected as the fund emphasizes quality companies that pay a dividend. It was built for defensive markets and growth is not its only objective.
- CGDV – Capital Group Dividend Value ETF stood out in the growth-and-income suite, up approximately 16% and landing roughly 110 bps ahead of the S&P 500. Its concentrated portfolio of roughly 50 holdings and flexible approach targets both growth and income.
- Fundamental Investors® similarly benefited from flexibility, outpacing the S&P 500 by roughly 360 bps and ranking near the top of its peer group.
International and global strategies
Overseas, the same dynamic between spenders and receivers played out. The MSCI EM Index's headline gain of about 24% masked sharp divergence within the index, as China and Brazil declined while Korea surged amid a boom in select memory chipmakers.
- CGXU – Capital Group International Focus Equity ETF produced the best results in our international lineup. Its targeted exposure to key AI beneficiaries propelled its top quartile, benchmark-beating results.
- EUPAC FundTM finished just ahead of the MSCI ACWI ex USA Index, with emphasis on similar AI themes, albeit less pronounced.
- CGGO – Capital Group Global Growth Equity ETF finished up 27% in the quarter and 22% year-to-date. It ranked in the top decile against peers in both periods as the fund benefited from a tilt toward AI spending receivers.
- New World Fund® advanced, but its domestic market exposure was a drag in an otherwise strong quarter for emerging markets.
- American Funds® International Vantage Fund seeks capital preservation as part of its objective, which made it challenging to hold some of the more volatile companies that led the market in the quarter.
- CGDG – Capital Group Dividend Growers ETF produced the weakest relative result from our suite after posting a strong first quarter. Its first-quarter energy leaders became the largest drag as the sector reversed, and its dividend focus lagged a risk-on tape.
Longer term perspective
As Capital Group’s chief investment officer, Martin Romo, pointed out: We are in a unique market moment with a strong case for active judgment because passive allocations are not striving to outpace their benchmarks —only replicate its return patterns. As a result, they do not factor in valuation risk, position sizes or change in fundamentals.
As market leadership evolves, with today’s leaders often becoming tomorrow’s laggards, Capital Group’s role is not to simply replicate benchmarks, but to use judgment and conviction to deliver strong results over the long term.
Mutual fund and ETF rankings are based on total return. ETF returns are based on net asset value (NAV) and those are used to determine the rankings.
-
-
1 year
Fund Total Return Percentile Peers Morningstar Category AMCAP Fund 15.4% 58th 1060 Large Growth American Balanced Fund 20.9% 7th 482 Moderate Allocation American Funds Developing World Growth and Income Fund 35.0% 69th 724 Diversified Emerging Markets American Funds Global Balanced Fund 13.4% 85th 409 Global Moderate Allocation American Funds Global Insight Fund 20.8% 52nd 324 Global Large-Stock Blend American Funds International Vantage Fund 13.6% 45th 374 Foreign Large Growth American Mutual Fund 16.8% 76th 1106 Large Value American Funds U.S. Small and Mid Cap Equity Fund 21.0% 63rd 414 Mid-Cap Blend CGBL — Capital Group Core Balanced ETF 15.9% 32nd 482 Moderate Allocation CGCV — Capital Group Conservative Equity ETF 16.6% 77th 1106 Large Value CGDG — Capital Group Dividend Growers ETF 14.3% 74th 324 Global Large-Stock Blend CGDV — Capital Group Dividend Value ETF 26.5% 22nd 1106 Large Value CGGE — Capital Group Global Equity ETF 21.2% 49th 324 Global Large-Stock Blend CGGG — Capital Group U.S. Large Growth ETF 9.4% 78th 1060 Large Growth CGGO — Capital Group Global Growth Equity ETF 33.8% 9th 300 Global Large-Stock Growth CGGR — Capital Group Growth ETF 16.2% 54th 1060 Large Growth CGIC — Capital Group International Core Equity ETF 27.0% 24th 676 Foreign Large Blend CGIE — Capital Group International Equity ETF 12.8% 49th 374 Foreign Large Growth CGMM — Capital Group US Small and Mid Cap ETF 23.1% 50th 414 Mid-Cap Blend CGNG — Capital Group New Geography Equity ETF 30.3% 75th 724 Diversified Emerging Markets CGUS — Capital Group Core Equity ETF 21.6% 49th 1306 Large Blend CGVV — Capital Group U.S. Large Value ETF 22.4% 43rd 1106 Large Blend CGXU — Capital Group International Focus Equity ETF 33.6% 8th 374 Foreign Large Growth Capital Income Builder 16.0% 83rd 175 Global Moderately Aggressive Allocation Capital World Growth and Income Fund 27.5% 11th 324 Global Large-Stock Blend EUPAC Fund 23.6% 16th 374 Foreign Large Growth Fundamental Investors 27.9% 10th 1306 Large Blend International Growth and Income Fund 25.5% 28th 676 Foreign Large Blend New Perspective Fund 15.7% 43rd 300 Global Large-Stock Growth New World Fund 29.6% 77th 724 Diversified Emerging Markets SMALLCAP World Fund 24.8% 40th 162 Global Small/Mid Stock The Growth Fund of America 19.1% 39th 1060 Large Growth The Income Fund of America 13.1% 87th 409 Global Moderate Allocation The Investment Company of America 19.6% 59th 1306 Large Blend The New Economy Fund 46.3% 2nd 300 Global Large-Stock Growth Washington Mutual Investors Fund 15.6% 80th 1106 Large Value -
5 years
Fund Total Return Percentile Peers Morningstar Category AMCAP Fund 9.2% 69th 928 Large Growth American Balanced Fund 9.9% 2nd 440 Moderate Allocation American Funds Developing World Growth and Income Fund 5.7% 70th 626 Diversified Emerging Markets American Funds Global Balanced Fund 6.0% 55th 389 Global Moderate Allocation American Funds Global Insight Fund 9.5% 50th 287 Global Large-Stock Blend American Funds International Vantage Fund 6.5% 27th 333 Foreign Large Growth American Mutual Fund 11.1% 41st 991 Large Value American Funds U.S. Small and Mid Cap Equity Fund - - - Mid-Cap Blend CGBL — Capital Group Core Balanced ETF - - - Moderate Allocation CGCV — Capital Group Conservative Equity ETF - - - Large Value CGDG — Capital Group Dividend Growers ETF - - - Global Large-Stock Blend CGDV — Capital Group Dividend Value ETF - - - Large Value CGGE — Capital Group Global Equity ETF - - - Global Large-Stock Blend CGGG — Capital Group U.S. Large Growth ETF - - - Large Growth CGGO — Capital Group Global Growth Equity ETF - - - Global Large-Stock Growth CGGR — Capital Group Growth ETF - - - Large Growth CGIC — Capital Group International Core Equity ETF - - - Foreign Large Blend CGIE — Capital Group International Equity ETF - - - Foreign Large Growth CGMM — Capital Group US Small and Mid Cap ETF - - - Mid-Cap Blend CGNG — Capital Group New Geography Equity ETF - - - Diversified Emerging Markets CGUS — Capital Group Core Equity ETF - - - Large Blend CGVV — Capital Group U.S. Large Value ETF - - - Large Value CGXU — Capital Group International Focus Equity ETF - - - Foreign Large Growth Capital Income Builder 8.9% 21st 168 Global Moderately Aggressive Allocation Capital World Growth and Income Fund 11.4% 16th 287 Global Large-Stock Blend EUPAC Fund 5.4% 40th 333 Foreign Large Growth Fundamental Investors 14.8% 7th 1123 Large Blend International Growth and Income Fund 9.1% 37th 606 Foreign Large Blend New Perspective Fund 8.5% 32nd 274 Global Large-Stock Growth New World Fund 6.7% 57th 626 Diversified Emerging Markets SMALLCAP World Fund 2.8% 47th 143 Global Small/Mid Stock The Growth Fund of America 11.7% 41st 928 Large Growth The Income Fund of America 8.3% 13th 389 Global Moderate Allocation The Investment Company of America 14.7% 8th 1123 Large Blend The New Economy Fund 13.7% 1st 274 Global Large-Stock Growth Washington Mutual Investors Fund 12.5% 15th 991 Large Value -
10 years
Fund Total Return Percentile Peers Morningstar Category AMCAP Fund 13.3% 89th 751 Large Growth American Balanced Fund 10.6% 9th 375 Moderate Allocation American Funds Developing World Growth and Income Fund 8.1% 79th 464 Diversified Emerging Markets American Funds Global Balanced Fund 7.2% 66th 323 Global Moderate Allocation American Funds Global Insight Fund 12.2% 37th 211 Global Large-Stock Blend American Funds International Vantage Fund 9.6% 37th 223 Foreign Large Growth American Mutual Fund 11.6% 49th 830 Large Value American Funds U.S. Small and Mid Cap Equity Fund - - - Mid-Cap Blend CGBL — Capital Group Core Balanced ETF - - - Moderate Allocation CGCV — Capital Group Conservative Equity ETF - - - Large Value CGDG — Capital Group Dividend Growers ETF - - - Global Large-Stock Blend CGDV — Capital Group Dividend Value ETF - - - Large Value CGGE — Capital Group Global Equity ETF - - - Global Large-Stock Blend CGGG — Capital Group U.S. Large Growth ETF - - - Large Growth CGGO — Capital Group Global Growth Equity ETF - - - Global Large-Stock Growth CGGR — Capital Group Growth ETF - - - Large Growth CGIC — Capital Group International Core Equity ETF - - - Foreign Large Blend CGIE — Capital Group International Equity ETF - - - Foreign Large Growth CGMM — Capital Group US Small and Mid Cap ETF - - - Mid-Cap Blend CGNG — Capital Group New Geography Equity ETF - - - Diversified Emerging Markets CGUS — Capital Group Core Equity ETF - - - Large Blend CGVV — Capital Group U.S. Large Value ETF - - - Large Value CGXU — Capital Group International Focus Equity ETF - - - Foreign Large Growth Capital Income Builder 8.1% 87th 141 Global Moderately Aggressive Allocation Capital World Growth and Income Fund 12.5% 28th 211 Global Large-Stock Blend EUPAC Fund 9.8% 30th 223 Foreign Large Growth Fundamental Investors 15.5% 18th 889 Large Blend International Growth and Income Fund 10.1% 32nd 479 Foreign Large Blend New Perspective Fund 13.9% 26th 201 Global Large-Stock Growth New World Fund 11.2% 15th 464 Diversified Emerging Markets SMALLCAP World Fund 10.9% 20th 90 Global Small/Mid Stock The Growth Fund of America 16.4% 48th 751 Large Growth The Income Fund of America 8.8% 13th 323 Global Moderate Allocation The Investment Company of America 14.6% 47th 889 Large Blend The New Economy Fund 17.1% 2nd 201 Global Large-Stock Growth Washington Mutual Investors Fund 13.6% 11th 830 Large Value
-
Source: Capital Group, based on Morningstar data as of June 30, 2026. The Morningstar rankings do not reflect the effects of sales charges, account fees or taxes. When applicable, results reflect fee waivers and/or expense reimbursements, without which they would have been lower. Please see capitalgroup.com for more information. Past results are no guarantee of results in future periods. While American Funds mutual funds class F-2 shares do not include fees for advisor compensation and service provider payments, the share classes represented in the Morningstar category have varying fee structures and can include these and other fees and charges, resulting in higher expenses.
Fund results and analysis
Fund results and analysis
Index comparisons:
The 21 equity-focused American Funds and their primary benchmarks in the results are as follows, unless otherwise indicated: AMCAP Fund®, American Mutual Fund®, Fundamental Investors®, The Growth Fund of America®, The Investment Company of America® and Washington Mutual Investors Fund (S&P 500 Index); American Balanced Fund® (60% S&P 500 Index and 40% Bloomberg U.S. Aggregate Index); American Funds® Global Balanced Fund (60% MSCI All Country World Index and 40% Bloomberg Global Aggregate Index); Capital Income Builder® (70%/30% MSCI All Country World Index/Bloomberg U.S. Aggregate Index); The Income Fund of America® (65%/35% S&P 500 Index/Bloomberg U.S. Aggregate Index); Capital World Growth and Income Fund®, The New Economy Fund®, New Perspective Fund® and New World Fund® (MSCI All Country World Index); American Funds® Developing World Growth and Income Fund (MSCI Emerging Markets Index); EUPAC FundTM and International Growth and Income Fund (MSCI All Country World ex USA Index); SMALLCAP World Fund® (MSCI All Country World Small Cap Index); American Funds® International Vantage Fund (MSCI EAFE [Europe, Australasia, Far East] Index); American Funds® Global Insight Fund (MSCI World Index); American Funds® U.S. Small and Mid Cap Equity Fund (Russell 2500 Index).
The 15 Capital Group equity-focused ETFs and their primary benchmarks in the results are as follows: CGDG — Capital Group Dividend Growers ETF, CGGO — Capital Group Global Growth Equity ETF, CGNG — Capital Group New Geography Equity ETF (MSCI All Country World Index); CGIE — Capital Group International Equity ETF (MSCI EAFE [Europe, Australasia, Far East] Index); CGUS — Capital Group Core Equity ETF, CGGR — Capital Group Growth ETF, CGDV — Capital Group Dividend Value ETF, CGCV — Capital Group Conservative Equity ETF (S&P 500 Index); CGXU — Capital Group International Focus Equity ETF, CGIC — Capital Group International Core Equity ETF (MSCI All Country World ex USA Index); CGGE — Capital Group Global Equity ETF (MSCI World Index); CGBL — Capital Group Core Balanced ETF (60%/40% S&P 500 Index/Bloomberg U.S. Aggregate Index); CGGG — Capital Group U.S. Large Growth ETF (Russell 1000 Growth Index); CGMM — Capital Group U.S. Small and Mid Cap ETF (Russell 2500 Index); CGVV — Capital Group U.S. Large Value ETF (Russell 1000 Value Index).
Figures shown are past results and are not predictive of results in future periods. Current and future results may be lower or higher than those shown. Investing for short periods makes losses more likely. Prices and returns will vary, so investors may lose money. View ETF expense ratios and returns. View mutual fund expense ratios and returns for F-2 share class and R-6 share class.
For Capital Group ETFs, market price returns are determined using the official closing price of the fund's shares and do not represent the returns you would receive if you traded shares at other times.
Investments are not FDIC-insured, nor are they deposits of or guaranteed by a bank or any other entity, so they may lose value.
Investors should carefully consider investment objectives, risks, charges and expenses. This and other important information is contained in the ETF prospectuses and summary prospectuses and in the mutual fund prospectuses and summary prospectuses, which can be obtained from a financial professional and should be read carefully before investing.
Capital Group exchange-traded funds (ETFs) are actively managed and do not seek to replicate a specific index. ETF shares are bought and sold through an exchange at the then current market price, not net asset value (NAV), and are not individually redeemed from the fund. Shares may trade at a premium or discount to their NAV when traded on an exchange. Brokerage commissions will reduce returns. There can be no guarantee that an active market for ETFs will develop or be maintained, or that the ETF's listing will continue or remain unchanged.
Investing outside the United States involves risks, such as currency fluctuations, periods of illiquidity and price volatility. These risks may be heightened in connection with investments in developing countries. (Also applies to CGGR, CGDV, CGXU, CGGO and CGDG).
Nondiversified funds have the ability to invest a larger percentage of assets in the securities of a smaller number of issuers than a diversified fund. As a result, poor results by a single issuer could adversely affect fund results more than if the fund invested in a larger number of issuers. See the applicable prospectus for details. (Also applies to CGGR, CGMM and CGDG).
The return of principal for bond portfolios and portfolios with significant underlying bond holdings is not guaranteed. Investments are subject to the same interest rate, inflation and credit risks associated with the underlying bond holdings.
Lower rated bonds are subject to greater fluctuations in value and risk of loss of income and principal than higher rated bonds.
Smaller company stocks entail additional risks, and they can fluctuate in price more than larger company stocks.
There have been periods when the results lagged the index(es) and/or average(s). The indexes are unmanaged and, therefore, have no expenses. Investors cannot invest directly in an index.
FTSE/Russell indexes: London Stock Exchange Group plc and its group undertakings (collectively, the “LSE Group”). © LSE Group 2026. FTSE Russell is a trading name of certain of the LSE Group companies. FTSE indexes are trademarks of the relevant LSE Group companies and are used by any other LSE Group company under license. All rights in the FTSE Russell indexes or data vest in the relevant LSE Group company which owns the index or the data. Neither LSE Group nor its licensors accept any liability for any errors or omissions in the indexes or data and no party may rely on any indexes or data contained in this communication. No further distribution of data from the LSE Group is permitted without the relevant LSE Group company's express written consent. The LSE Group does not promote, sponsor or endorse the content of this communication.
Each S&P Index ("Index") shown is a product of S&P Dow Jones Indices LLC and/or its affiliates and has been licensed for use by Capital Group. Copyright © 2026 S&P Dow Jones Indices LLC, a division of S&P Global, and/or its affiliates. All rights reserved. Redistribution or reproduction in whole or in part is prohibited without written permission of S&P Dow Jones Indices LLC.
MSCI has not approved, reviewed or produced this report, makes no express or implied warranties or representations and is not liable whatsoever for any data in the report. You may not redistribute the MSCI data or use it as a basis for other indices or investment products.
When applicable, results reflect fee waivers and/or expense reimbursements, without which they would have been lower
All Capital Group trademarks mentioned are owned by The Capital Group Companies, Inc., an affiliated company or fund. All other company and product names mentioned are the property of their respective companies.
Statements attributed to an individual represent the opinions of that individual as of the date published and do not necessarily reflect the opinions of Capital Group or its affiliates. This information is intended to highlight issues and should not be considered advice, an endorsement or a recommendation.
Use of this website is intended for U.S. residents only. Use of this website and materials is also subject to approval by your home office.
Capital Client Group, Inc.
This content, developed by Capital Group, home of American Funds, should not be used as a primary basis for investment decisions and is not intended to serve as impartial investment or fiduciary advice.
© 2026 Morningstar, Inc. All rights reserved. The information contained herein: (1) is proprietary to Morningstar and/or its content providers; (2) may not be copied or distributed; and (3) is not warranted to be accurate, complete or timely. Neither Morningstar, its content providers nor Capital Group are responsible for any damages or losses arising from any use of this information. Past performance is no guarantee of future results. Information is calculated by Morningstar. When applicable, due to differing calculation methods, the figures shown here may differ from those calculated by Capital Group.
60%/40% MSCI All Country World Index/Bloomberg Global Aggregate Index blends the MSCI All Country World Index with the Bloomberg Global Aggregate Index by weighting their cumulative total returns at 60% and 40%, respectively. The blend is rebalanced monthly. MSCI All Country World Index is a free-float-adjusted market-capitalization-weighted index that is designed to measure equity market results in the global developed and emerging markets, consisting of more than 40 developed- and emerging-markets country indexes. Results reflect dividends gross of withholding taxes through December 31, 2000, and dividends net of withholding taxes thereafter. Bloomberg Global Aggregate Index represents the global investment-grade fixed income markets. The indexes are unmanaged, and results include reinvested distributions but do not reflect the effect of sales charges, commissions, account fees, expenses or U.S. federal income taxes.
60%/40% S&P 500 Index/Bloomberg U.S. Aggregate Index blends the S&P 500 with the Bloomberg U.S. Aggregate Index by weighting their cumulative total returns at 60% and 40%, respectively. The blend is rebalanced monthly. S&P 500 Index is a market- capitalization-weighted index based on the results of approximately 500 widely held common stocks. Bloomberg U.S. Aggregate Index represents the U.S. investment-grade fixed-rate bond market. The indexes are unmanaged, and results include reinvested distributions but do not reflect the effect of sales charges, commissions, account fees, expenses or U.S. federal income taxes.
65%/35% S&P 500 Index/Bloomberg U.S. Aggregate Index blends the S&P 500 with the Bloomberg U.S. Aggregate Index by weighting their cumulative total returns at 65% and 35%, respectively. The blend is rebalanced monthly. S&P 500 Index is a market-capitalization-weighted index based on the results of approximately 500 widely held common stocks. Bloomberg U.S. Aggregate Index represents the U.S. investment-grade fixed-rate bond market. The indexes are unmanaged, and results include reinvested distributions but do not reflect the effect of sales charges, commissions, account fees, expenses or U.S. federal income taxes.
70%/30% MSCI All Country World Index/Bloomberg U.S. Aggregate Index blends the MSCI All Country World Index with the Bloomberg U.S. Aggregate Index by weighting their total returns at 70% and 30%, respectively. The blend is rebalanced monthly. MSCI All Country World Index is a free-float-adjusted market-capitalization-weighted index that is designed to measure equity market results in the global developed and emerging markets, consisting of more than 40 developed- and emerging-markets country indexes. Results reflect dividends gross of withholding taxes through December 31, 2000, and dividends net of withholding taxes thereafter. Bloomberg U.S. Aggregate Index represents the U.S. investment-grade fixed-rate bond market. The indexes are unmanaged, and results include reinvested distributions but do not reflect the effect of sales charges, commissions, account fees, expenses or U.S. federal income taxes.
MSCI All Country World ex USA Index is a free-float-adjusted market-capitalization-weighted index that is designed to measure equity market results in the global developed and emerging markets, excluding the United States. The index consists of more than 40 developed- and emerging-markets country indexes. Results reflect dividends gross of withholding taxes through December 31, 2000, and dividends net of withholding taxes thereafter. This index is unmanaged, and its results include reinvested dividends and/or distributions but do not reflect the effect of sales charges, commissions, account fees, expenses or U.S. federal income taxes.
MSCI All Country World Small Cap Index is a free-float-adjusted market-capitalization-weighted index that is designed to measure equity market results of smaller capitalization companies in both developed and emerging markets. Results reflect dividends net of withholding taxes. This index is unmanaged, and its results include reinvested dividends and/or distributions but do not reflect the effect of sales charges, commissions, account fees, expenses or U.S. federal income taxes.
MSCI All Country World Index (ACWI) is a free-float-adjusted market-capitalization-weighted index that is designed to measure equity market results in the global developed and emerging markets, consisting of more than 40 developed- and emerging-markets country indexes.
MSCI EAFE® (Europe, Australasia, Far East) Index is a free-float-adjusted market-capitalization-weighted index that is designed to measure developed equity market results, excluding the United States and Canada. Results reflect dividends net of withholding taxes. This index is unmanaged, and its results include reinvested dividends and/or distributions but do not reflect the effect of sales charges, commissions, account fees, expenses or U.S. federal income taxes.
MSCI Emerging Markets Index is a free-float-adjusted market-capitalization-weighted index that is designed to measure equity market results in the global emerging markets, consisting of more than 20 emerging-markets country indexes. Results reflect dividends gross of withholding taxes through December 31, 2000, and dividends net of withholding taxes thereafter. This index is unmanaged, and its results include reinvested dividends and/or distributions but do not reflect the effect of sales charges, commissions, account fees, expenses or U.S. federal income taxes.
MSCI World Index is a free-float-adjusted market-capitalization-weighted index that is designed to measure equity market results of developed markets. The index consists of more than 20 developed market country indexes, including the United States. Results reflect dividends net of withholding taxes. This index is unmanaged, and its results include reinvested dividends and/or distributions but do not reflect the effect of sales charges, commissions, account fees, expenses or U.S. federal income taxes.
Russell 1000® Growth Index measures the performance of the large-cap growth segment of the US equity universe. It includes those Russell 1000 companies with relatively higher price-to-book ratios, higher I/B/E/S forecast medium term (2 year) growth and higher sales per share historical growth (5 years). The Russell 1000® Growth Index is constructed to provide a comprehensive and unbiased barometer for the large-cap growth segment. The index is completely reconstituted annually to ensure new and growing equities are included and that the represented companies continue to reflect growth characteristics. S&P 500 Index is a market capitalization-weighted index based on the average weighted results of approximately 500 widely held common stocks.
Russell 1000 Value Index is a market capitalization-weighted index that represents the large-cap value segment of the U.S. equity market and includes stocks from the Russell 1000 Index that have lower price-to-book ratios and lower expected growth values. This index is unmanaged, and its results include reinvested dividends and/or distributions but do not reflect the effect of sales charges, commissions, account fees, expenses or U.S. federal income taxes.
Russell 2500 Index measures the results of the small to mid-cap segment of the US equity universe, commonly referred to as "SMID" cap. The Russell 2500 Index is a subset of the Russell 3000 Index. It includes approximately 2500 of the smallest securities based on a combination of their market cap and current index membership. This index is unmanaged, and its results include reinvested dividends and/or distributions but do not reflect the effect of sales charges, commissions, account fees, expenses or U.S. federal income taxes.
S&P 500 Index is a market-capitalization-weighted index based on the results of approximately 500 widely held common stocks. This index is unmanaged, and its results include reinvested dividends and/or distributions but do not reflect the effect of sales charges, commissions, account fees, expenses or U.S. federal income taxes.