Outlook Stock market outlook: 3 themes for the second half of 2026

KEY TAKEAWAYS

  • Earnings growth, not sentiment, is driving markets.
  • The multiyear AI investment cycle is fueling growth across sectors, especially the “physical economy.”
  • Non-U.S. markets offer attractive valuations and strong earnings potential relative to the U.S.

If you take your cues from the daily news headlines, you can find any number of reasons to feel squeamish about the stock market.


Those feelings may be misplaced, however. Thus far in 2026, stock markets have reached a series of new highs amid wars in the Middle East and Ukraine, fluctuating oil prices and elevated inflation. Why have stock markets shown such strength? It largely comes down to a simple yet critical factor: Corporate earnings are on a tear.


The artificial intelligence juggernaut accounts for much of the good news. Aggressive spending by technology companies has translated into revenue and earnings growth for companies across sectors. But there’s much more to the story than AI growth. Banks are capitalizing on higher interest rates, innovative therapies are driving sales growth in healthcare, and higher crude oil prices are pumping up energy companies. Looking forward, consensus earnings estimates reflect continued strength, particularly in emerging markets, where they are expected to soar 49.2% by year’s end.

Robust earnings growth is not just a U.S. phenomenon

A series of vertical bars shows annual earnings growth for 2025 and estimates for 2026 across the United States, Europe, Japan, Emerging markets and China. Estimates for 2026 range from 49.2% earnings growth for emerging markets to 5.2% for China.

Sources: Capital Group, FactSet, MSCI, S&P Global. Estimated annual earnings growth is represented by the mean industry analyst consensus earnings per share estimates for the year ending December 2026 across the S&P 500 Index (U.S.), the MSCI Europe Index (Europe), the MSCI Japan Index (Japan), the MSCI EM Index (Emerging markets) and MSCI China Index (China). Earnings growth represented in USD. Estimates are as of May 31, 2026.

“When I look at the market going forward, the key element is this underpinning of strong corporate earnings,” says Rob Lovelace, Chair of Capital International, Inc. and an equity portfolio manager for New Perspective Fund®. “This growth has been evident for the last three years, and it doesn’t look like it’s slowing down.”


Here are three equity market themes we are focused on for the remainder of 2026 and beyond.

2026 Midyear Outlook webinar

Thursday, June 25 | 11 AM PT/2 PM ET

CE credit available

1. The AI freight train shows no signs of slowing

In the race for AI supremacy, five hyperscalers — Amazon, Alphabet, Meta, Microsoft and Oracle — have committed to investing $650 billion this year on data centers, a historic level of spending that doesn’t appear to be slowing. “These investments are being led by some of the most profitable companies the world has seen,” says equity portfolio manager Mark Casey. “As long as the technology keeps advancing, I expect they’ll continue to invest.”


Indeed, total global investment in AI infrastructure and AI-related products could reach $30 trillion over the next decade, eclipsing China’s industrial boom of the early 2000s, considered by many to be the largest in modern history. That boom reshaped global trade, labor markets and politics, suggesting AI may be much bigger than a sector story.


“In the first half of the year, the Iran war seemed to block out the sun,” says Mark Casey, equity portfolio manager for CGGR — Capital Group Growth ETF. “But I think AI still is the sun in the sense that it is potentially the highest impact technology in a generation and the most significant force in the economy.”


All this spending has translated into soaring demand for advanced semiconductor makers like NVIDIA and Broadcom as well as semiconductor foundries like Taiwan Semiconductor Manufacturing Company (TSMC) and networking companies like Cisco Systems, for example.


With technology advancing so rapidly and the build-out likely stretching years into the future, the epicenter of demand could shift among various hardware suppliers. That’s why selective investing is essential, Casey adds.

2. Look beyond U.S. borders for magnificence

Think the AI story is the exclusive domain of U.S. tech giants? Think again.


Just as the Magnificent Seven have led U.S. markets, seven companies that play a key role in the AI revolution are also dominating emerging markets. TSMC, Samsung Electronics and SK hynix are common names, but lesser-known companies MediaTek and Delta Electronics are also asserting leadership. Tencent and Alibaba have access to the largest market in the world by operating in China.

As in the U.S., seven tech stocks have dominated emerging markets

A chart compares market capitalizations and forward price-to-earnings ratios of the U.S. Magnificent Seven stocks with those of the seven largest stocks in emerging markets. The emerging markets companies are generally smaller, with lower valuations than their U.S. counterparts.

Sources: Capital Group, MSCI, RIMES, FactSet. Emergent Seven represents the seven largest companies in the MSCI Emerging Markets Index: Taiwan Semiconductor Manufacturing, Samsung Electronics, SK Hynix, Tencent, Alibaba, MediaTek and Delta Electronics. The Magnificent Seven refers to a group of seven dominant U.S.-based technology companies: Alphabet, Amazon, Apple, Meta Platforms, Microsoft, NVIDIA and Tesla. The forward 12-month price-to-earnings (P/E) ratio divides the current share price of a company by the estimated future earnings per share of that company. Tesla’s forward 12-month P/E of 220x places it outside of the graph axis and is thus excluded above. As of May 31, 2026.

These seven tech and platform companies are the largest by market capitalization in the MSCI Emerging Markets Index, making up 33% of the index. At Capital we refer to them as the “Emergent” Seven. They generally have smaller market capitalizations and lower valuations than many of their U.S. counterparts, but they are generating earnings growth expectations beyond those for the S&P 500.


Investors focused on U.S. equities may not fully grasp the scope of these opportunities. “Now many global leaders in their industries can be found outside the United States,” says Steve Watson, equity portfolio manager for CGIC — Capital Group International Core Equity ETF.


More broadly, a powerful rally in emerging and developed non-U.S. markets that started in 2025 continues, driven by attractive valuations, a weak dollar and strong corporate earnings. Although U.S. stocks have narrowed the gap, Watson expects further opportunity in non-U.S. markets, citing as examples industry leaders like Airbus, ASML, AstraZeneca and Safran as headquartered beyond U.S. borders.

3. The physical economy is flexing its muscles

While AI may be the biggest driver of stock markets — after all, NVIDIA’s market capitalization alone has grown larger than three S&P 500 Index sectors — ignoring companies in the physical economy could be a mistake.

NVIDIA is larger than three S&P 500 Index sectors

A bar chart compares the market capitalization of NVIDIA with the combined market capitalization of the S&P 500 energy, utilities and materials sectors. NVIDIA's market cap of $5.1 trillion is larger than the combined market cap of $4.6 trillion of the three sectors.

Sources: Capital Group, S&P Global, FactSet, RIMES. As of May 31, 2026. Companies shown are the three largest in their respective sectors within the S&P 500 Index.

To begin with, AI can’t run without the physical economy. Demand for steel, copper, heavy construction services and power generation equipment is soaring in support of the data center build-out. For instance, sales in Caterpillar’s construction division jumped 38% in the first quarter. The company also reported an order backlog of $62.7 billion for power generation equipment.


“Pick-and-shovel companies, both the semiconductor supply chain and the infrastructure developers, are where I see the clearest opportunity,” says Chris Buchbinder, principal investment officer for CGDV — Capital Group Dividend Value ETF.


Others are attractive because they are unlikely to be disrupted by AI. “Consider, for example, Royal Caribbean. I don’t see AI replacing cruise ships,” Buchbinder explains. Another example is jet engine maker GE Aerospace, which entered the year with a $190 billion order backlog, driven by rising global demand for travel and greater defense spending.


In addition, investors concerned about rising risks may want to consider investing in some physical economy companies with a history of paying dividends. Many drugmakers, for example, generate healthy free cash flow that allows them to return capital to shareholders through dividends while strengthening their pipelines through targeted acquisitions. For example, pharmaceutical company AstraZeneca has a well-established range of oncology franchises. To drive future growth potential, it has assets targeting heart disease, chronic kidney conditions and metabolic disorders.

The bottom line for investors

To be sure, investors are confronted with risks heading into the back half of the year. Not least of them are soaring energy prices, elevated inflation and high valuations in certain sectors. But every year offers its own unique mix of risks and opportunities. Indeed, the market volatility immediately after the start of the Iran War in late February is a reminder that maintaining well-diversified, balanced portfolios is crucial in any market environment.

Chris Buchbinder is an equity portfolio manager with 30 years of investment industry experience (as of 12/31/2025). He holds a bachelor’s degree in economics and international relations from Brown University.

Mark Casey is an equity portfolio manager with 26 years of investment industry experience (as of 12/31/2025). He holds an MBA from Harvard and a bachelor’s degree from Yale. 

Rob Lovelace is an equity portfolio manager and chair of Capital International, Inc. He has 40 years of investment industry experience (as of 12/31/2025). He holds a bachelor’s degree in mineral economics from Princeton. He also holds the Chartered Financial Analyst® designation.

Steve Watson is an equity portfolio manager with 38 years of investment industry experience (as of 12/31/25). He has an MBA and an MA in French studies from New York University as well as a bachelor's degree from the University of Massachusetts.

Hyperscalers are large-scale cloud service providers that offer computing power and storage to organizations and individuals globally.


Investing outside the United States involves risks, such as currency fluctuations, periods of illiquidity and price volatility, as more fully described in the prospectus. These risks may be heightened in connection with investments in developing countries.


The market indexes are unmanaged and, therefore, have no expenses. Investors cannot invest directly in an index.


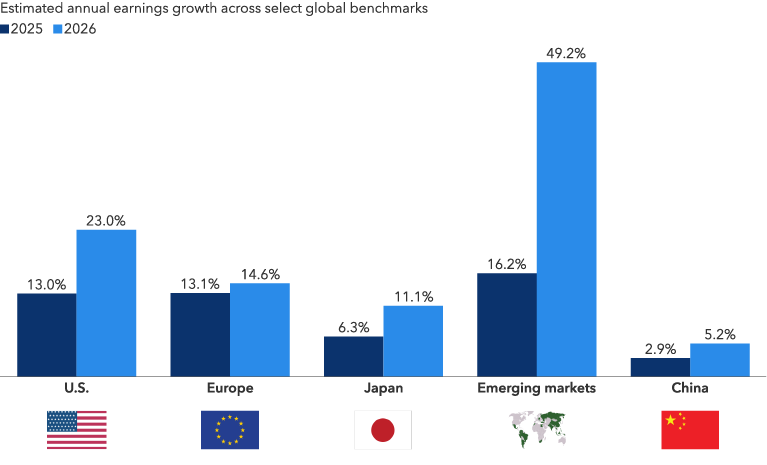
MSCI Emerging Markets Index captures large- and mid-cap representation across 24 emerging markets (EM) countries.


S&P 500 Index is a market capitalization-weighted index based on the results of approximately 500 widely held common stocks.


Source: MSCI. The MSCI information may only be used for your internal use, may not be reproduced or redisseminated in any form and may not be used as a basis for or a component of any financial instruments or products or indices. None of the MSCI information is intended to constitute investment advice or a recommendation to make (or refrain from making) any kind of investment decision and may not be relied on as such. Historical data and analysis should not be taken as an indication or guarantee of any future performance analysis, forecast or prediction. The MSCI information is provided on an “as is” basis and the user of this information assumes the entire risk of any use made of this information. MSCI, each of its affiliates and each other person involved in or related to compiling, computing or creating any MSCI information (collectively, the “MSCI Parties”) expressly disclaims all warranties (including, without limitation, any warranties of originality, accuracy, completeness, timeliness, non-infringement, merchantability and fitness for a particular purpose) with respect to this information. Without limiting any of the foregoing, in no event shall any MSCI Party have any liability for any direct, indirect, special, incidental, punitive, consequential (including, without limitation, lost profits) or any other damages. (www.msci.com)


The S&P 500 Index is a product of S&P Dow Jones Indices LLC and/or its affiliates and has been licensed for use by Capital Group. Copyright © 2026 S&P Dow Jones Indices LLC, a division of S&P Global, and/or its affiliates. All rights reserved. Redistribution or reproduction in whole or in part is prohibited without written permission of S&P Dow Jones Indices LLC.

Investments are not FDIC-insured, nor are they deposits of or guaranteed by a bank or any other entity, so they may lose value.
Investors should carefully consider investment objectives, risks, charges and expenses. This and other important information is contained in the mutual fund prospectuses and summary prospectuses, which can be obtained from a financial professional and should be read carefully before investing.
Statements attributed to an individual represent the opinions of that individual as of the date published and do not necessarily reflect the opinions of Capital Group or its affiliates. This information is intended to highlight issues and should not be considered advice, an endorsement or a recommendation.
All Capital Group trademarks mentioned are owned by The Capital Group Companies, Inc., an affiliated company or fund. All other company and product names mentioned are the property of their respective companies.
Use of this website is intended for U.S. residents only. Use of this website and materials is also subject to approval by your home office.
Capital Client Group, Inc.
This content, developed by Capital Group, home of American Funds, should not be used as a primary basis for investment decisions and is not intended to serve as impartial investment or fiduciary advice.