Portfolio Construction Seek broader diversification with active model portfolios

October 14, 2026

KEY TAKEAWAYS

  • Concentration risk has increased as market leadership narrows.
  • Active stock selection can provide a more targeted approach to diversification.
  • Model portfolios can tailor equity exposures to specific investor objectives.

Many investors could be less diversified than they expect, as market capitalization-weighted funds have become increasingly concentrated in the largest companies. The 10 biggest companies now make up nearly 40% of the S&P 500 Index, a level not seen since the mid-1960s. In addition, many of those names are tied to the same investment theme – artificial intelligence – leaving portfolios vulnerable to stacked risks.


Investors should evaluate the percentage of their holdings that are in a handful of AI-related companies and make certain that exposures are aligned to their portfolio objectives.


Capital Group’s model portfolios seek to address this risk through our two-layer approach to active management. This approach pairs a long-term strategic asset allocation by the Portfolio Solutions Committee with ongoing bottom-up security selection based on fundamental research by the underlying fund managers. Models are managed to specific investment objectives that influence what types of equities are held. Put simply, income-oriented investors may need a different equity portfolio than investors focused on growth – and our models are designed to reflect that.
Portfolios should “pick their spots”

The underlying funds in our model portfolios are selective in their positioning within the 10 largest stocks in their benchmarks. Our model portfolios reflect the underlying portfolio managers and CG analysts’ highest convictions – holding greater-than-index exposure in some companies and less in others.

Consider models with active underlying funds that can pick their spots

Capital Group model portfolios’ relative weight to their benchmarks’ top-10 holdings
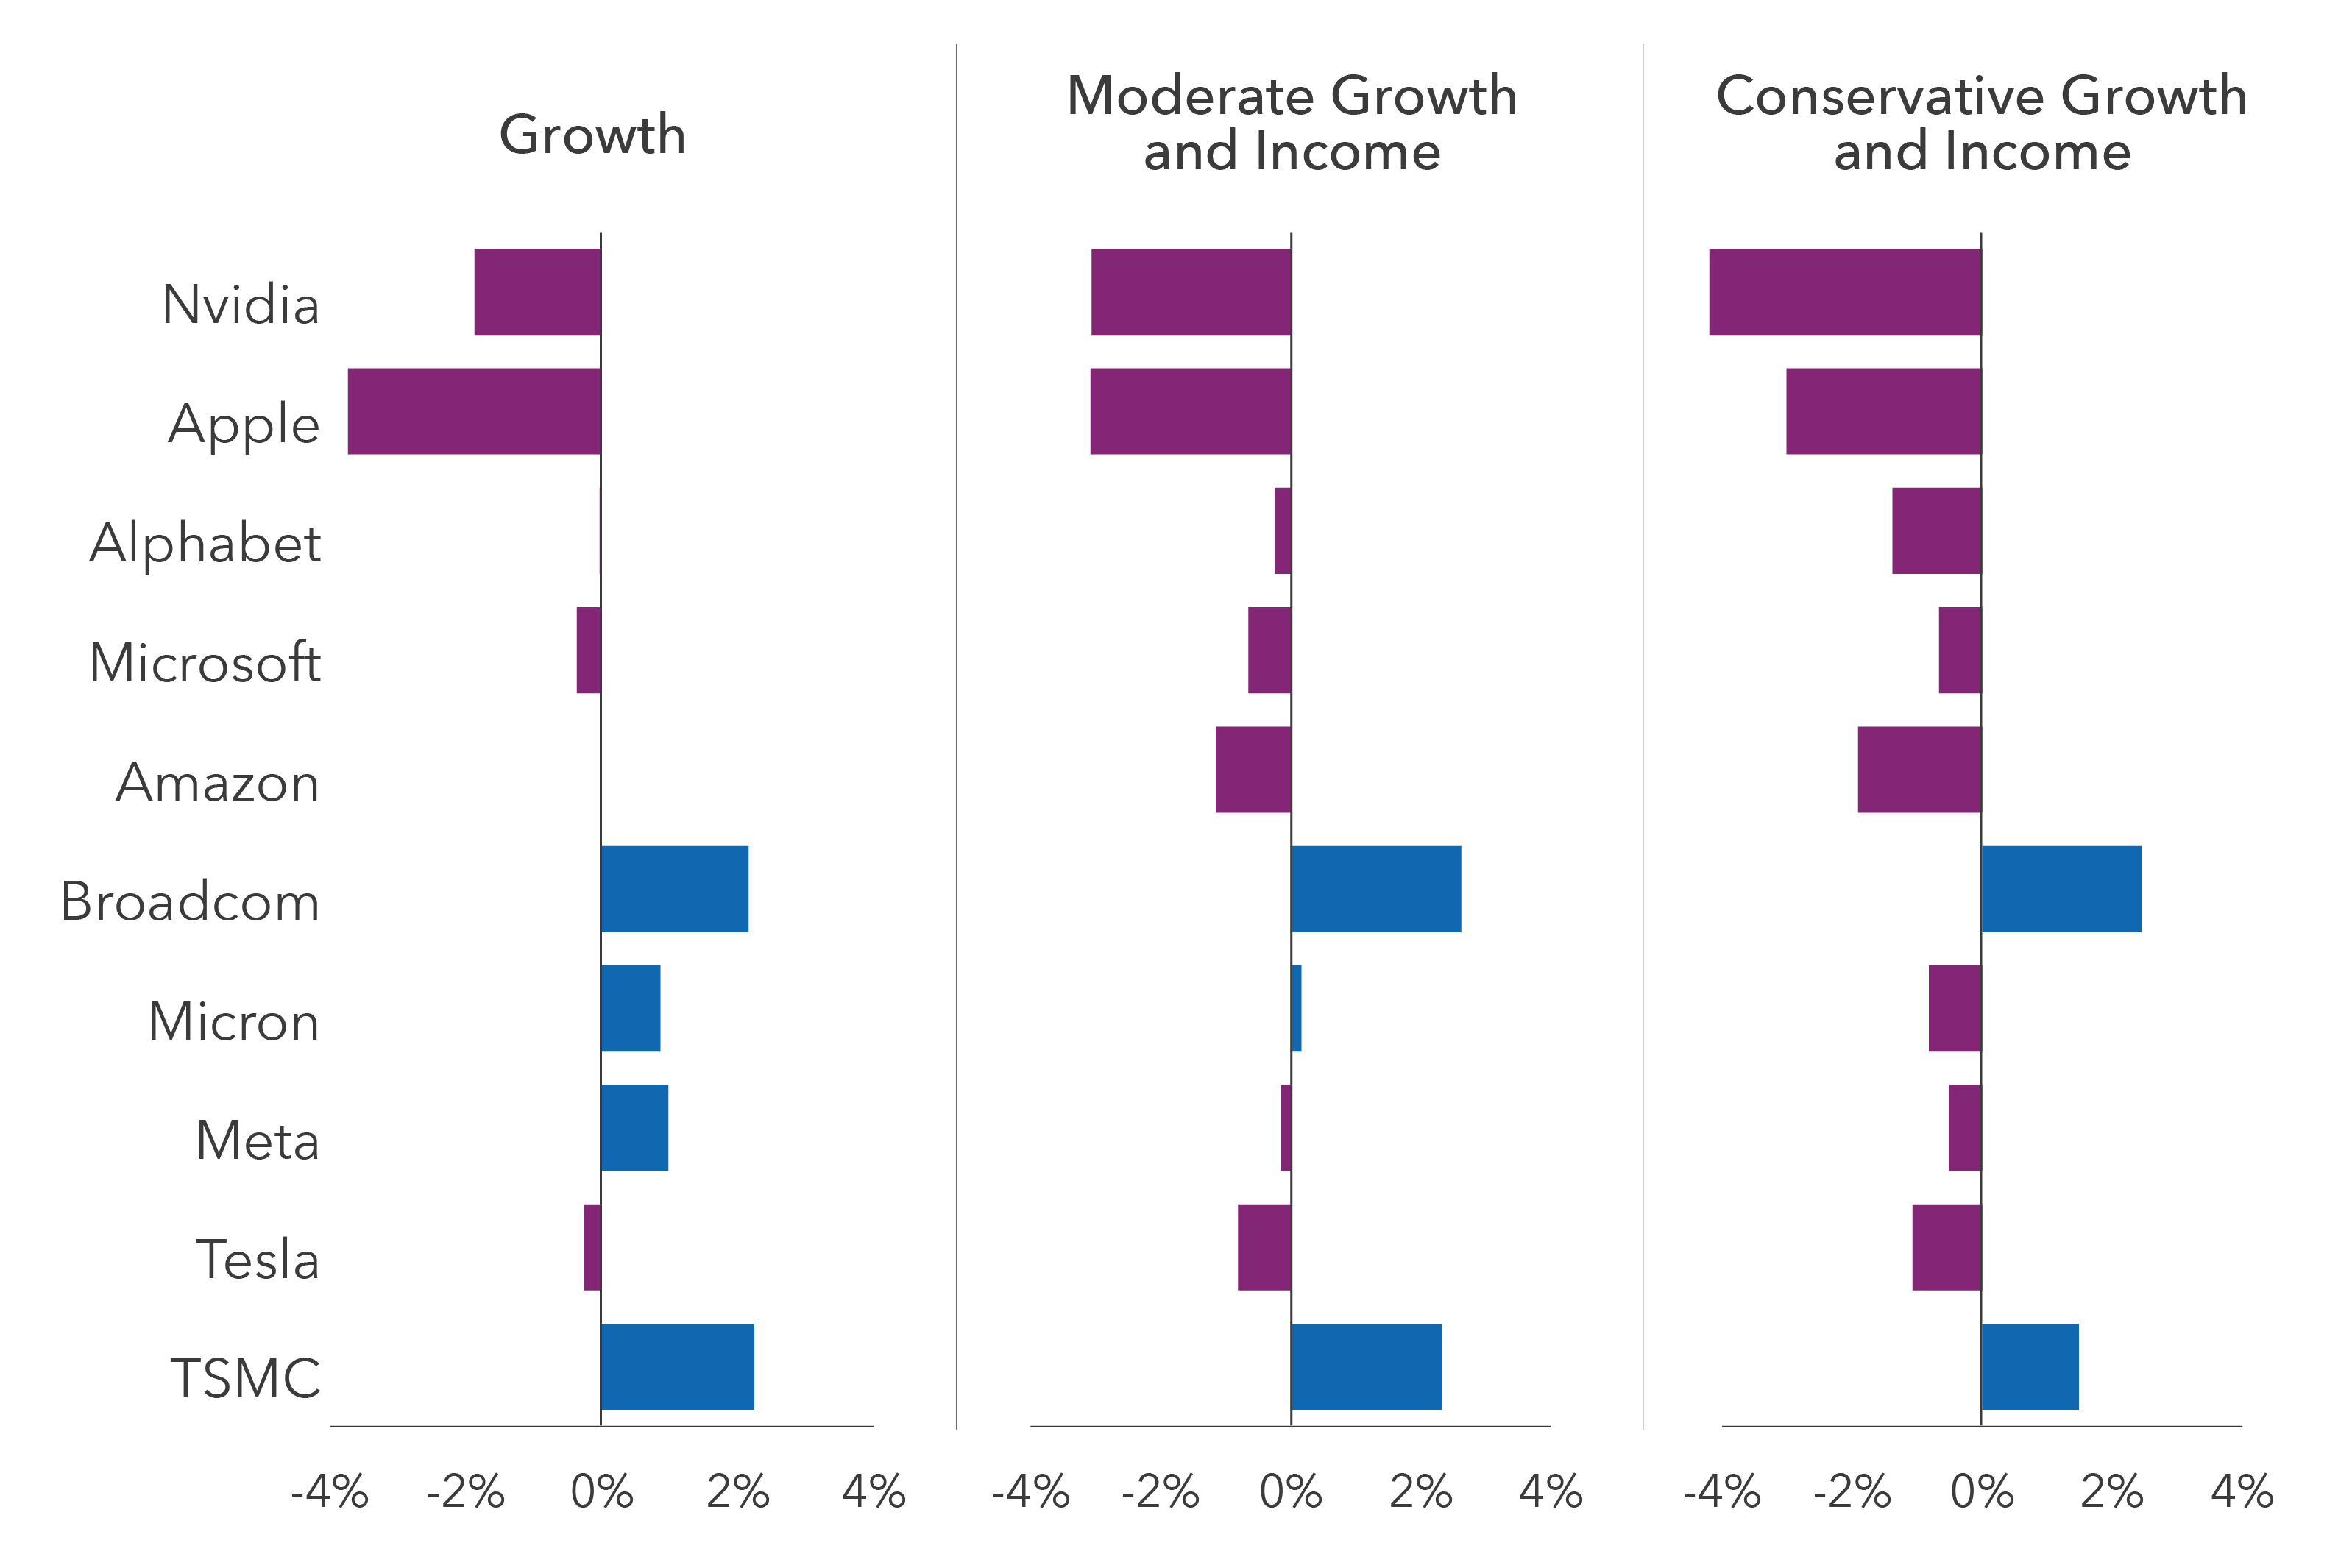
Bar chart shows relative exposure of three Capital Group Model Portfolios (Growth, Moderate Growth and Income and Conservative Growth and Income) to the top-10 equity holdings as determined by market cap weight of each of their indexes. All three models show lower-than-benchmark exposure to Nvidia, Apple, Tesla and Microsoft and greater-than-benchmark exposure to Broadcom, Micron, Meta and TSMC, although the size of the relative differences varies by model. Exposure to the top index names generally decreases as the models get more conservative.

Source: Capital Group. Data as of June 30, 2026. Growth = American Funds Growth Model Portfolio. Moderate Growth and Income = American Funds Moderate Growth and Income Model Portfolio. Conservative Growth and Income = American Funds Conservative Growth and Income Model Portfolio. The Growth Model Portfolio Index Blend benchmark is a composite of the following indexes with their respective weightings: 75% S&P 500 Index and 25% MSCI All Country World Index ex USA. The Moderate Growth and Income Model Portfolio Index Blend benchmark is a composite of the following indexes with their respective weightings: 45% S&P 500 Index, 35% Bloomberg U.S. Aggregate Index and 20% MSCI ACWI ex USA. The Conservative Growth and Income Model Portfolio Index Blend benchmark is a composite of the following indexes with their respective weightings: 30% S&P 500, 15% MSCI ACWI ex USA, 35% Bloomberg U.S. Aggregate Index and 20% Bloomberg U.S. Corporate High Yield 2% Issuer Capped Index.

Align equity exposures to the portfolio’s intended risk profile

Similarly, allocations to sectors should also vary by the intended risk-return profile. For portfolios prioritizing capital appreciation, greater exposure to funds that invest in more volatile growth companies in sectors like information technology can be appropriate. In contrast, income-focused portfolios should tilt toward more defensive funds that invest in higher yielding sectors such as consumer staples and utilities. Our models reflect this approach, tailoring our holdings to pursue each model’s investment objectives, resulting in tilts to various market sectors most aligned to these characteristics.

Diversify by aligning sector exposures to the portfolio’s intended risk profile

Percent of equity and relative weight vs. benchmark
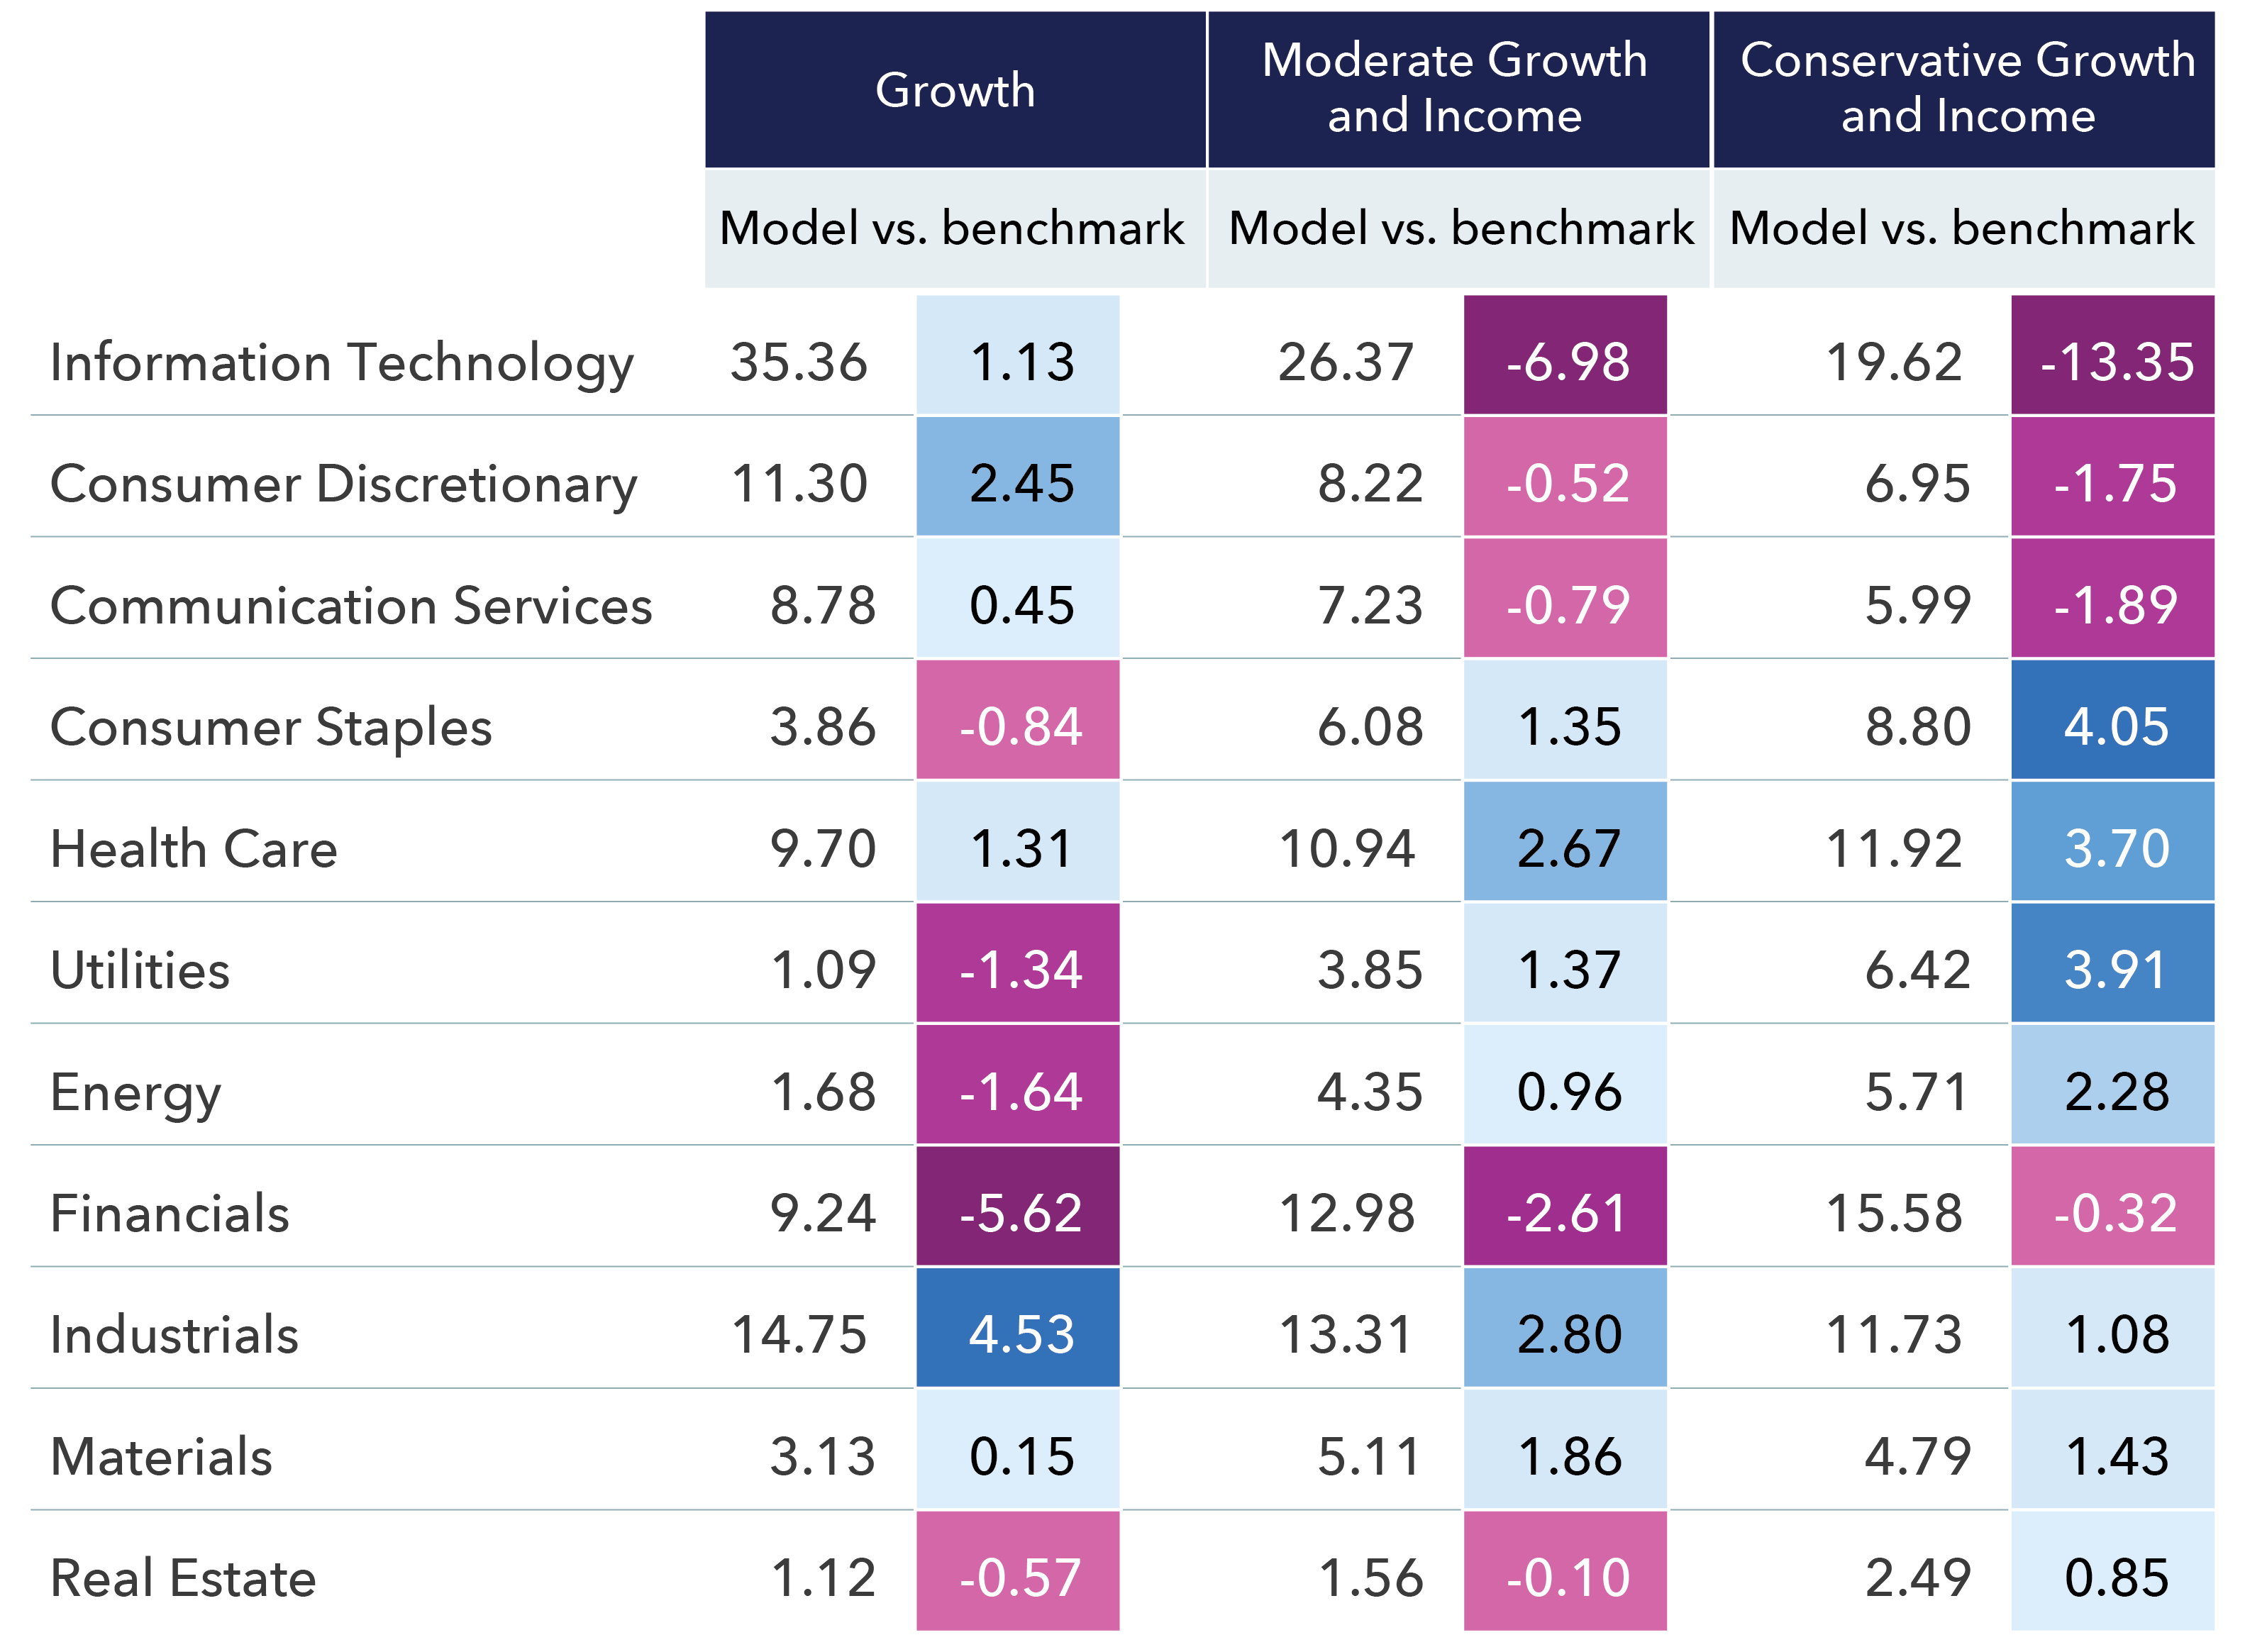
Table shows the percent of equity invested in each of the 11 primary equity sectors for the Growth, Moderate Growth and Income and Conservative Growth and Income model portfolios. Percent of equity invested in more growth-oriented sectors (e.g. Information Technology, Consumer Discretionary and Communication Services) declines as the portfolios get more conservative. For example, in Information Technology the Growth model has a 1.13% above benchmark allocation whereas the Conservative Growth and Income model has a 13.35% less-than-benchmark allocation. Conversely, the Conservative Growth and Income model has a 4.05% above benchmark allocation to Consumer Staples and the Growth Model has 0.84% below benchmark.

Source: Capital Group. Data as of June 30, 2026. Growth = American Funds Growth Model Portfolio. Moderate Growth and Income = American Funds Moderate Growth and Income Model Portfolio. Conservative Growth and Income = American Funds Conservative Growth and Income Model Portfolio. The Growth Model Portfolio Index Blend benchmark is a composite of the following indexes with their respective weightings: 75% S&P 500 Index and 25% MSCI All Country World Index ex USA. The Moderate Growth and Income Model Portfolio Index Blend benchmark is a composite of the following indexes with their respective weightings: 45% S&P 500 Index, 35% Bloomberg U.S. Aggregate Index and 20% MSCI ACWI ex USA. The Conservative Growth and Income Model Portfolio Index Blend benchmark is a composite of the following indexes with their respective weightings: 30% S&P 500, 15% MSCI ACWI ex USA, 35% Bloomberg U.S. Aggregate Index and 20% Bloomberg U.S. Corporate High Yield 2% Issuer Capped Index.

Active stock selection can help portfolios adapt to different investor goals

Although the funds comprising the American Funds Conservative Growth and Income Model Portfolio ("Conservative Growth and Income portfolio") invest in some of the larger AI-related companies, position weights are smaller than in our growth-oriented models to help manage risk. In addition, index construction does not account for investor risk tolerance, while objective-based active management can adjust holdings to pursue the portfolio's goals. As such, the Conservative Growth and Income portfolio holds funds whose largest positions are in higher dividend-paying equities that have historically been less volatile than growth-oriented stocks areas, including areas outside tech – such as consumer staples, pharmaceuticals and financial services.

Our models’ exposure to the 10 largest stocks evolves as objectives change

Percent of equity invested in benchmark’s top-10 holdings
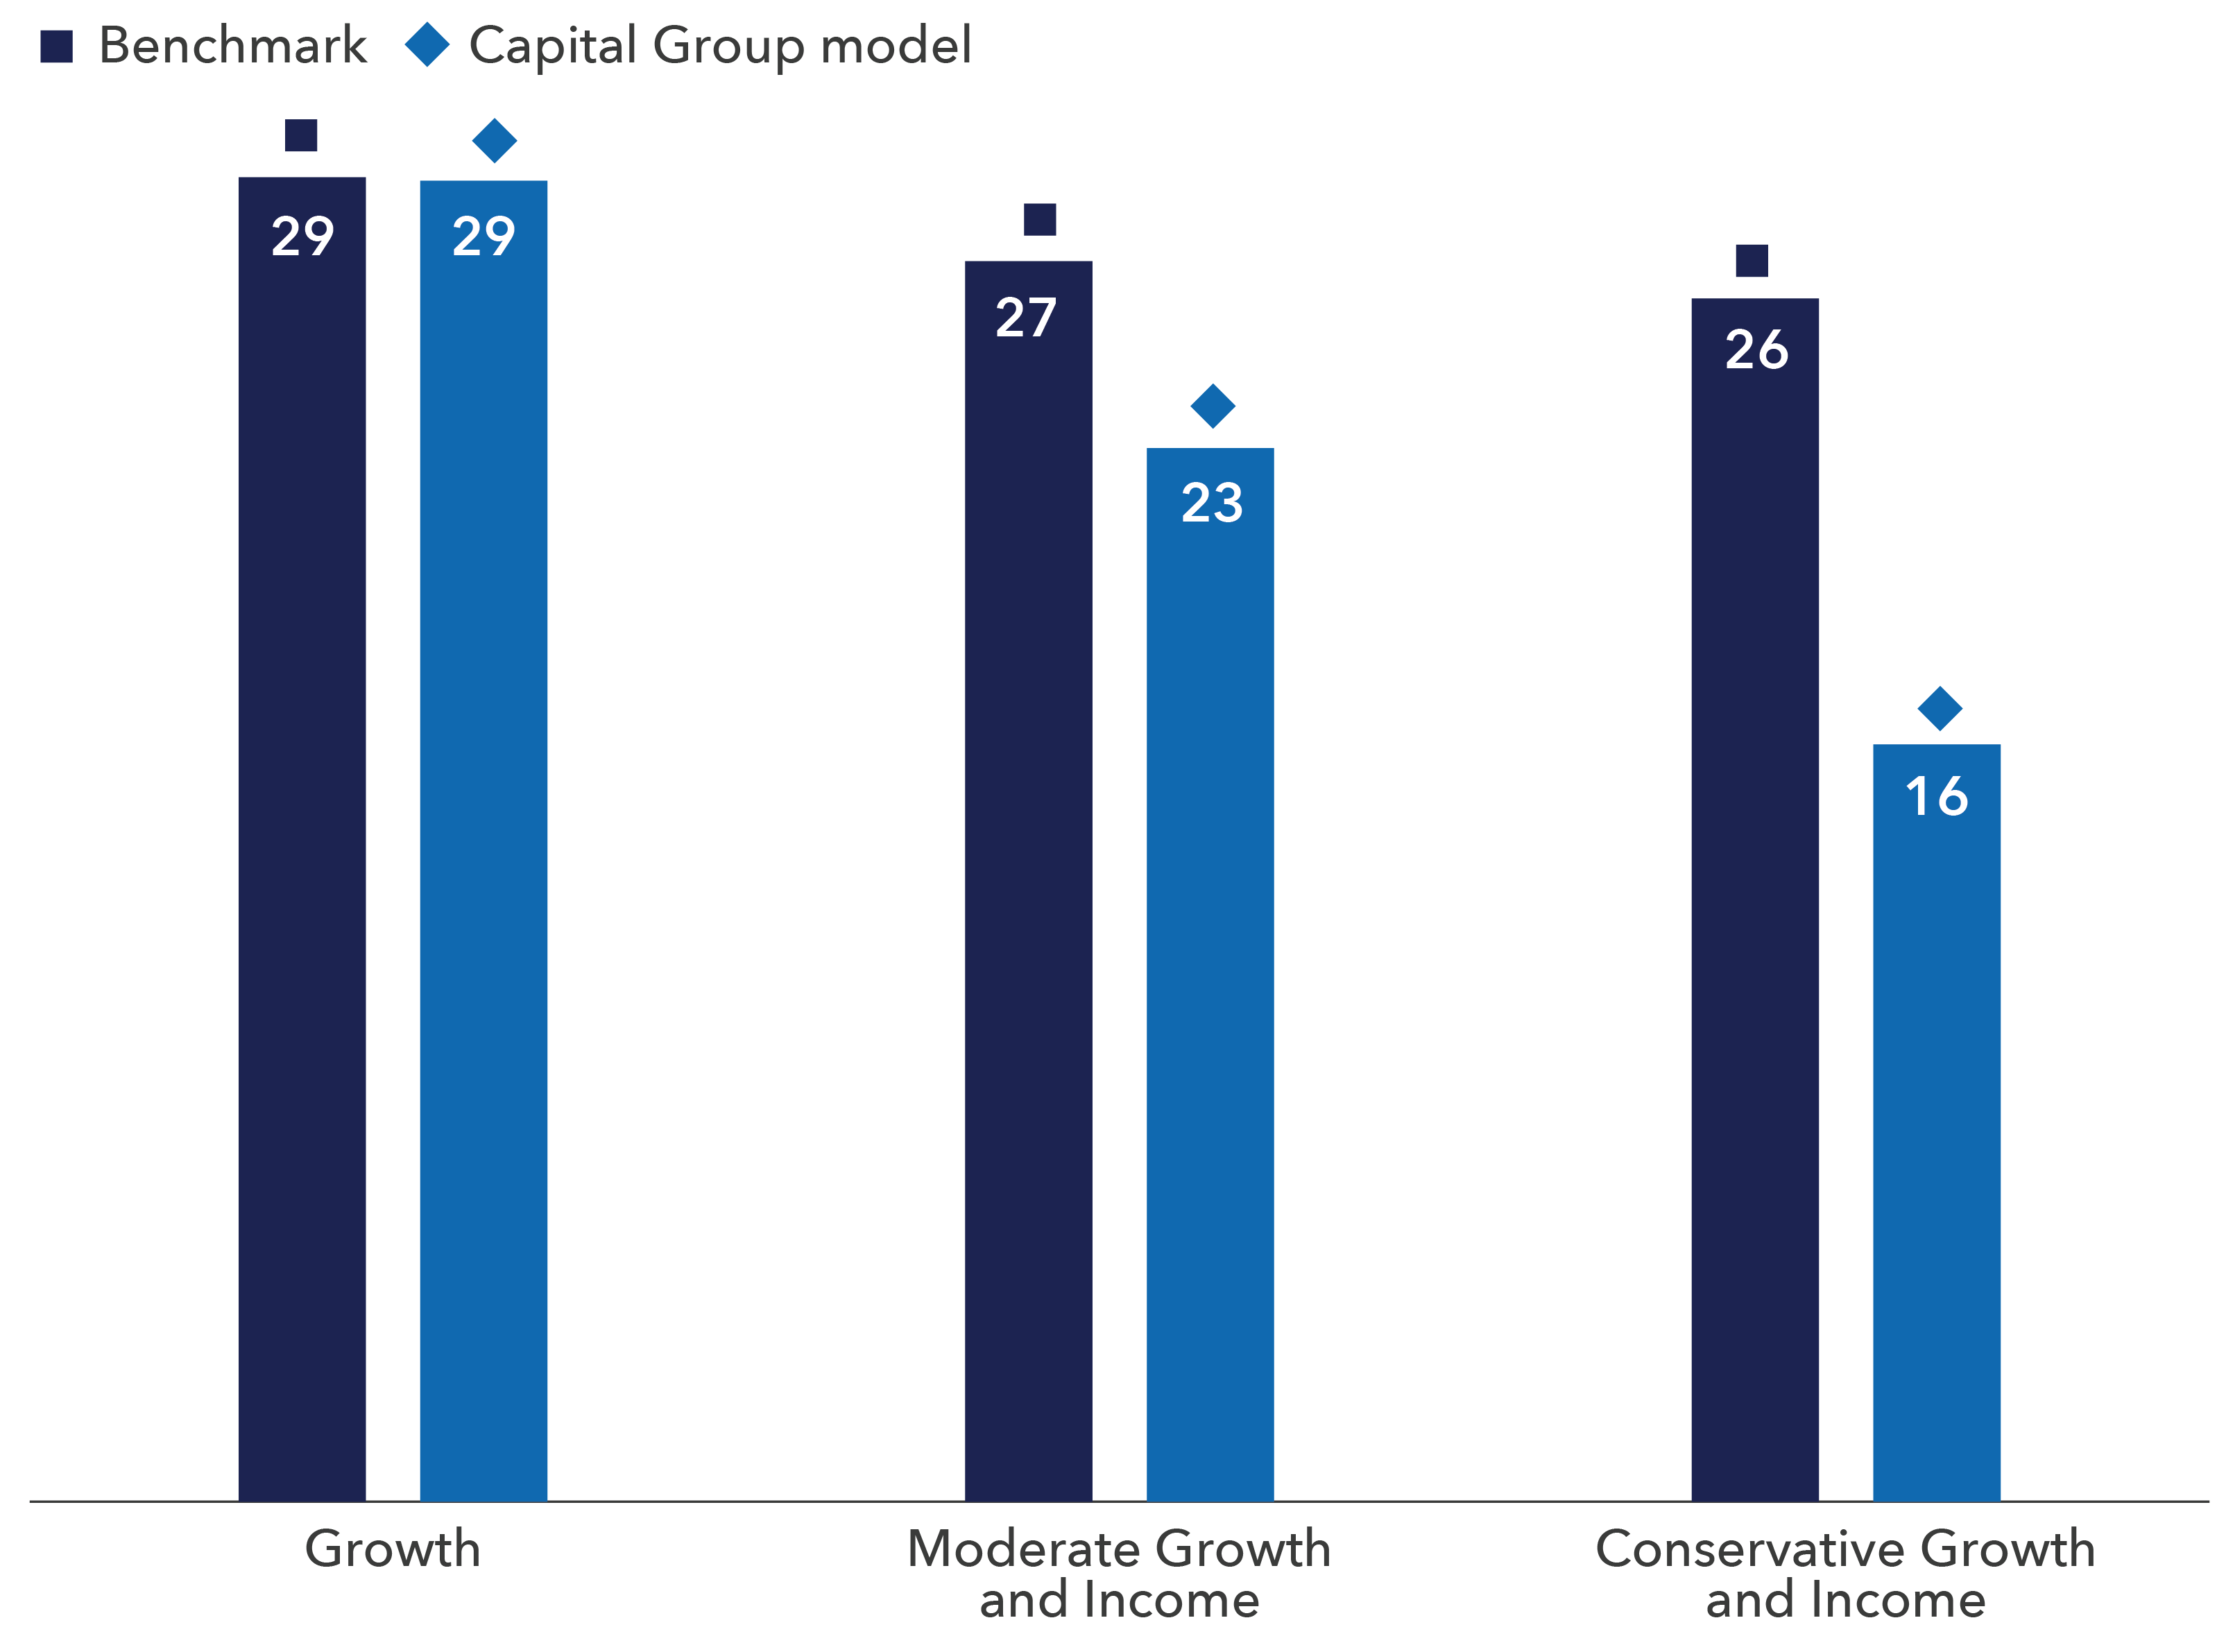
Column chart shows total percent of equity concentrated in the top-10 stocks weighted by market cap for the benchmarks of Capital Group’s Growth, Moderate Growth and Income and Conservative Growth and Income model portfolios and the portfolios themselves. The Growth model portfolio has similar exposure to the top-10 benchmark stocks (29% each), while the Moderate Growth and Income (MGI) and Conservative Growth and Income (CGI) models show declining exposure to those stocks. MGI has 23% in the benchmark top-10 vs. 27% for its benchmark. CGI has 16% in the benchmark top-10 vs. 26% for its benchmark.

Source: Capital Group. Data as of June 30, 2026. Growth = American Funds Growth Model Portfolio. Moderate Growth and Income = American Funds Moderate Growth and Income Model Portfolio. Conservative Growth and Income = American Funds Conservative Growth and Income Model Portfolio. The Growth Model Portfolio Index Blend benchmark is a composite of the following indexes with their respective weightings: 75% S&P 500 Index and 25% MSCI All Country World Index ex USA. The Moderate Growth and Income Model Portfolio Index Blend benchmark is a composite of the following indexes with their respective weightings: 45% S&P 500 Index, 35% Bloomberg U.S. Aggregate Index and 20% MSCI ACWI ex USA. The Conservative Growth and Income Model Portfolio Index Blend benchmark is a composite of the following indexes with their respective weightings: 30% S&P 500, 15% MSCI ACWI ex USA, 35% Bloomberg U.S. Aggregate Index and 20% Bloomberg U.S. Corporate High Yield 2% Issuer Capped Index.

Mario DiVito is a multi-asset investment director with a focus on model portfolios and target date services. He has 37 years of investment industry experience (as of 12/31/2025). He holds an MBA from DePaul University and a bachelor’s degree in finance from Loyola University.

Stanley Moy is a multi-asset investment specialist at Capital Group, home of American Funds, with 21 years of industry experience (as of 12/31/2025). He holds a master's degree in finance from Rice University and a bachelor's degree in economics from the University of Michigan. He also holds the Chartered Financial Analyst® and Chartered Alternative Investment Analyst℠ designations.

Investments are not FDIC-insured, nor are they deposits of or guaranteed by a bank or any other entity, so they may lose value.
Investors should carefully consider investment objectives, risks, charges and expenses. This and other important information is contained in the mutual fund prospectuses and summary prospectuses, which can be obtained from a financial professional and should be read carefully before investing.
Data based on underlying fund allocations shown unless otherwise noted. Underlying fund allocations are the model's target allocations.
Model portfolios are subject to the risks associated with the underlying funds in the model portfolio. Investors should carefully consider investment objectives, risks, fees and expenses of the funds in the model portfolio, which are contained in the fund prospectuses.
The return of principal for bond portfolios and portfolios with significant underlying bond holdings is not guaranteed. Investments are subject to the same interest rate, inflation and credit risks associated with the underlying bond holdings.
Lower rated bonds are subject to greater fluctuations in value and risk of loss of income and principal than higher rated bonds.
Investing outside the United States involves risks, such as currency fluctuations, periods of illiquidity and price volatility. These risks may be heightened in connection with investments in developing countries.
Nondiversified funds have the ability to invest a larger percentage of assets in the securities of a smaller number of issuers than a diversified fund. As a result, poor results by a single issuer could adversely affect fund results more than if the fund invested in a larger number of issuers. See the applicable prospectus for details.
Smaller company stocks entail additional risks, and they can fluctuate in price more than larger company stocks.
Allocations may not achieve investment objectives. The portfolios' risks are related to the risks of the underlying funds as described herein, in proportion to their allocations.
There have been periods when the results lagged the index(es) and/or average(s). The indexes are unmanaged and, therefore, have no expenses. Investors cannot invest directly in an index. Index/Index blends for Capital Group/American Funds Model Portfolios are those that the Portfolio Solutions Committee believes most closely approximate the investment universe of a given model portfolio. The index/index blends do not specifically represent the benchmarks of the underlying funds in the Capital Group/American Funds Model Portfolios.
Bloomberg Index Services Limited. BLOOMBERG® is a trademark and service mark of Bloomberg Finance L.P. and its affiliates (collectively "Bloomberg"). Bloomberg or Bloomberg's licensors own all proprietary rights in the Bloomberg Indices. Neither Bloomberg nor Bloomberg's licensors approves or endorses this material, or guarantees the accuracy or completeness of any information herein, or makes any warranty, express or implied, as to the results to be obtained therefrom and, to the maximum extent allowed by law, neither shall have any liability or responsibility for injury or damages arising in connection therewith.
The MSCI information may only be used for your internal use, may not be reproduced or redisseminated in any form and may not be used as a basis for or a component of any financial instruments or products or indices. None of the MSCI information is intended to constitute investment advice or a recommendation to make (or refrain from making) any kind of investment decision and may not be relied on as such. Historical data and analysis should not be taken as an indication or guarantee of any future performance analysis, forecast or prediction. The MSCI information is provided on an “as is” basis and the user of this information assumes the entire risk of any use made of this information. MSCI, each of its affiliates and each other person involved in or related to compiling, computing or creating any MSCI information (collectively, the “MSCI Parties”) expressly disclaims all warranties (including, without limitation, any warranties of originality, accuracy, completeness, timeliness, non-infringement, merchantability and fitness for a particular purpose) with respect to this information. Without limiting any of the foregoing, in no event shall any MSCI Party have any liability for any direct, indirect, special, incidental, punitive, consequential (including, without limitation, lost profits) or any other damages. Please visit the data provider's website for more information.
Each S&P Index ("Index") shown is a product of S&P Dow Jones Indices LLC and/or its affiliates and has been licensed for use by Capital Group. Copyright © 2026 S&P Dow Jones Indices LLC, a division of S&P Global, and/or its affiliates. All rights reserved. Redistribution or reproduction in whole or in part is prohibited without written permission of S&P Dow Jones Indices LLC.
Statements attributed to an individual represent the opinions of that individual as of the date published and do not necessarily reflect the opinions of Capital Group or its affiliates. This information is intended to highlight issues and should not be considered advice, an endorsement or a recommendation.
All Capital Group trademarks mentioned are owned by The Capital Group Companies, Inc., an affiliated company or fund. All other company and product names mentioned are the property of their respective companies.
Advisory services offered through Capital Research and Management Company (CRMC) and its RIA affiliates.
This content, developed by Capital Group, home of American Funds, should not be used as a primary basis for investment decisions and is not intended to serve as impartial investment or fiduciary advice.
Model portfolios are provided to financial intermediaries who may or may not recommend them to clients. The portfolios consist of an allocation of funds for investors to consider and are not intended to be investment recommendations. The portfolios are asset allocations designed for individuals with different time horizons, investment objectives, and risk profiles. Allocations may change and may not achieve investment objectives. If a cash allocation is not reflected in a model, the intermediary may choose to add one. Capital Group does not have investment discretion or authority over investment allocations in client accounts. Rebalancing approaches may differ depending on where the account is held. Investors should talk to their financial professional for information on other investment alternatives that may be available. In making investment decisions, investors should consider their other assets, income, and investments. Visit capitalgroup.com for current allocations.
Use of this website is intended for U.S. residents only. Use of our website and materials is subject to approval by your home office.

Portfolios are managed, so holdings will change. Data based on weighted averages of holdings of the underlying funds. Based on actual allocations as of June 30, 2026.


Model portfolios are subject to the risks associated with the underlying funds in the model portfolio. Investors should carefully consider investment objectives, risks, fees and expenses of the funds in the model portfolio, which are contained in the fund prospectuses. Investing outside the United States involves risks, such as currency fluctuations, periods of illiquidity and price volatility. These risks may be heightened in connection with investments in developing countries. Smaller company stocks entail additional risks, and they can fluctuate in price more than larger company stocks. The return of principal for bond funds and for funds with significant underlying bond holdings is not guaranteed. Fund shares are subject to the same interest rate, inflation and credit risks associated with the underlying bond holdings. Lower rated bonds are subject to greater fluctuations in value and risk of loss of income and principal than higher rated bonds. Investments in mortgage-related securities involve additional risks, such as prepayment risk. The use of derivatives involves a variety of risks, which may be different from, or greater than, the risks associated with investing in traditional securities, such as stocks and bonds. Income from municipal bonds may be subject to state or local income taxes and/or the federal alternative minimum tax. Certain other income, as well as capital gain distributions, may be taxable. A nondiversified fund has the ability to invest a larger percentage of assets in the securities of a smaller number of issuers than a diversified fund. As a result, poor results by a single issuer could adversely affect fund results more than if the fund were invested in a larger number of issuers. See the applicable prospectus for details.


Index definitions:


S&P 500 Index is a market-capitalization weighted index based on the results of approximately 500 widely held common stocks.


MSCI All Country World Index (ACWI) ex USA is a free-float-adjusted market-capitalization-weighted index that is designed to measure equity market results in the global developed and emerging markets, excluding the United States. The index consists of more than 40 developed and emerging-market country indexes.


Bloomberg U.S. Aggregate Index: Bloomberg U.S. Aggregate Index represents the U.S. investment-grade fixed-rate bond market.


Bloomberg U.S. Corporate High Yield 2% Issuer Capped Index covers the universe of fixed-rate non-investment-grade debt. The index limits the maximum exposure of any one issuer to 2%.