
Many investors and advisors look at return and volatility versus a benchmark when evaluating the success of their portfolios. In general, common practice across the industry tends to follow this traditional approach to portfolio construction: Optimize the asset allocation to maximize expected return for a given level of risk. But return and standard deviation aren’t the only ways to measure portfolio success. Here are four ideas for assessing whether portfolios are on track to meet different longer term goals:
January 20, 2026
7 MIN ARTICLE
KEY TAKEAWAYS
- Return and volatility are common measures of portfolio success. There are other success metrics to keep in mind based on client goals.
- Success metrics should change over time, as an investor’s objectives evolve from building wealth to preserving wealth.
- This article shares practical asset allocation ideas, using success metrics and examples from the Capital Group Portfolio Consulting and Analytics team.
1. Tailor success metrics to long-term client goals
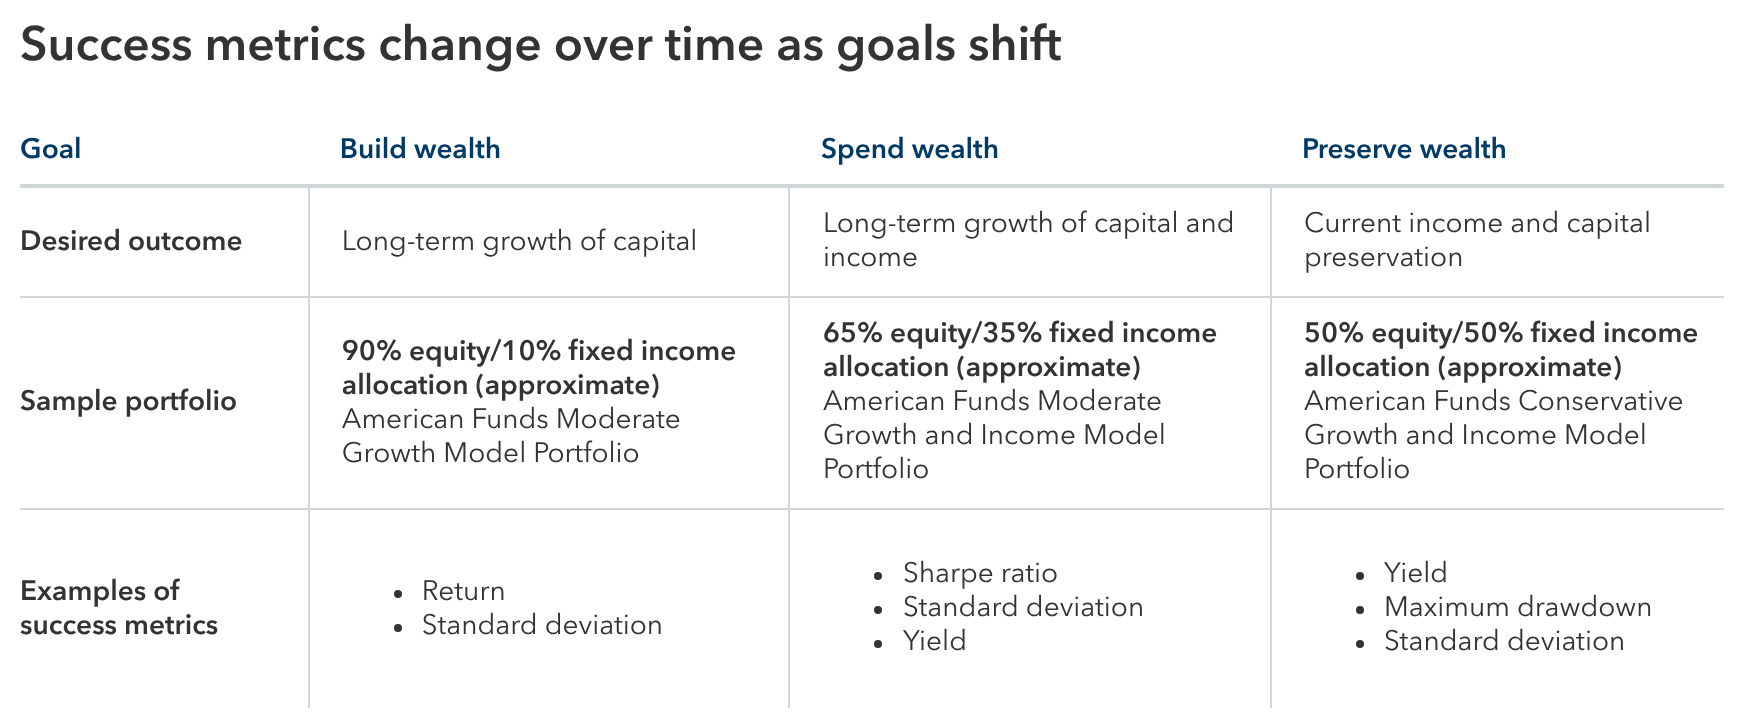
Success metrics should change over time, just like goals can vary depending on an investor's aspirations, financial situation, risk tolerance and time horizon. Common investor goals and desired outcomes tied to major life stages can include building, spending or preserving wealth. For each of these goals, what ongoing success looks like can vary.
Investor goals change over time
Source: Capital Group
“Capital Group has moved beyond excess return as the sole success metric by adopting a multi-objective optimization framework. This shift ensures portfolios are measured not just by returns, but by their ability to deliver outcomes aligned with investors’ evolving needs,” says Mark Barile, manager of the Capital Group Portfolio Consulting and Analytics team.
For example, an investor pursuing income and capital preservation would care about more than returns and volatility. They would also want their portfolio to provide yield (income) and a degree of downside resilience during market declines.
Depending on a client’s goals as well as their concerns, a variety of factors can be measured: return, risk-adjusted return, volatility, yield and drawdown.
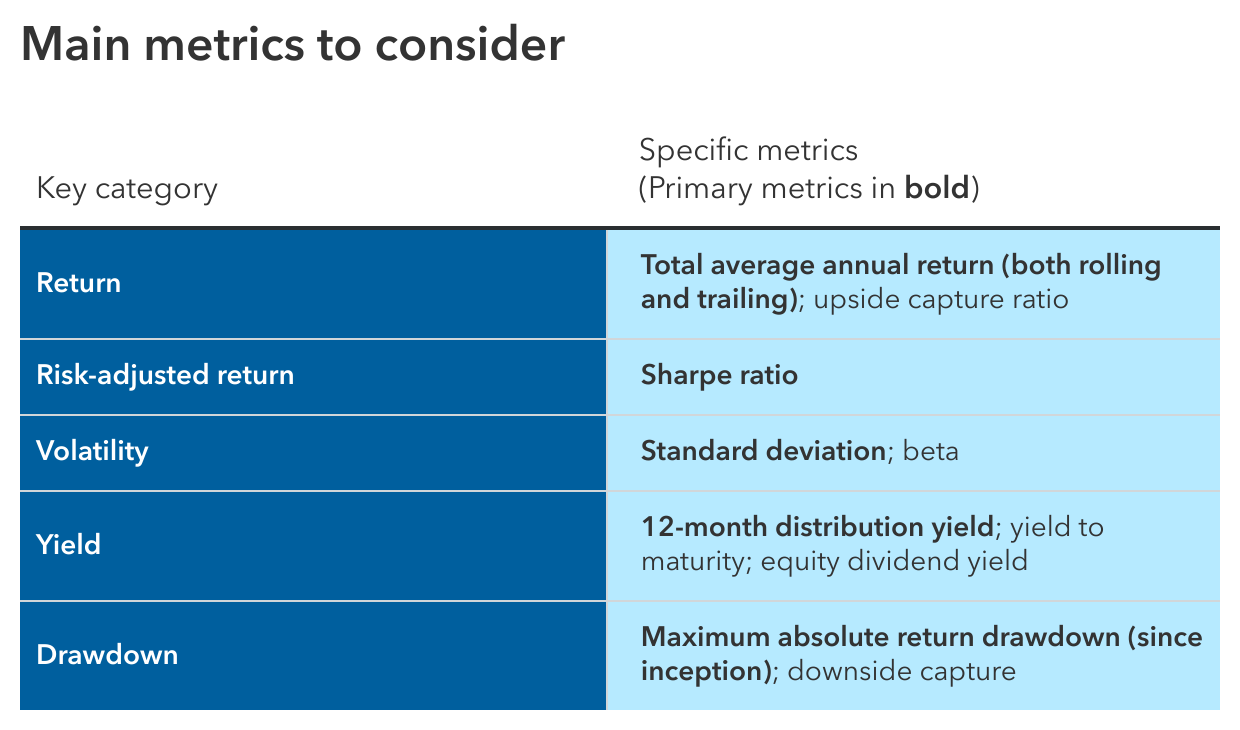
Source: Capital Group. Standard deviation is a common measure of absolute volatility that tells how returns over time have varied from the mean. Sharpe ratios use standard deviation and return in excess of the risk-free rate to determine reward per unit of risk. Maximum drawdown is the maximum loss from the highest point to the lowest point of portfolio returns before a new high point is reached. Upside/downside capture ratio measures how well a fund did relative to a market index during periods when the index rose/fell.
How do you know which metrics to apply and when? Barile, whose team reviews portfolios submitted by thousands of advisors each year, suggests applying a framework to help match success metrics and asset allocation examples to goals as they evolve over time.
Source: Capital Group
“This is the approach we use when building and monitoring the success of American Funds Model Portfolios,” says head of Wealth Solutions Jan Gundersen. “For us, success is defined by whether we meet our clients’ objectives over the long term,” Gundersen adds.
The framework is both durable and flexible enough to accommodate a wide range of client preferences, says Barile. “Advisors can partner with our team to customize these success metrics to their specific goals.”
2. Translate success metrics to target asset allocations
How assets are allocated can also impact what success in a portfolio might look like. Consider a couple 15 years away from retirement with college-age children and aging parents. They need to build wealth to fund their retirement, college and long-term care expenses for their parents. But they also want to avoid taking on too much risk, given that they are only 15 years away from retiring. A 65% equity/35% fixed income portfolio might be an appropriate allocation for the couple’s needs.
For this portfolio, standard deviation (volatility) would be an important success metric given the couple’s desire to grow assets with moderate risk. Although absolute returns may be important, arguably the more important metric is risk-adjusted returns to help protect their retirement nest egg. Risk-adjusted return can be measured in multiple ways, such as using the Sharpe ratio, which measures return per unit of risk taken.
On the other hand, an investor who wants to preserve wealth and who needs more income might want a more conservative 50/50 portfolio. In this case, success metrics would prioritize yield and maximum drawdown based on the investor’s need for income and a measure of downside protection.
When translating this framework to actual investments, it can be helpful to start with target asset class allocations based on goals, according to senior portfolio consultant Greg Smith. “For example, an income objective might merit a greater allocation to dividend-paying stocks and higher yielding bonds,” Smith says.
Examples of advisor portfolios built to meet different goals
Here’s an example of how Smith applied the success metrics framework to sample client portfolios with 65/35 and 50/50 allocations as well as a more growth-oriented portfolio.
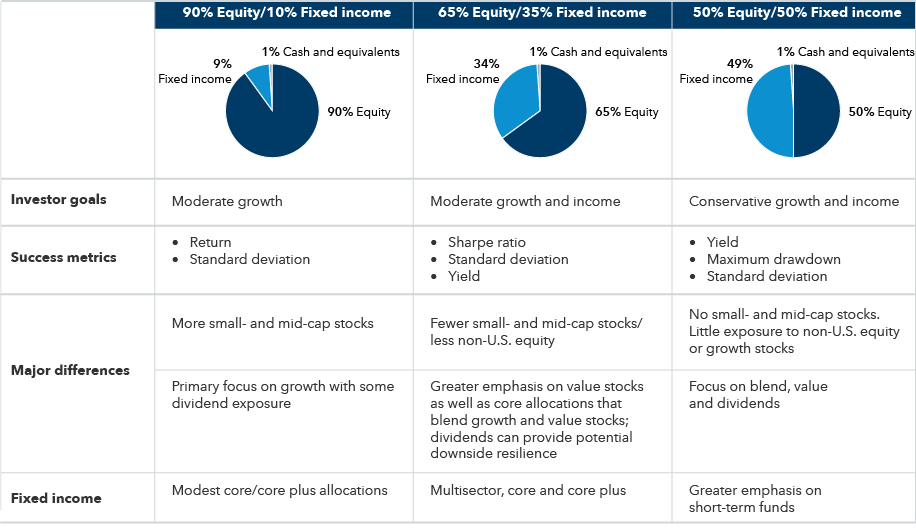
Source: Capital Group. Cash and equivalents includes short-term securities, accrued income and other assets less liabilities. It may also include investments in money market or similar funds managed by the investment adviser or its affiliates that are not offered to the public.
These portfolios include client preferences for certain passive (index-tracking) and factor-based allocations as well as active funds. Factor-based investing builds allocations on specific drivers of risk and return, including factors such as quality, low volatility, style and momentum, rather than traditional asset class categories. For example, the quality factor focuses on a company’s strength and stability, using metrics such as profitability, earnings stability and debt-to-equity ratio. The momentum factor focuses on buying stocks that have had strong results in the past, while selling those that have not fared as well.
Take a closer look at specific asset-class level allocations for these three portfolios
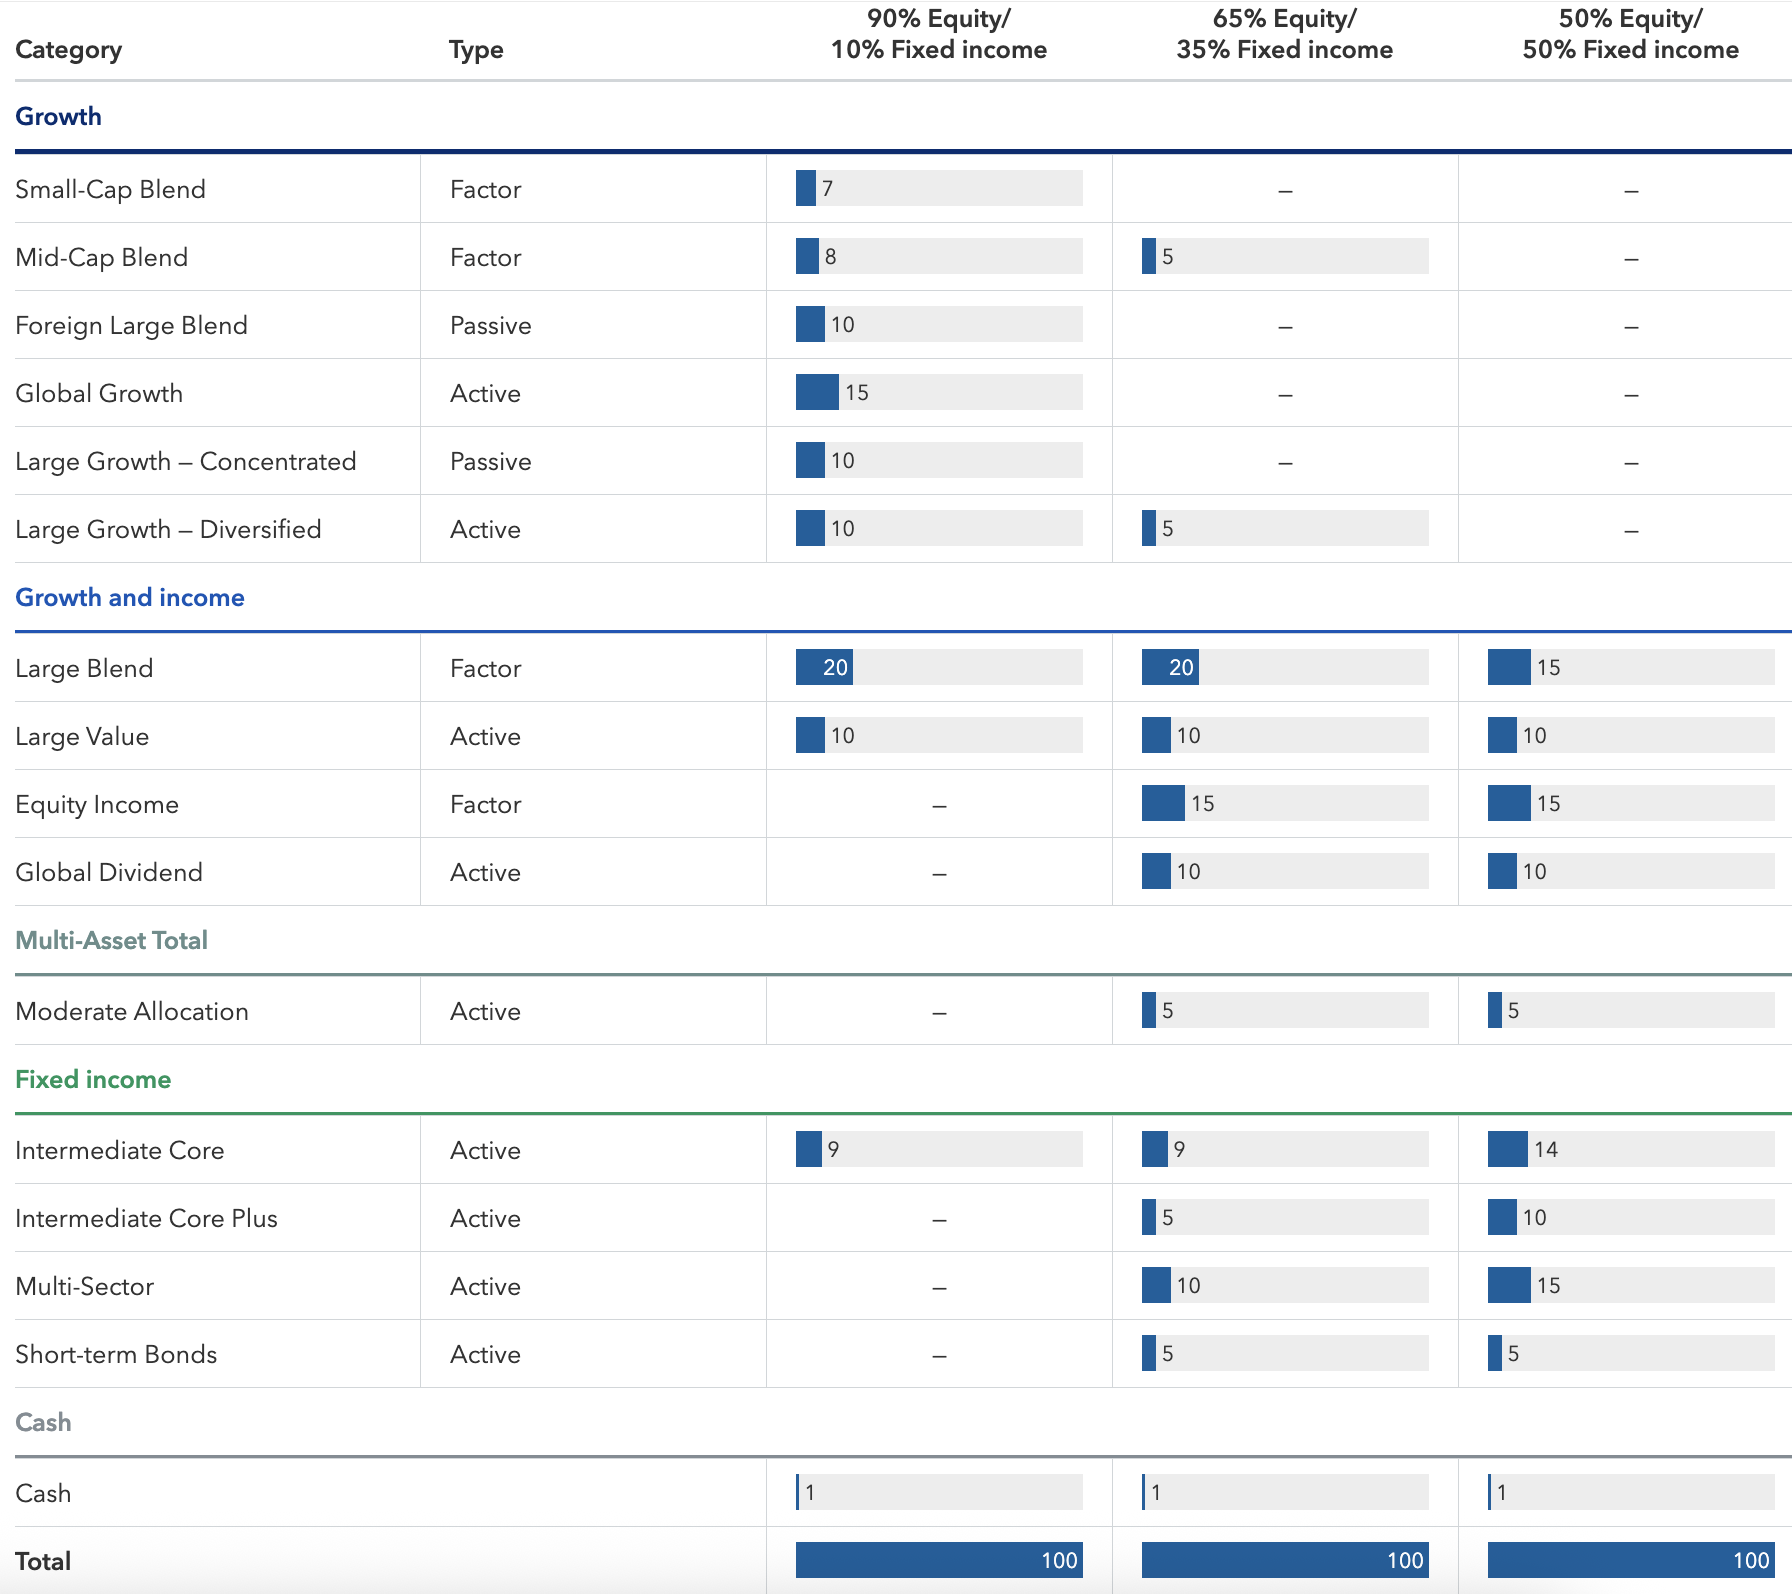
Sources: Capital Group Portfolio Consulting and Analytics team. All categories are based on Morningstar categories except Equity Income, Global Dividend, Large Growth — Concentrated and Large Growth — Diversified, which are custom categories created by the consulting team.
3. Consider dividend payers to support risk-adjusted returns and help reduce volatility
For some investors, a successful portfolio can be measured by how it stands up to volatility. In general, dividend-oriented stocks tend to have lower volatility over time versus non-dividend-paying equities. This is because regular dividend payers tend to be more established companies with steadier cash flows. In addition, the dividend payments can cushion the impact of stock price declines. Over the period from December 31, 1989 to December 31, 2024, for example, the standard deviation for global dividend payers was about 15% versus nearly 20% for non-dividend payers. Over that same period, dividend-paying stocks also outpaced those paying no dividends.
Examples of advisor portfolios built to meet different goals
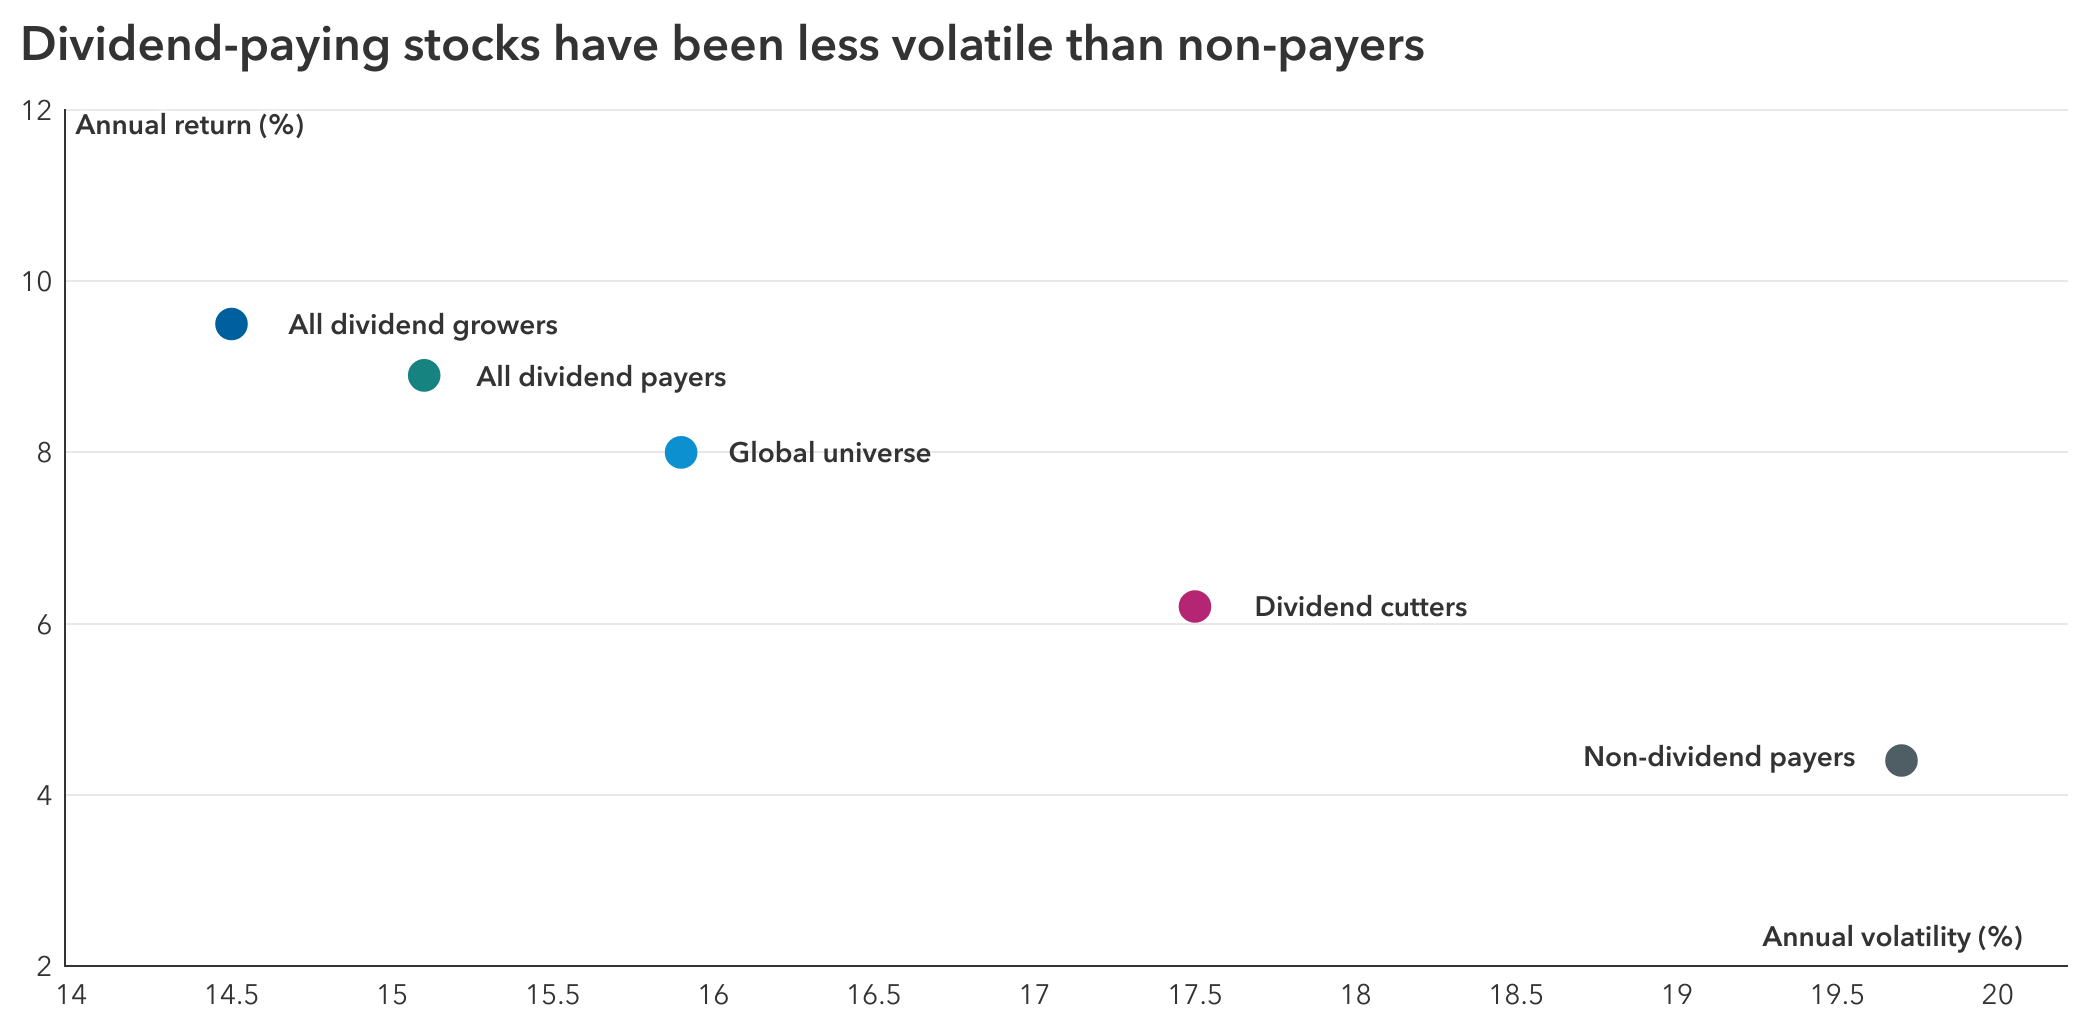
Sources: Compustat, Worldscope via FactSet, MSCI, Capital Group. Data from 12/31/89 through 12/31/24.
Returns for the global universe are total returns in USD (with gross dividends reinvested) calculated as a weighted average of regional portfolio allocations. The universe from December 1989 to December 2004 consists of an equal-weighted portfolio of the 1,000 largest companies in the S&P BMI Global Index for North America (50% weight), Europe (25%) and Japan (10%); and the 500 largest companies for Emerging Markets (10%) and Pacific ex Japan (5%). Thereafter (from January 2005 to December 31, 2024) the universe consists of an equal-weighted portfolio of the 1,000 largest companies in the MSCI IMI (Investable Market Index) Indices for North America, Europe and Japan; and the 500 largest companies for Emerging Markets and Pacific ex Japan. The global universe is based on an approximate weighting of regions in the MSCI ACWI and do not reflect the changing regional shifts. The universe constituents were rebalanced quarterly, and volatility (standard deviation) is based on monthly returns. All companies composing the global universe are split into dividend payers and non-dividend payers. A company was classified as a “dividend payer” if it paid a dividend during the previous quarter. A company was classified as a “dividend grower” (a subset of payers) if its trailing 12-month dividend per share increased relative to one year earlier. Past results are not predictive of results in future periods. “Dividend cutters” refer to companies that previously paid dividends, but reduced or halted dividends in the previous quarter. “Non-dividend payers” are companies that do not pay dividends to their shareholders.
Investors can increase equity exposure to companies that consistently pay quality dividends to potentially lower volatility. Dividend payers can also help an investor seek better downside capture, which shows how much an investment lost versus the benchmark during market downturns, Smith says.
4. Fine-tune bond allocations for different objectives
Investors may want to take a close look at the complexion of their fixed income allocations as success metrics like yield, volatility and maximum drawdown become important in more conservative portfolios. Bonds can play multiple roles, including diversification from equities, preservation and income (yield).
“Consider tailoring the mix of fixed income asset classes to portfolio objectives and corresponding success metrics,” Smith says. “Each category of fixed income has different benefits and risks.”
For example, while high-yield bonds often show higher correlations to equities, they can also support higher income. Investors seeking a combination of growth and income (65/35 or 50/50 portfolio) may need credit flexibility and greater preservation via higher quality fixed income. Meanwhile, core bonds can serve as a diversifier to equity volatility in a 65/35 portfolio while supplementing higher income-seeking funds in more conservative portfolios.
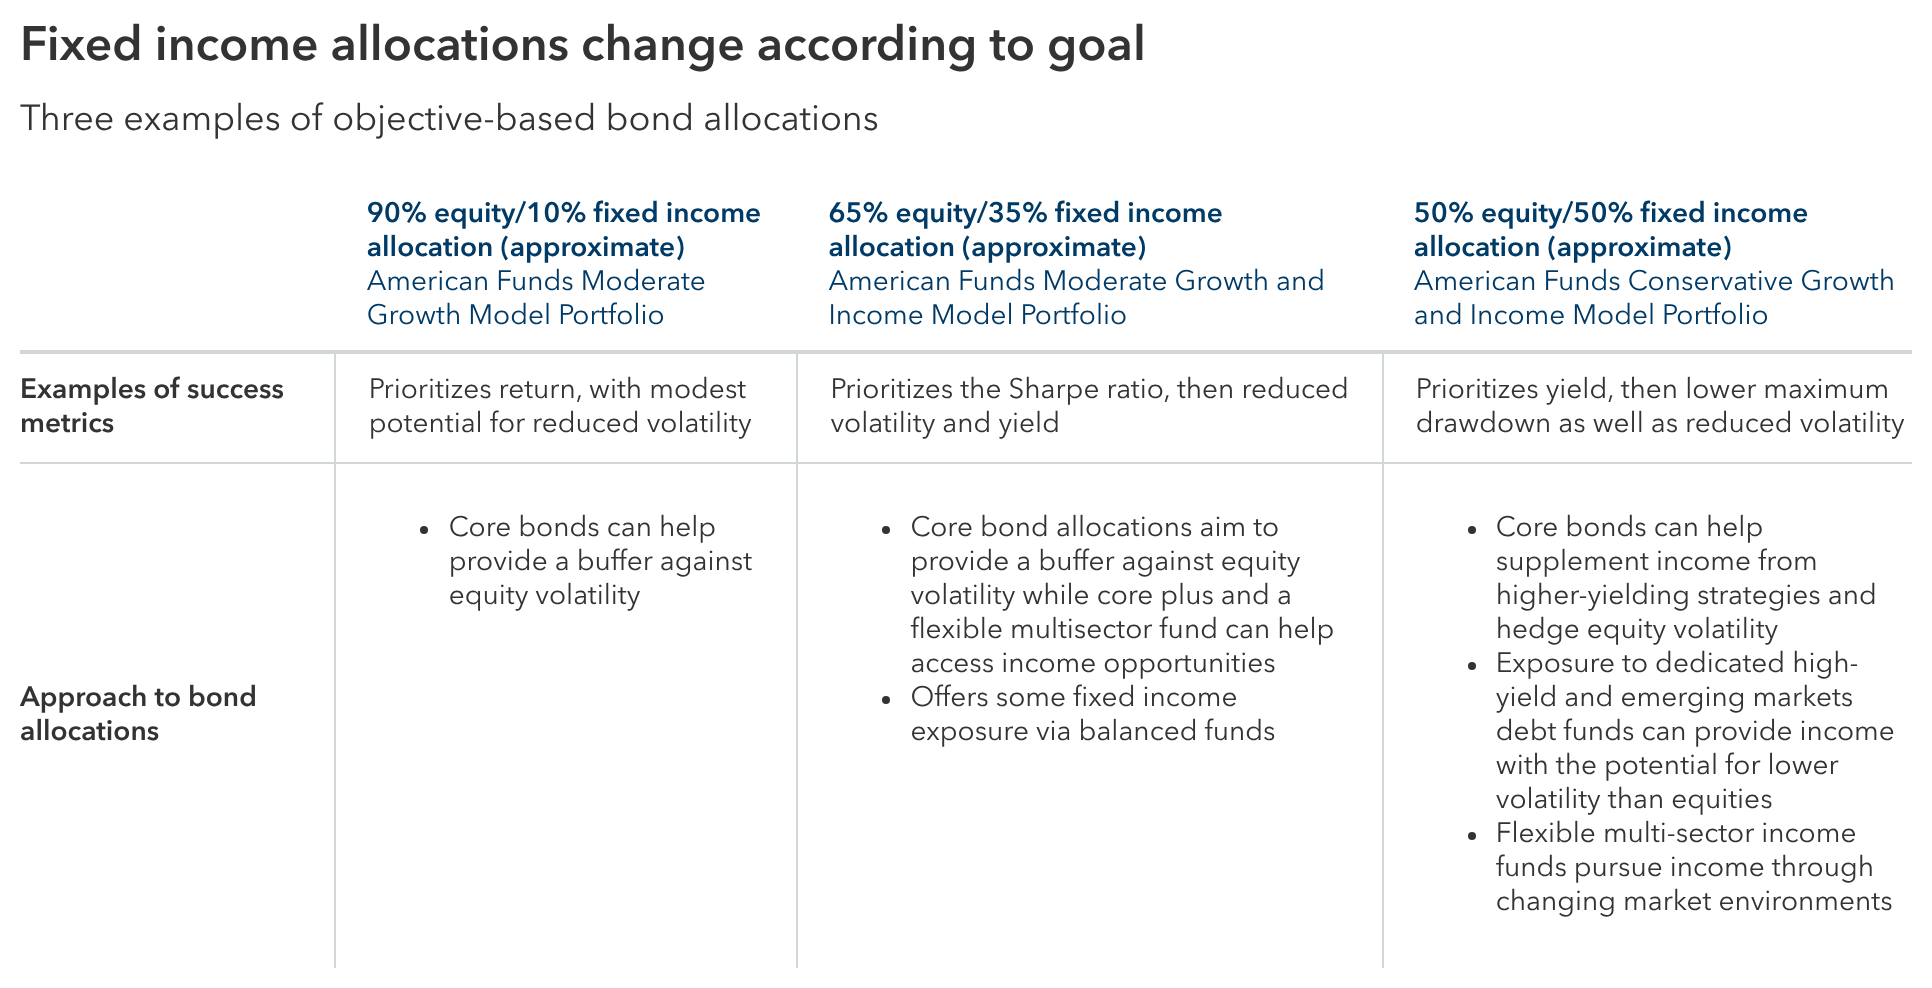
Source: Capital Group
Partner with us to customize success metrics
For more on portfolio success metrics and how they have influenced the construction of our model portfolios, download our full report, “Think differently about measuring portfolio success.”
Want to talk about different metrics to evaluate the success of your portfolios?

Mark Barile is a Senior Manager, Portfolio Consulting and Analytics with 20 years of industry experience as of 12/31/2025. He holds a bachelor's degree in studio art from Trinity University. He also holds the Certified Investment Management Analyst® designation.

Jan Gundersen is head of Wealth Solutions with 27 years of investment industry experience. He holds a master’s degree in oceanography from Texas A&M University and a bachelor’s degree in geology from Colgate University. He also holds the Chartered Financial Analyst® designation.

Greg Smith is a senior portfolio consultant with 20 years of investment industry experience. He holds a bachelor's degree in history and education from Taylor University. He also holds the Certified Financial Planner™ and Certified Investment Management Analyst® designations.