On Good Friday, the New York Stock Exchange and Capital Group’s U.S. offices will be closed.

In observance of Good Friday, the New York Stock Exchange and Capital Group’s U.S. offices will be closed on Friday, April 3.

Planning and Investing Be wary of unintended small- and mid-cap exposure

6 MIN ARTICLE

Buyer beware? How about owner beware? Understanding what types of equity you own is key to maintaining a balanced portfolio. But certain exposures can pop up unexpectedly within your equity funds, particularly with small- and mid-cap (SMID) stocks.


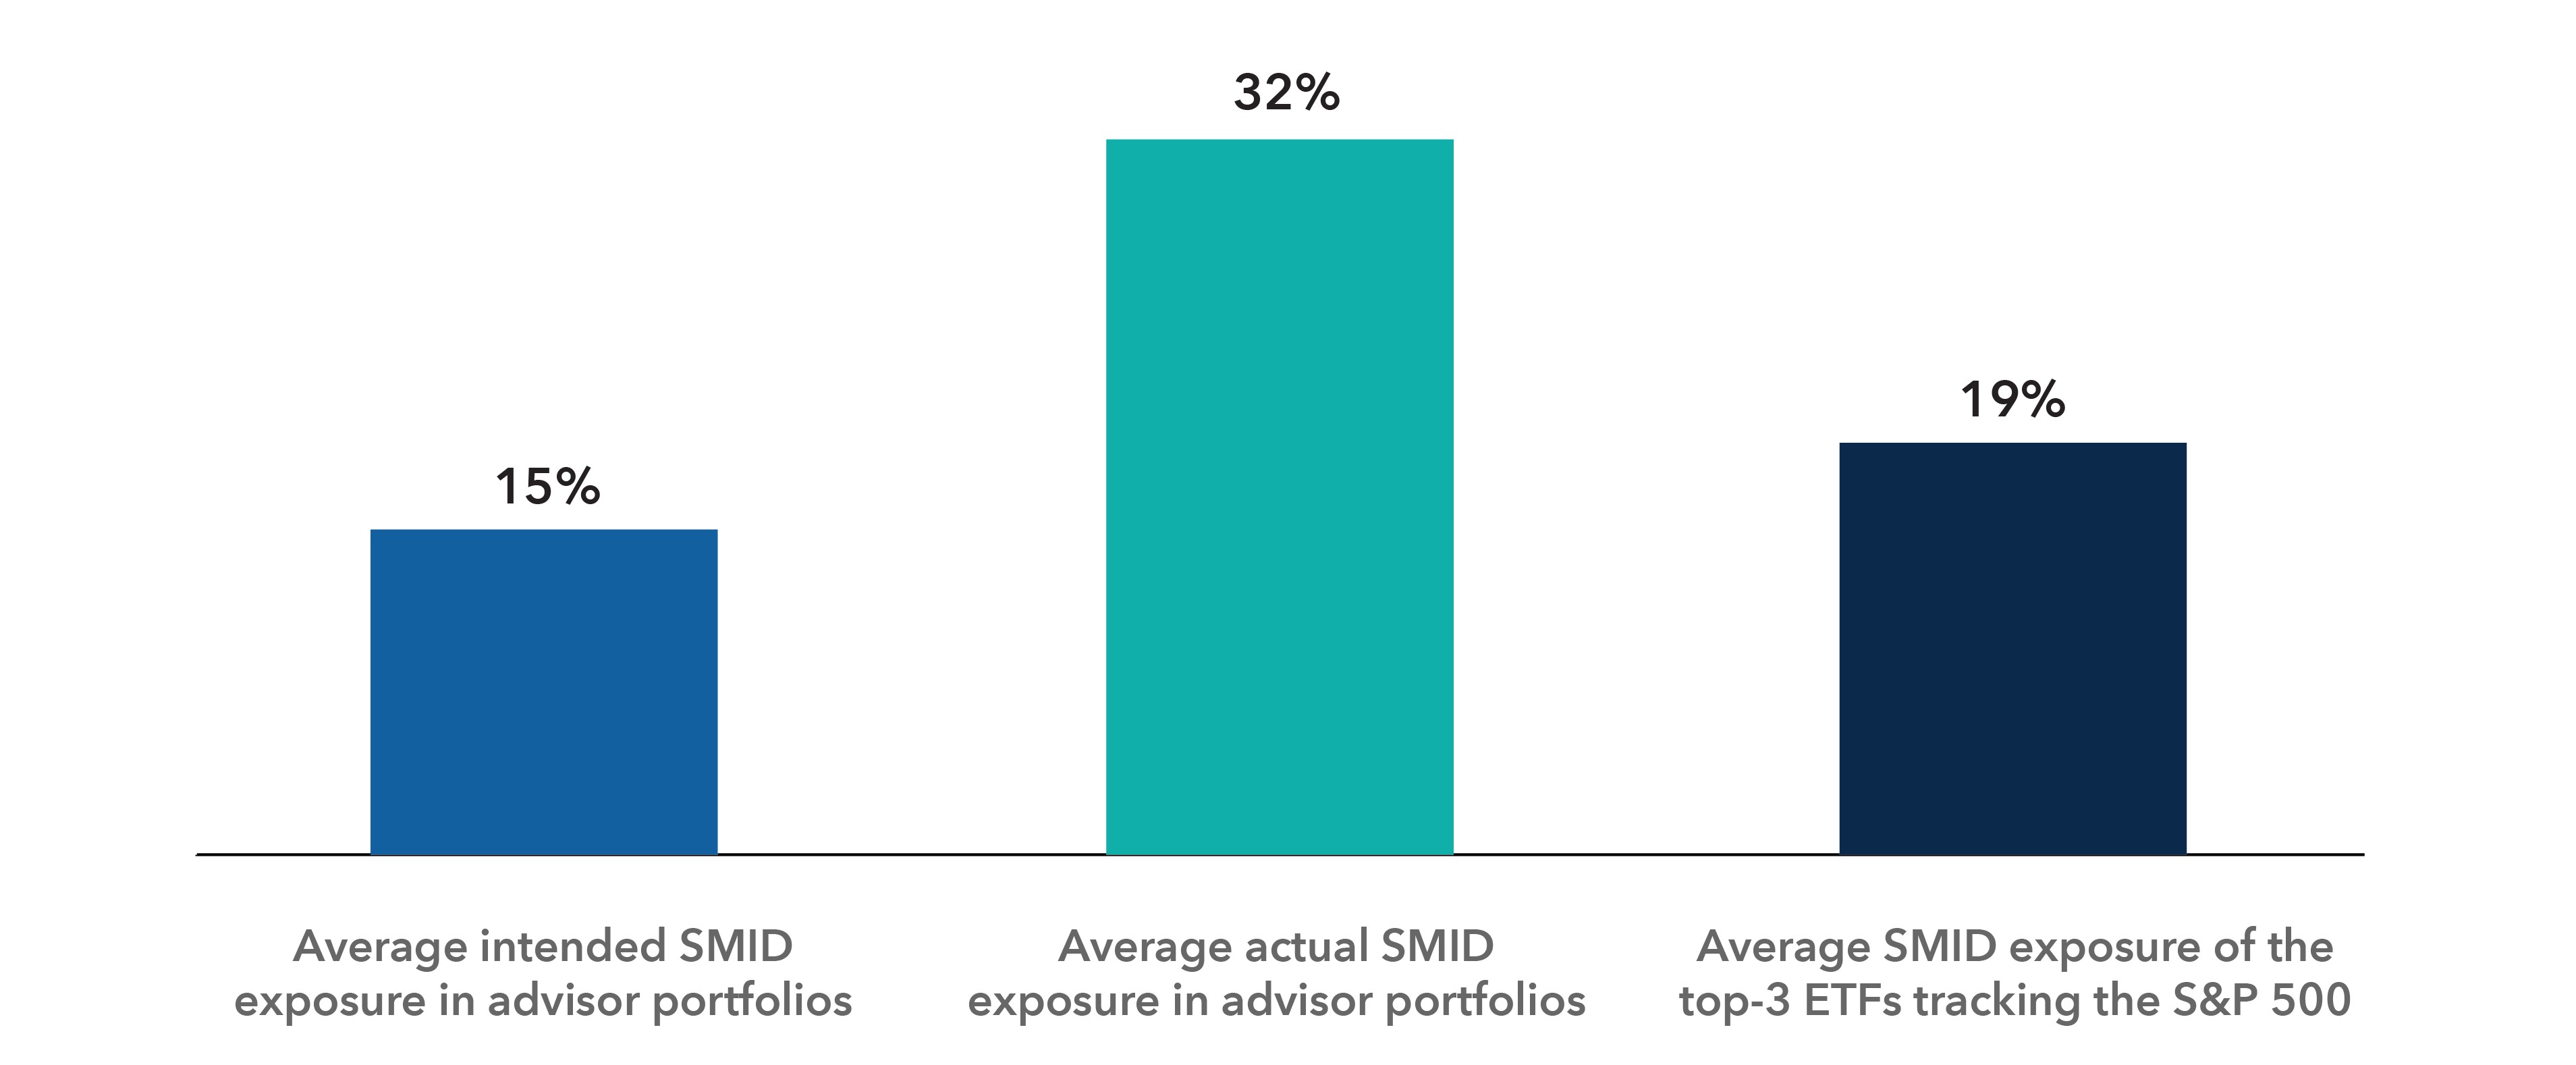
This year alone, more than 1,755 financial professionals have asked Capital Group to analyze their portfolios and provide suggestions on how allocations can help meet their clients’ financial objectives. During these reviews, we have found that many portfolios contain more exposure to SMID stocks than advisors intended. The average advisor portfolio we examined allocated 15% of its equity to SMID-dedicated strategies. But after we accounted for SMID exposure elsewhere in the portfolio, the actual average SMID exposure was more than double that — around 32% of the portfolio.


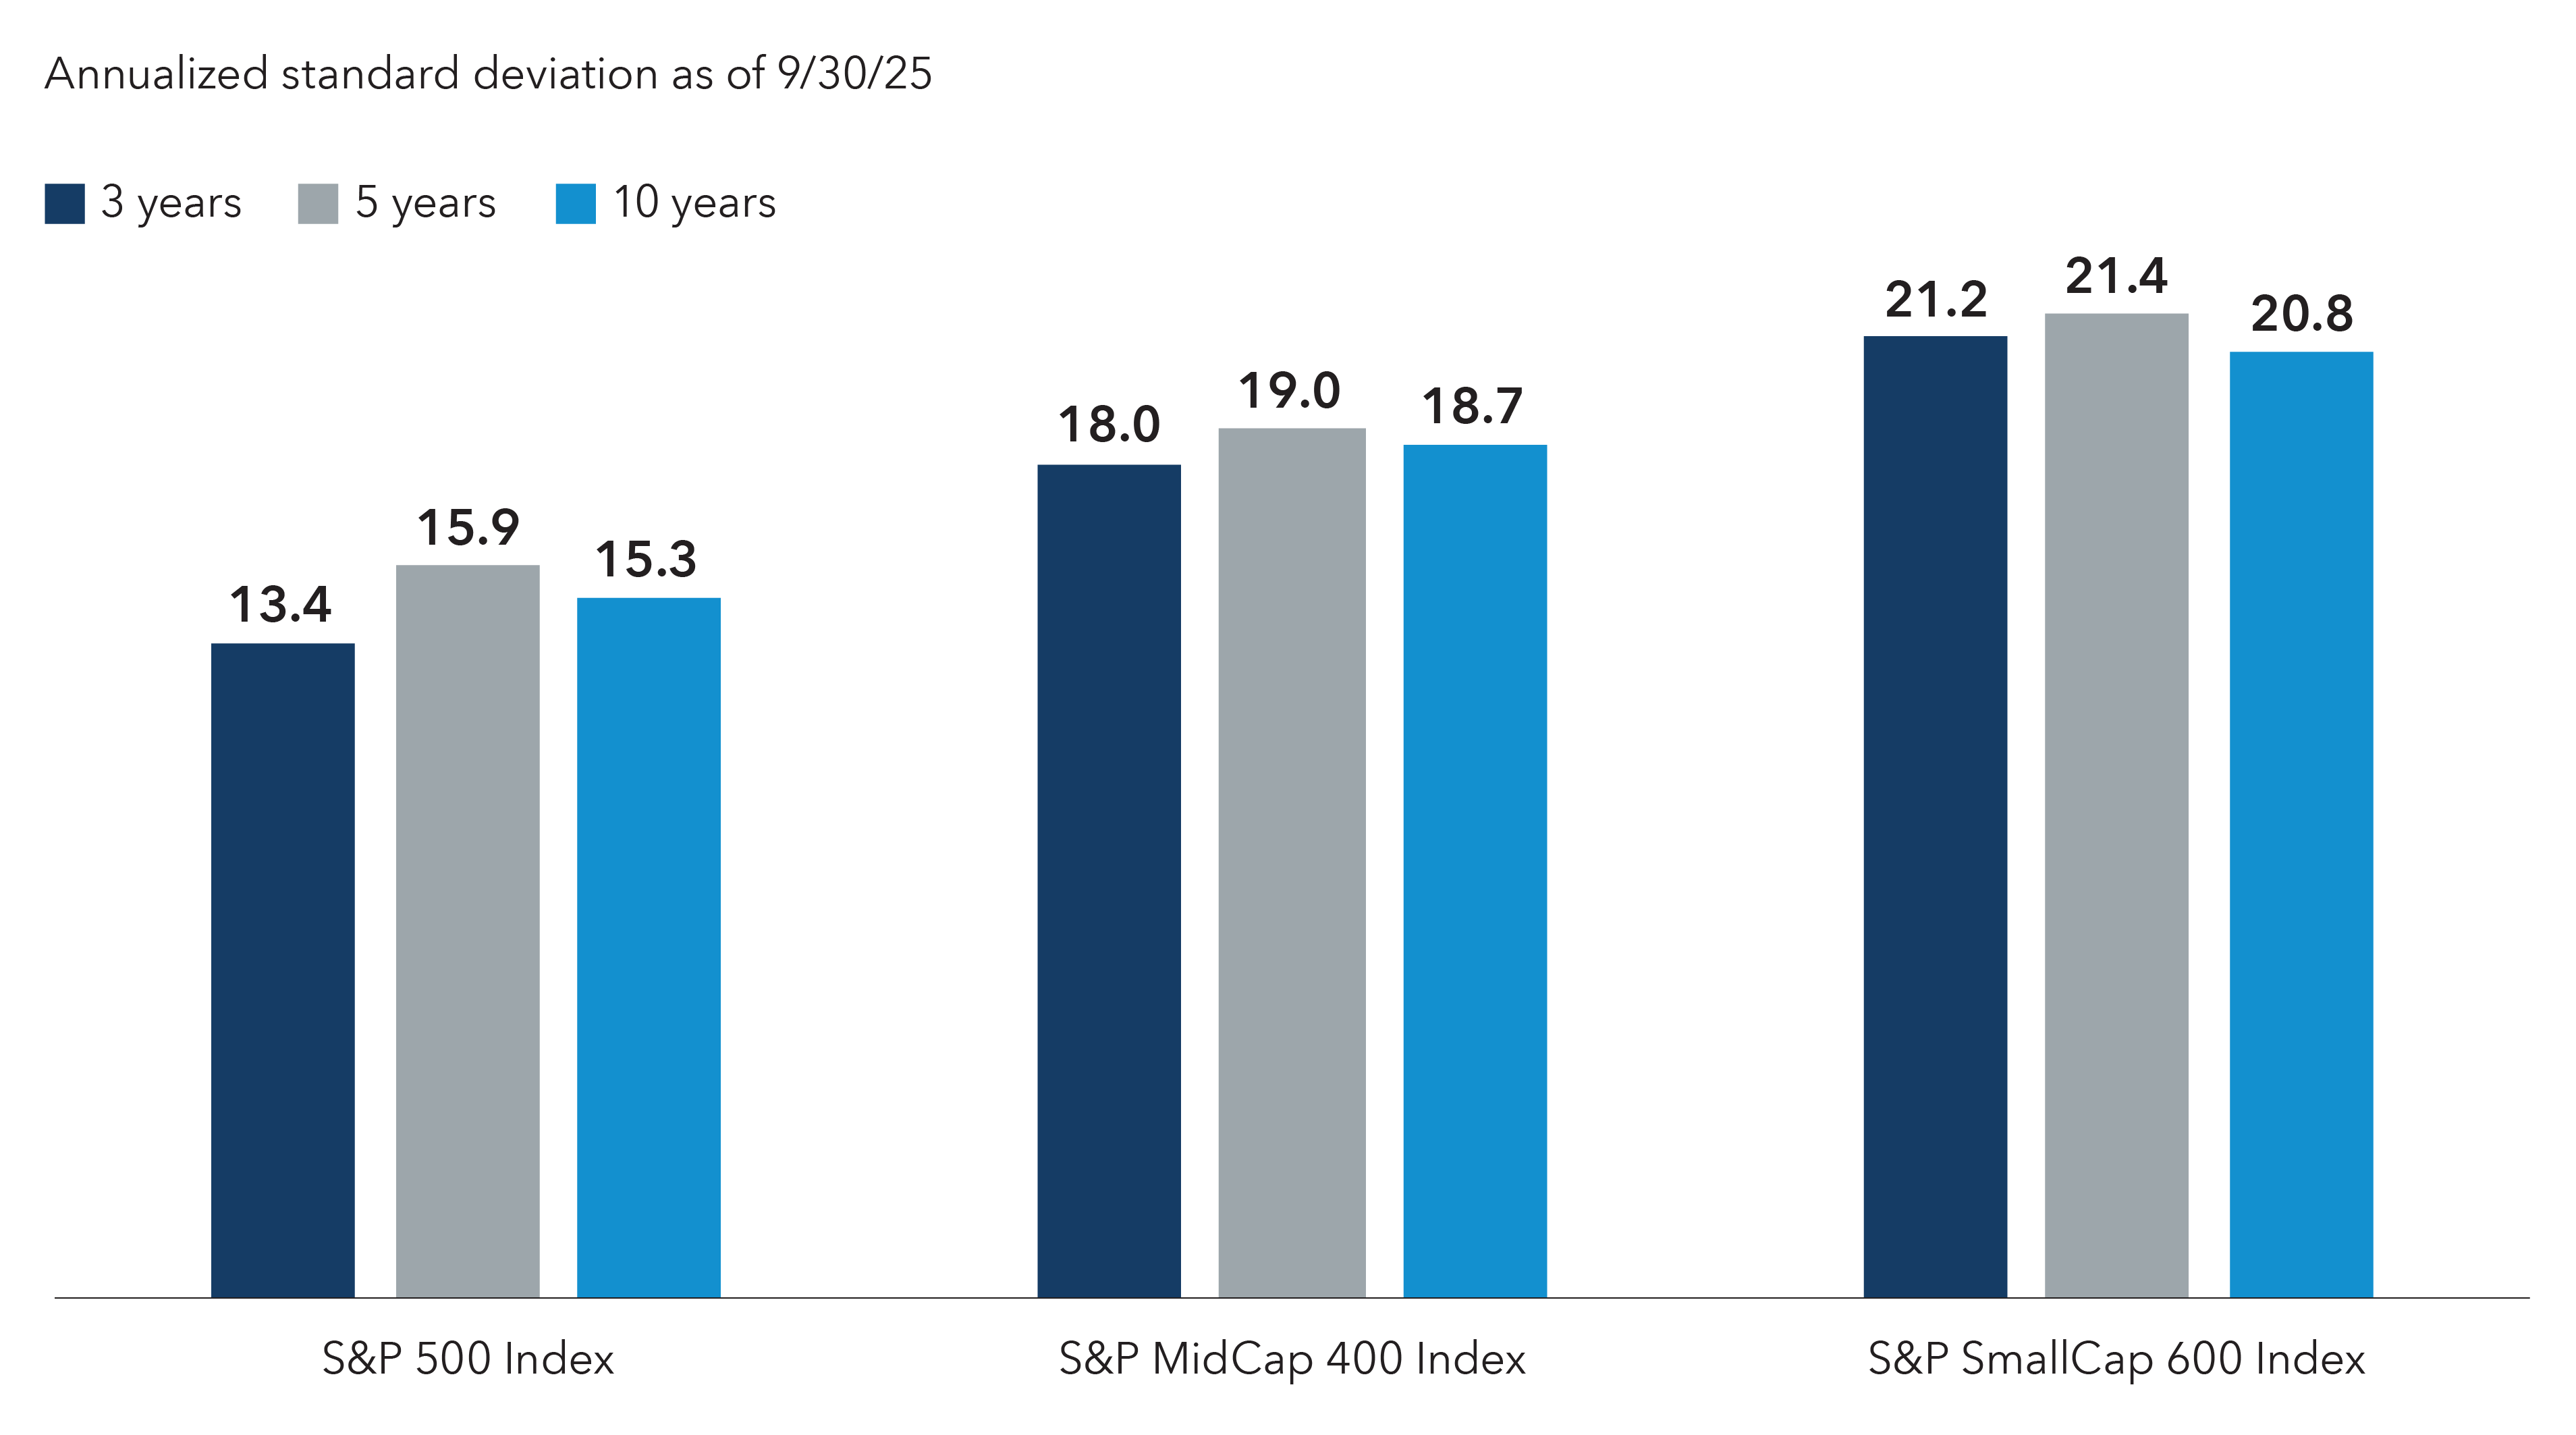
Why is that important? Small- and mid-cap equities can play a key role in a portfolio, providing diversification, growth potential and exposure to younger companies with more innovative products and business models. However, SMID stocks can also be more volatile and less liquid than their large-cap counterparts. Because of the riskiness of this asset class, financial professionals need to ensure a portfolio’s SMID exposure is sized appropriately for the investor’s objectives and risk tolerance. While there is no single “right” level of SMID in a portfolio, it’s vital that financial professionals know what they own, because unintended SMID exposure can increase volatility for investors.

Potential sources of unintended SMID

Definitions of small- and mid-cap stocks can vary. Morningstar defines large-cap as stocks that together account for the top 70% of the capitalization of the relevant market, mid-cap stocks represent the next 20%, with small-cap stocks making up the balance.


There are several potential sources of unintended SMID exposure. Indexes labeled mid-cap may have significant small-cap exposure, while active funds can have a wide range of SMID allocations even within the same Morningstar category.

Actual vs. intended SMID exposure in advisor portfolios

A bar chart comparing the average amount of intended SMID exposure in advisor portfolios to the actual average amount of SMID exposure in advisor portfolios, as well as the average amount of SMID exposure in the top three ETFs tracking the S&P 500. It shows that the actual SMID exposure in advisor portfolios (32%) is larger than both the intended SMID exposure (15%) and the ETFs tracking the S&P 500 (19%).

Source: Capital Group, FactSet, Morningstar. Top three ETFs selected based on assets under management. 

One potential cause of unintentional SMID exposure is overlapping capitalizations in different index exchange-traded funds (ETFs). The iShares Core S&P 500 ETF has 81% large-cap and 19% SMID, as one may expect. But the SPDR Portfolio S&P MidCap 400 ETF is significantly more small-cap (72%) than it is mid-cap (almost 27%), while the SPDR Portfolio S&P 600 Small Cap ETF is almost entirely small. So, if an advisor allocates to a mid-cap fund for mid-cap exposure, then a separate small-cap fund for small-cap exposure, the portfolio may end up with more small-cap than the advisor intended. Generally, mid-cap stocks are more volatile than large-cap stocks but less volatile than small-cap stocks.


An advisor concerned about the concentration of the S&P 500 may switch to an equal weighting of S&P companies. That will address concentration risk, but many of the S&P 500 companies are mid-cap. Market weighting gives you 18% mid-cap exposure, but equal weighting gives you far higher.


Even within the same Morningstar category, there can be a wide range of SMID exposures among active equity funds. The chart below plots the range of market-cap exposures among the 25 largest actively managed large-cap growth funds by assets. Although billed as “large cap,” one of the funds had 21% of its assets in SMID, including 6% in small-cap stocks. 

Fund market-cap exposure can vary

 A stacked bar chart shows the levels of exposure in 25 large-cap growth funds. The levels are categorized as large-cap, mid-cap, small-cap and SMID, and shows the highest, average and lowest values for each. Large-cap is the largest exposure by a wide margin, but for some of the funds the SMID exposure component is as high as 21%.

Source: Morningstar

Another potential cause of unintentional SMID exposure are ETFs dedicated to specific niches or sectors with significant exposure to SMID. Roughly one quarter of the advisor portfolios we analyzed included sector-specific allocations. Certain sectors have higher SMID exposure than others. As of June 30, 2025, within the S&P 500 index, the real estate, equity precious metals, energy limited partnerships and utilities sectors each had more than two-thirds exposure to SMID, compared with communications, which had only 18% SMID exposure. It’s important to consider the SMID exposure of industry-specific strategies within the entire portfolio to avoid an unintended allocation to SMID.


These hidden sources of SMID can easily push the portfolio’s SMID exposure above what an advisor envisioned. For example, the Vanguard Total Stock Market ETF — which seeks to represent 100% of the U.S. investable equity market — is around 70% large/30% SMID. So, with actual average exposures of 33%, some advisors are already skewing overweight toward SMID, even without considering differences in portfolio objectives.

SMID can contribute to higher levels of volatility

The average standard deviation for mid-cap stocks was higher than large-cap, and small-cap volatility was higher than mid-cap.

A column chart shows the standard deviation for the S&P 500 Index, the S&P MidCap 400 Index and the S&P SmallCap 600 Index for periods of three, five and 10 years. For all three timeframes, the S&P 500 Index has the lowest deviation numbers of the three, with the S&P MidCap 400 Index having higher deviations than the S&P 500 Index and the S&P SmallCap 600 Index having higher deviation numbers than both of the other indexes.

Source: S&P Dow Jones Indices LLC via FactSet

What’s the right amount of SMID for your goals?


SMID can play a valuable role in a portfolio depending on the investor’s objective and risk tolerance. For example, a sizable SMID exposure may be appropriate for a growth-oriented portfolio for investors who can tolerate higher volatility in pursuit of outsized returns. However, a high SMID allocation may not be right for a growth-and-income portfolio designed to have more moderate volatility.


Our analysis of advisor portfolios shows that some do not vary SMID exposure based on the portfolio’s objective. For example, advisors’ growth-and-income portfolios tend to have greater SMID exposure than Capital Group’s growth-and-income model portfolio. SMID exposure isn’t necessarily inappropriate for a more income-oriented model, but it’s vital that this exposure is purposeful and is helping to meet the portfolio objective.

SMID exposure by objective: Average advisor vs. Capital Group Active ETF Models*

A column chart comparing the levels of SMID exposure in advisor models to Capital Group Active ETF Models, for the categories of growth, growth and income, and income. In all three comparisons, the Capital Group Active ETF Models had lower levels of SMID exposure than the equivalent advisor model. All of the advisor models had levels of at least 30% while none of the Capital Group ETF models reached that level.

Source: Capital Group, FinMason

An intentional SMID allocation can play a valuable role in a portfolio


For growth-oriented investors, SMID stocks can offer a higher potential for return. In addition, small-cap equities tend to have low correlation to their large-cap counter parts: Over the five years ended June 30, 2025, the Russell 2000 Index had a 0.83 correlation to the S&P 500. Different market environments may favor SMID stocks. For example, SMID stocks often benefit from declining interest rates and a broadening stock market. And many U.S. SMID companies may be less vulnerable to tariffs because the firms derive most of their revenue domestically.


For Capital Group portfolios, the Capital Solutions Group (CSG) finds that SMID exposure can provide a valuable building block for portfolio construction. The asset class tends to be pro-cyclical and do well in recovery and expansionary phases of the business cycle, low-to-falling rates and inflation.


With Capital Group’s focus on objective-based models, SMID holdings can serve a role primarily in capital-appreciation-focused portfolios. Given the cyclical nature of the asset class, a longer time horizon is required to fully capture the upside potential, with characteristics of higher risk and return, and higher volatility less suitable for portfolios with a capital-preservation objective. As a secondary role, it can act as a diversifier of sources of returns alongside large-cap exposure.


As a diversifier, the U.S. small- and mid-cap universe is much less concentrated in top holdings than U.S. large caps. Although the top 10 holdings represent less than 10% of the small- and mid-cap benchmarks, the S&P 500 concentration is reaching historic highs. The SMID universe is also less concentrated across sectors versus U.S. large caps.


Intentional SMID exposure can be a valuable component of many portfolios, but unintentional exposure has the potential to increase portfolio volatility to an uncomfortable level. Review your portfolios at regular intervals to ensure that the market-cap exposure is consistent with the client’s investment objectives. 

Mark Barile is a Senior Manager, Portfolio Consulting and Analytics with 20 years of industry experience as of 12/31/2025. He holds a bachelor's degree in studio art from Trinity University. He also holds the Certified Investment Management Analyst® designation.

©2025 Morningstar, Inc. All rights reserved. The information contained herein: (1) is proprietary to Morningstar and/or its content providers; (2) may not be copied or distributed; and (3) is not warranted to be accurate, complete, or timely. Neither Morningstar nor its content providers are responsible for any damages or losses arising from any use of this information. Past performance is no guarantee of future results.


The S&P 500, S&P MidCap 400, S&P SmallCap indexes are products of S&P Dow Jones Indices LLC and/or its affiliates and have been licensed for use by Capital Group. Copyright © 2025 S&P Dow Jones Indices LLC, a division of S&P Global, and/or its affiliates. All rights reserved. Redistribution or reproduction in whole or in part is prohibited without written permission of S&P Dow Jones Indices LLC.

Investments are not FDIC-insured, nor are they deposits of or guaranteed by a bank or any other entity, so they may lose value.
For financial professionals only. Not for use with the public.
Investors should carefully consider investment objectives, risks, charges and expenses. This and other important information is contained in the mutual fund prospectuses and summary prospectuses, which can be obtained from a financial professional and should be read carefully before investing.
Statements attributed to an individual represent the opinions of that individual as of the date published and do not necessarily reflect the opinions of Capital Group or its affiliates. This information is intended to highlight issues and should not be considered advice, an endorsement or a recommendation.
All Capital Group trademarks mentioned are owned by The Capital Group Companies, Inc., an affiliated company or fund. All other company and product names mentioned are the property of their respective companies.
Use of this website is intended for U.S. residents only.
This content, developed by Capital Group, home of American Funds, should not be used as a primary basis for investment decisions and is not intended to serve as impartial investment or fiduciary advice.
Advisory services offered through Capital Research and Management Company (CRMC) and its RIA affiliates.