

When yields start rising, no fixed income sector may feel safe. Since rates expectations began climbing toward the end of the third quarter, the Bloomberg U.S. Aggregate Index has fallen by 2.91% year to date through September. While municipal (muni) bonds are expected to act as a high-quality safe haven, they fared even worse, down 4.18% for the same period (represented by the Bloomberg Municipal Bond Index). Rising rates and technical factors have mostly driven this weakness. But rather than being reactive, investors should look ahead. We believe that fundamentals remain solid and recent weakness provides a stronger entry point for investors looking for high-quality tax-exempt income.
October 21, 2026
Rising rates and challenging technicals created a perfect storm for munis
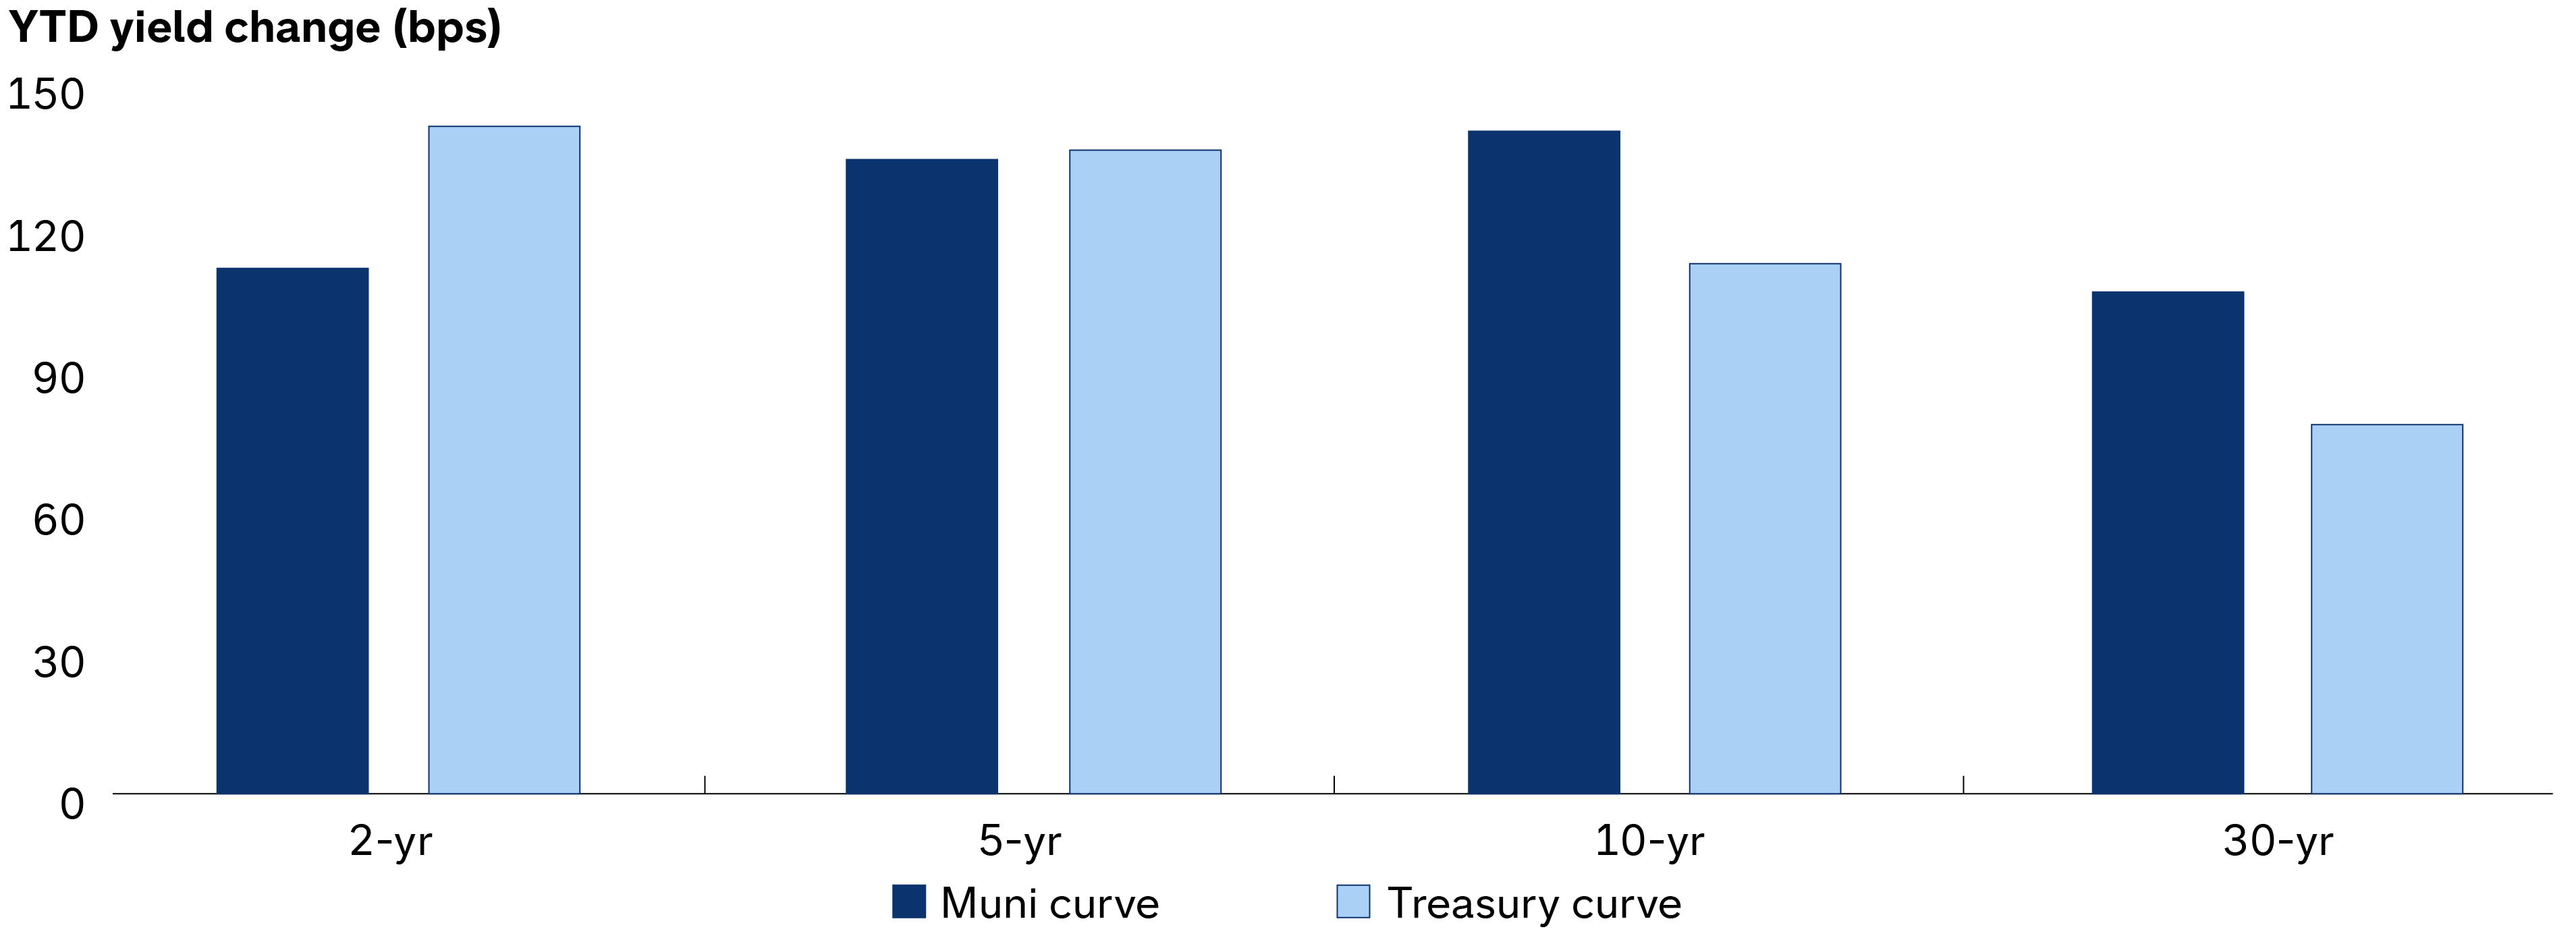
This isn’t the first bout of volatility for munis in recent years. The sector also saw outflows in early 2025 due to several factors including some investors fearing their tax-exempt status may be threatened. Returns also fell alongside those of other bonds in 2022 as the U.S. Federal Reserve (Fed) aggressively raised rates. As seen with many other types of fixed income, municipal bond prices decline when yields rise – which makes one reason for their recent performance easy enough to understand. The muni curve often reacts in similar ways as the Treasury yield curve as rates rise. In this case, it has shifted upward to an even greater extent this year, especially on the long end.
The muni curve has shifted more than Treasuries at the long end
Source: Bloomberg. As of 9/30/26.
While changing rates expectations had the most impact, they aren’t the whole story. Technical factors also weighed on the market. New issuance supply has been nearly double that of 2025 comparing each year through September – and 2025 maintained the trend of rising issuance levels. Rising issuance has been driven by infrastructure needs, dwindling pandemic stimulus impacts and fading federal support of state and local governments. Rising borrowing costs and higher inflation have also been drivers. Meanwhile, demand in the third quarter – when the sector’s performance turned negative – tends to be weak from a seasonal perspective. Finally, some investors are selling munis for tax-loss harvesting purposes.
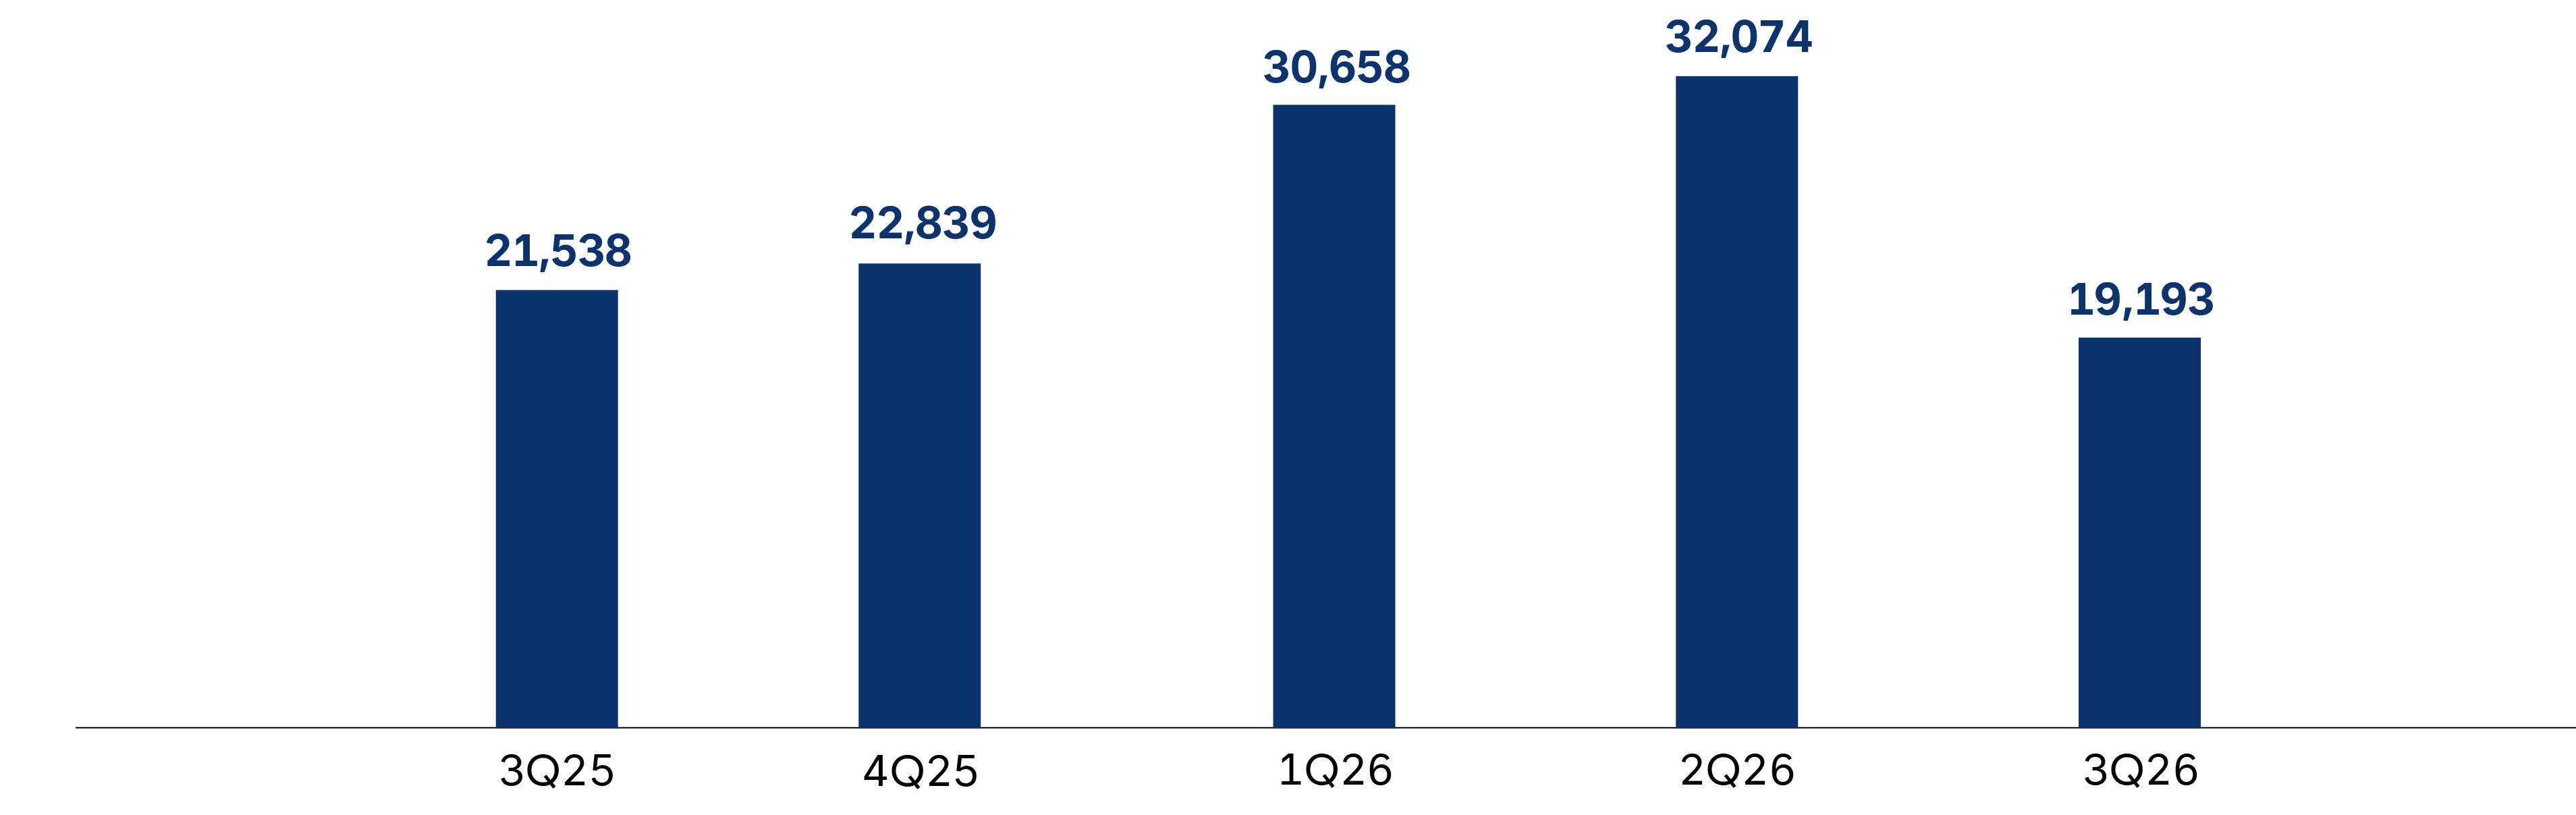
These issues appear to have quashed mounting momentum for muni sector fund flows. The sector saw weaker flows in the third quarter, following historically strong inflows in previous quarters.
Estimated muni fund net flows ($M)
Source: Morningstar. Numbers calculated by adding up data flows of mutual funds and exchange-traded funds (ETFs) in the Morningstar US Muni Category Group. Numbers are estimated. Data as of 9/30/26.
A repriced market is now ripe for investors
Another fixed income fact that also applies to munis: The market prices interest rate hike expectations into bond yields ahead of actual Fed action. At this time, the market is pricing three to four additional rate hikes through the end of 2027. That means yields should not move noticeably higher from here due to those anticipated Fed hikes – as long as that expectation holds and the market’s prediction comes to pass. In that scenario, additional Fed-induced pain would be minimal.
However, investors should consider other possible scenarios: The market could be underestimating or overestimating the degree to which monetary policymakers will need to raise rates to grapple with inflation pressures. Many of our portfolio managers – and the Fed itself – project fewer hikes. Most of our muni team favors a modest overweight to duration, a measure of interest rate sensitivity where more exposure can help or hurt if yields fall or rise, respectively. They believe that inflation pressures should moderate over time. If a more dovish outcome plays out, then yields could decline, benefiting that position – and municipal bonds more broadly.
This all comes amid fundamentals looking extremely strong. We believe the resilient U.S. economy, buoyed by the AI boom, should keep tax revenues at solid levels. State rainy-day funds were at an aggregate $174.2 billion in savings at the end of fiscal 2025, maintaining a level near their all-time highs reached in recent years.
On the revenue bond side, continued economic growth should help. Many issuers on this side of the market should have somewhat predictable revenue as long as recession remains a distant worry. We believe some corners of the sector should provide greater relative value, such as housing-related muni bonds. As solid demand and persistent shortages for affordable housing persist, these bonds should perform. Other sectors we prefer, like pre-paid gas and senior living, also have macroeconomic dynamics in their favor.
And although seasonal demand was predictably tepid in the third quarter, we expect muni demand to pick back up, driven by separately managed account (SMA) and exchange-traded funds (ETF) investors. These had a notable impact recently on the market and should continue to provide a tailwind on demand.
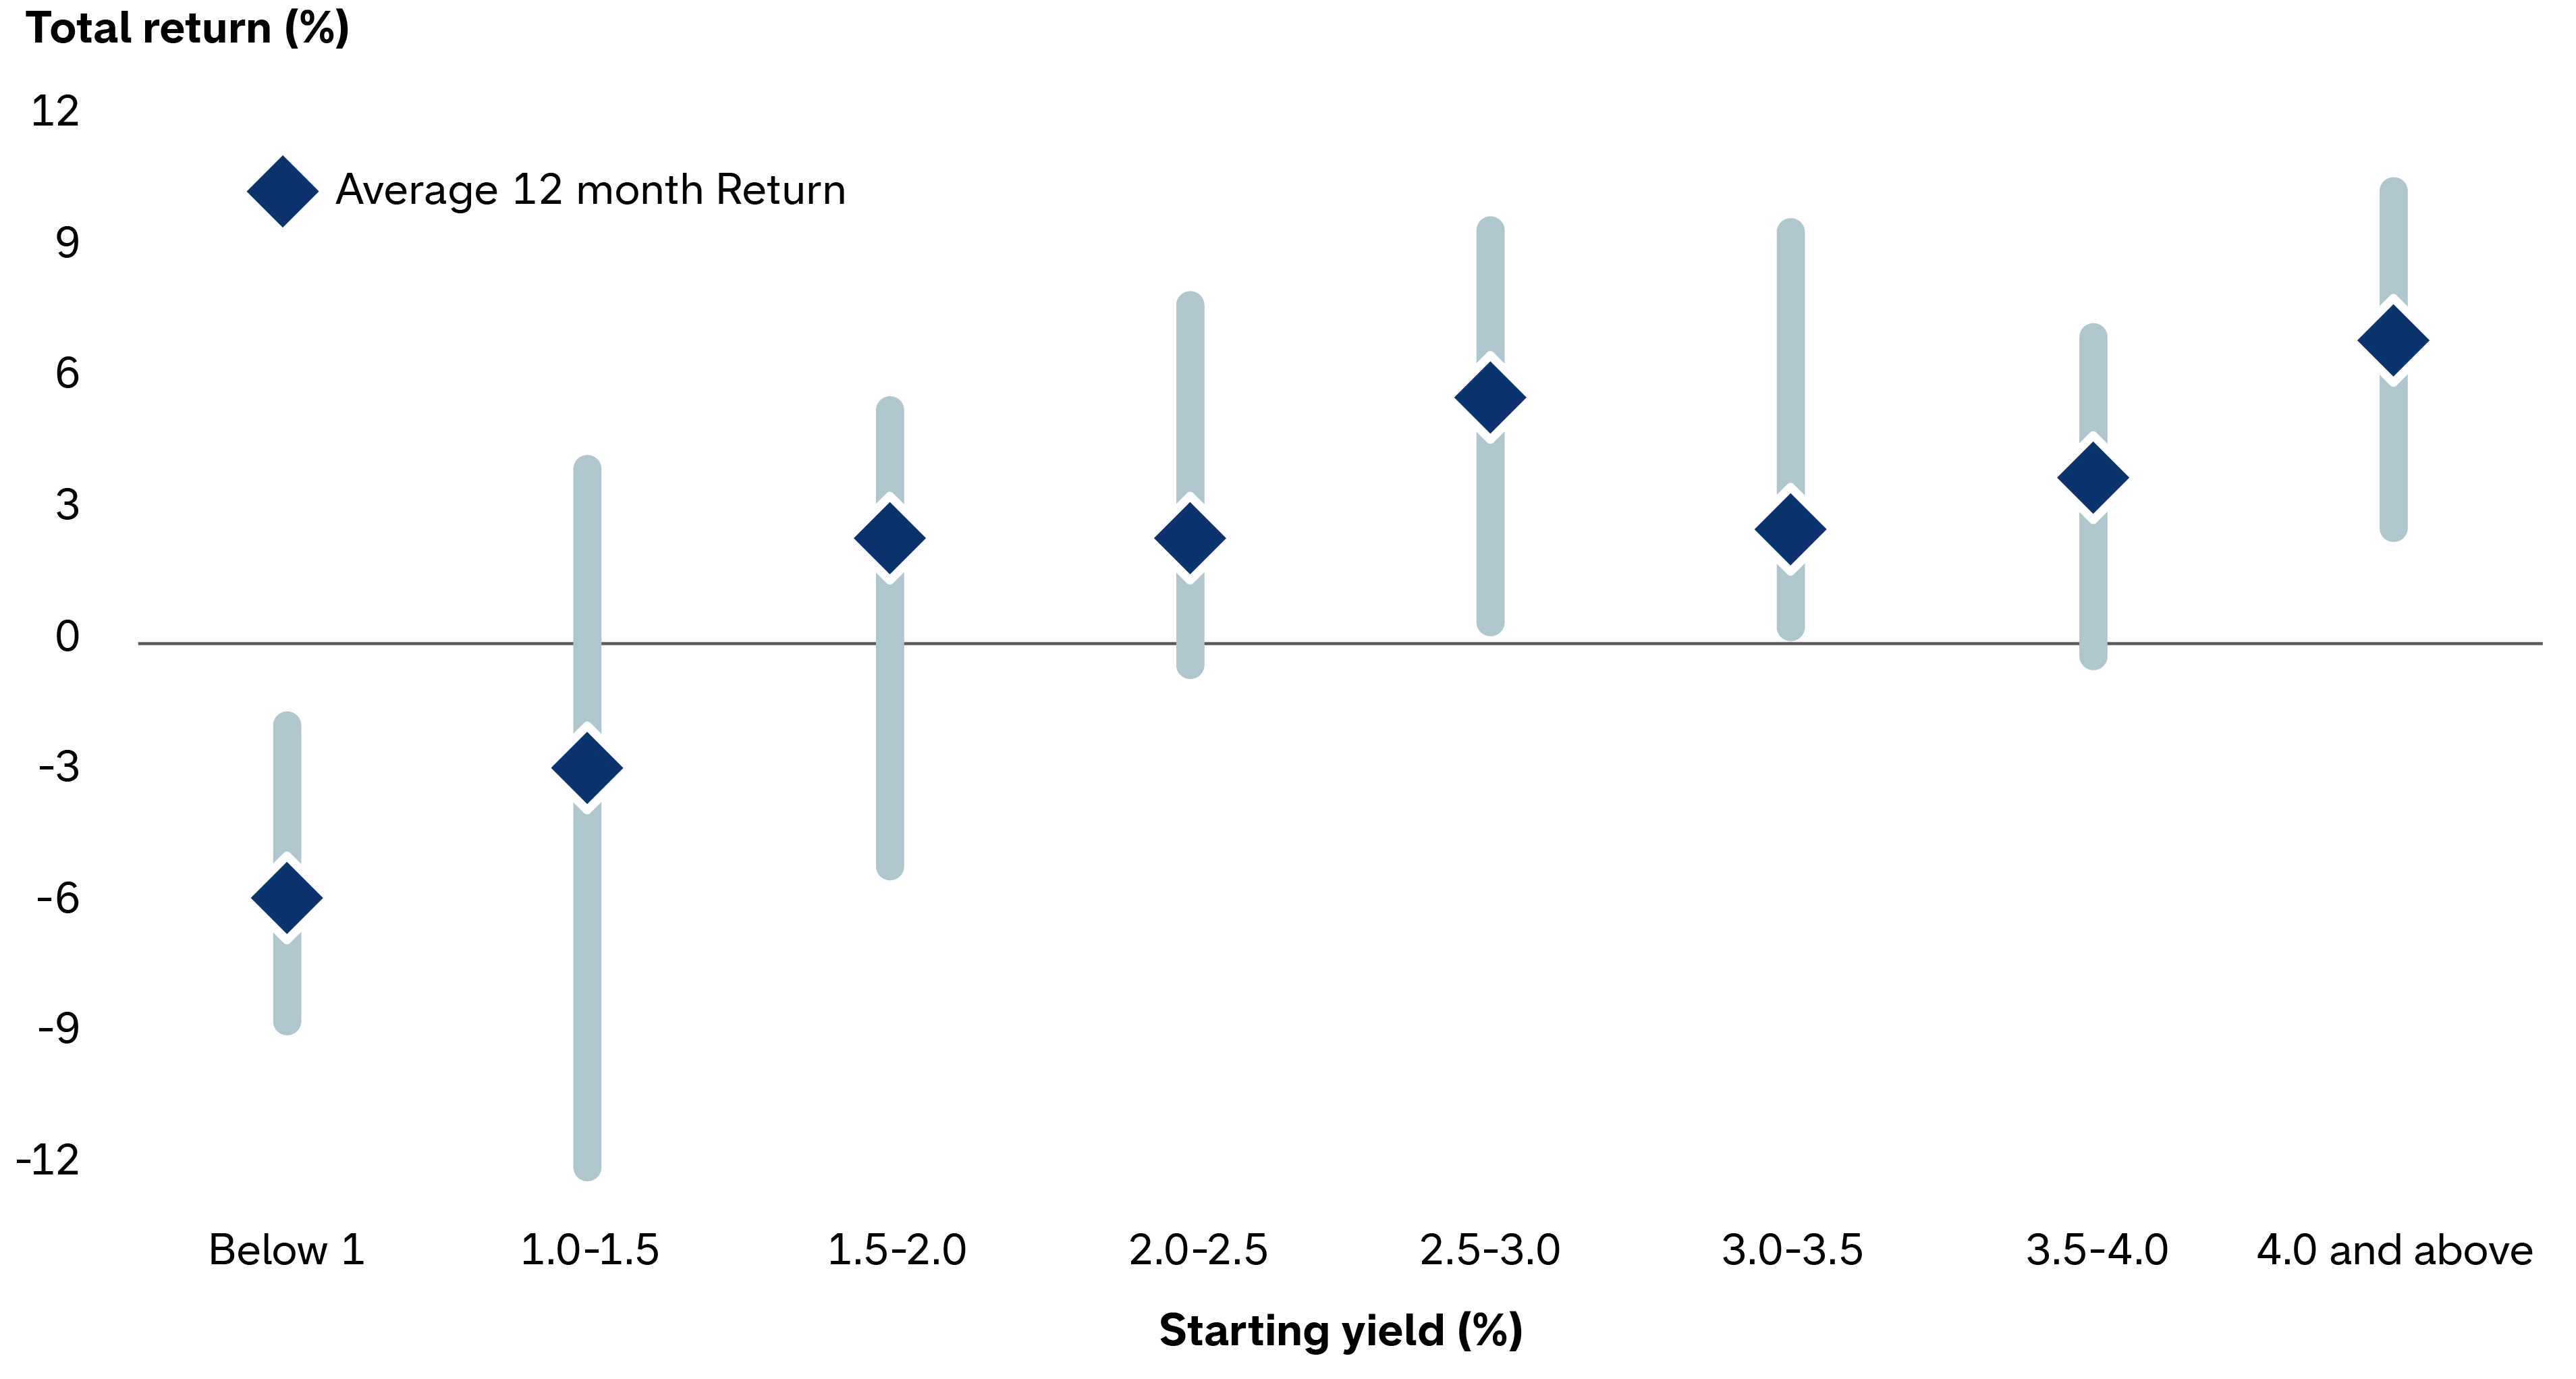
Having those higher priced-in rates boosting today’s muni yields provides another advantage: With strong fundamentals intact, muni investors are getting paid even more for high-quality bonds. Our portfolio managers have a prudent approach to adding lower quality bonds that have the potential to provide higher yields amid tight valuations. But even when maintaining a high-quality stance, current yields provide some very compelling investment outcomes: The Bloomberg Municipal Bond Index’s yield to worst was up to 4.8% at the end of September 2026 from just 3.3% at the end of February. That’s a significant yield pickup without any indication of deteriorating fundamentals. At recent levels, municipal bond yields are nearing 10-year highs. Historically, higher yields have provided higher forward returns: When yields are 4% or higher, the average 12-month return has averaged 6.4% over the past 20 years.
Yields 4% or higher produced strong returns in the following 12 months
Source: Bloomberg. Based on 110 monthly rolling observations from September 2017 to September 2026 using the Bloomberg Municipal Bond Index. Gray bars represent range of returns.
What could this shift mean for investor portfolios? As opportunities arise offering today’s higher yield levels, stronger income potential will be passed on to muni bond investors. This comes alongside our view that fundamentals are strong and should adhere to historical default rates. On that metric, muni bonds have provided better quality from a default standpoint than their corporate counterparts at similar ratings. When accounting the tax benefit for investors in the highest federal tax bracket, the picture becomes very compelling.
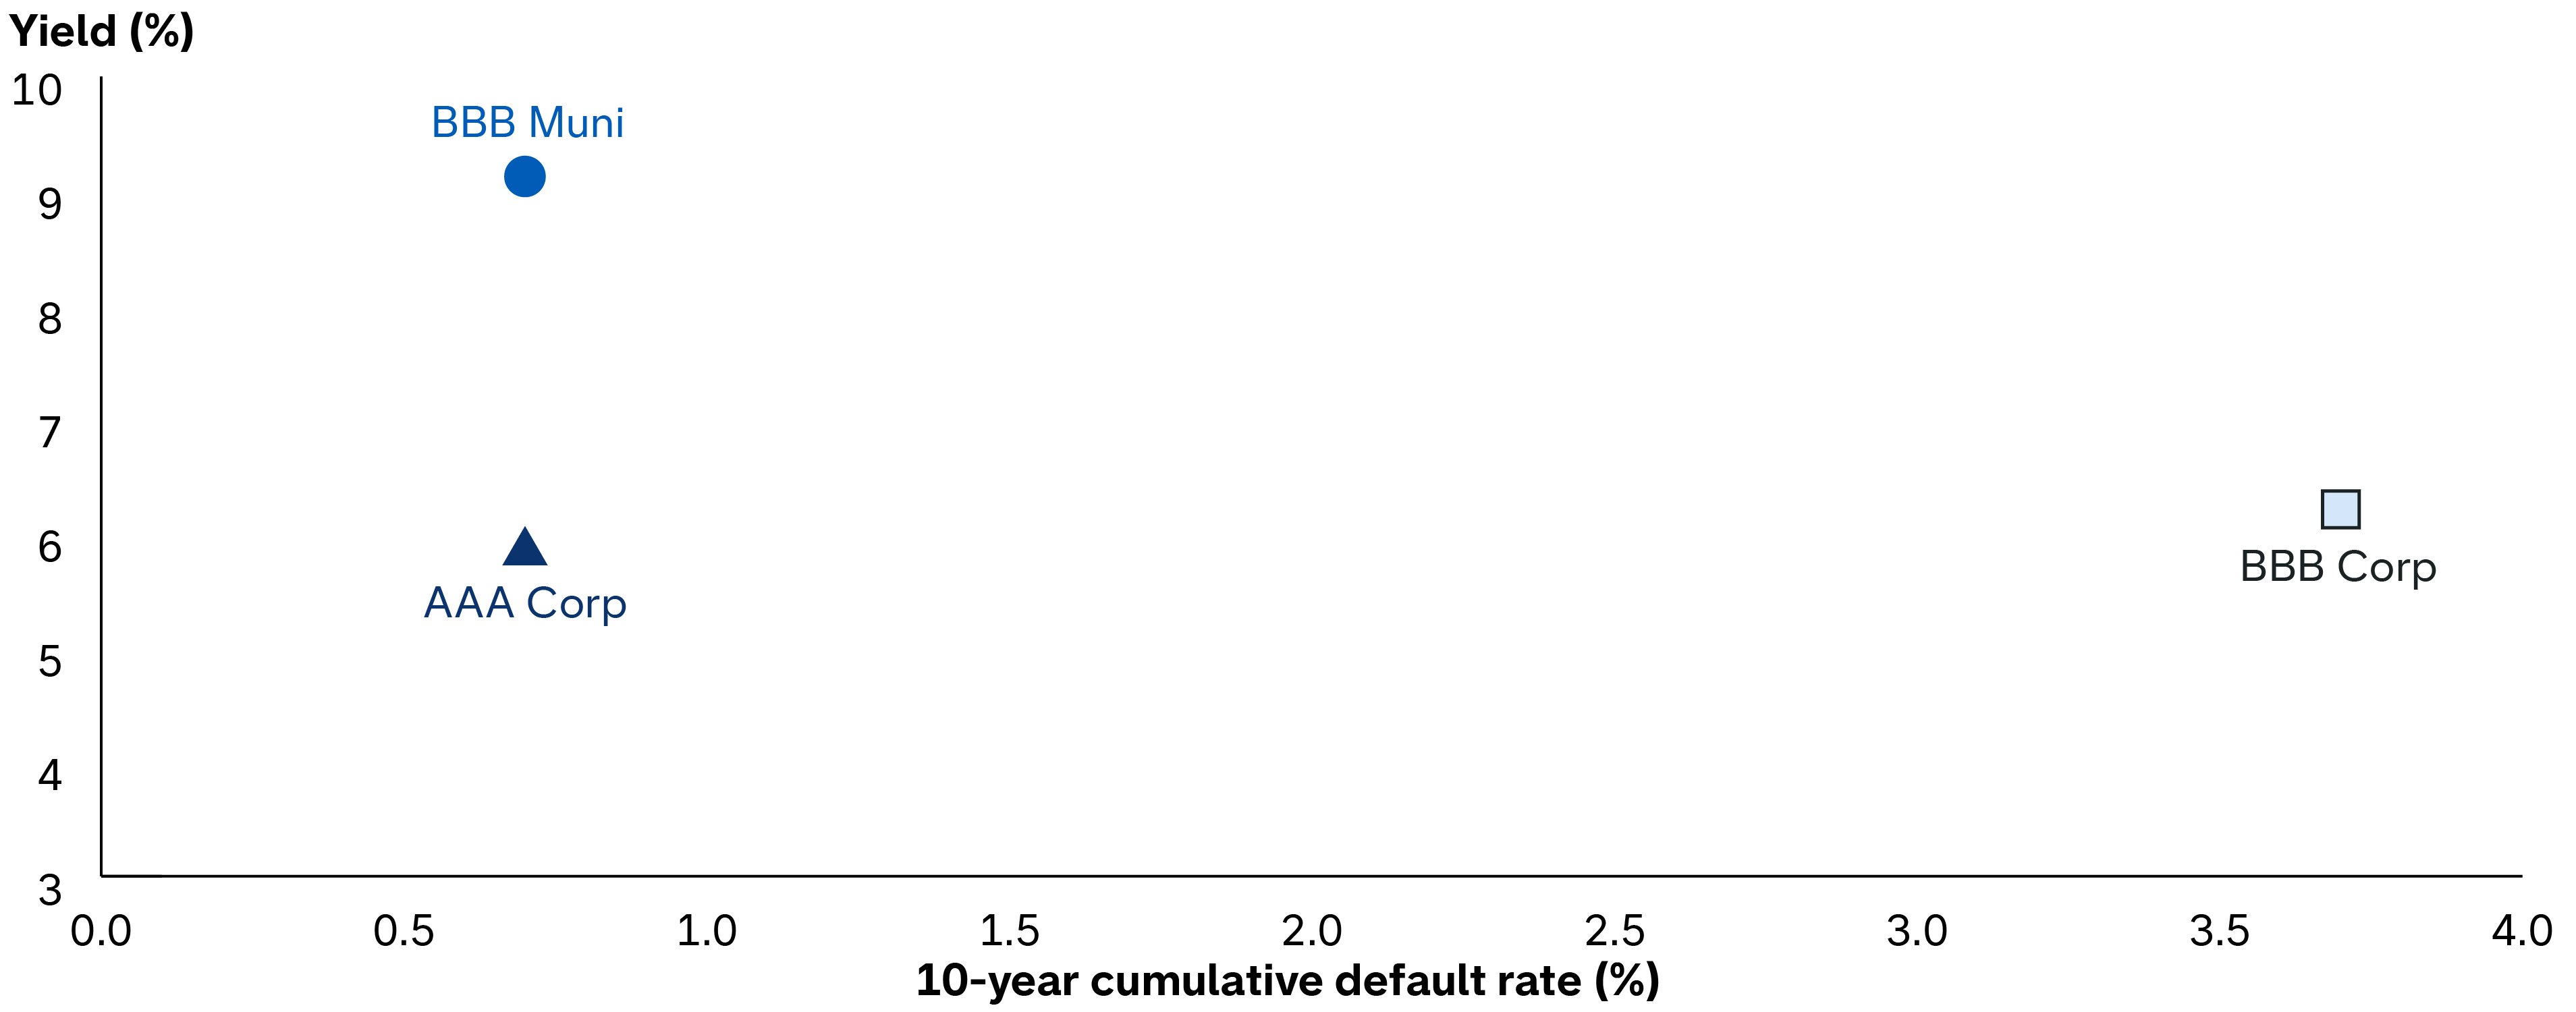
Tax-equivalent yield provides a compelling advantage for munis relative to corporate default rates
Source: Bloomberg index data sourced from Barclays Live on 10/1/26, all data as of 9/30/26. BBB Muni reflects the Bloomberg Municipal Bond BBB Index, which represents the BBB-rated portion of the Bloomberg Municipal Bond Index. AAA Corp reflects the Bloomberg U.S. Corporate Investment Grade AAA Index, which represents the AAA-rated portion of the Bloomberg U.S. Corporate Investment Grade Index. BBB Corp reflects the Bloomberg U.S. Corporate Investment Grade BBB Index, which represents the BBB-rated portion of the Bloomberg U.S. Corporate Investment Grade Index. Highest federal tax rate assumes the 3.8% net investment income tax and a 37% top federal marginal tax rate for the current tax year, for a total federal tax rate of 40.8%; applicable to BBB Muni only.
Ratings standards for government issues have traditionally been stricter than for corporates. As the chart shows, BBB-rated munis have default rates comparable to AAA-rated corporate bonds. And when considering the tax-equivalent yield at the highest tax bracket, the additional potential income from munis provides a stark contrast at a similar level of risk. BBB-rated corporate bonds have 5x the default rate of BBB-rated muni bonds, while providing nearly 300 basis points less yield on a tax-equivalent basis.
A prime time to build a muni allocation?
Our investment team’s muni outlook remains constructive amid the recent volatility, which allows us to take advantage of new opportunities. At current yields, entering this space may be a particularly compelling proposition for investors in higher tax brackets looking for a high-quality fixed income allocation that has the potential to provide diversification from equities. Alongside ample after-tax income, higher yields provide more price appreciation potential if the economy hits a rough patch and rates drift lower. In this environment, investors have the potential to gain more while positioning for less portfolio risk by owning munis.

Vikas Malhotra is a fixed income portfolio manager with 14 years of industry experience (as of 12/31/2025). He holds an MBA from the University of California, Los Angeles and a bachelor's degree in business administration from the University of California, Berkeley. He also holds the Chartered Financial Analyst® designation.

Ingrid Parl is an investment director with 15 years of investment industry experience (as of 12/31/2025). She holds a bachelor's degree in political science and psychology from Wesleyan University.