
October 16, 2026
KEY TAKEAWAYS
- Managers presently see opportunities in areas including municipal yield curve dynamics, certain sectors and select issuers.
- Active management may have an advantage in this period of increased uncertainty.
- While passive management may provide lower fees, it can limit potential.
Uncertainty permeates today’s market. From economic growth to interest rates to inflation, investors face a multitude of questions. Today’s challenges may not be conducive to a passive “set it and forget it” investment style: research can sometimes provide answers or clarity. Currently, our active municipal (muni) bond managers seek to leverage ambiguity and find value in key areas including positioning along the muni yield curve, selective security exposure in tax assessment/tax allocation bonds and out-of-index subsectors like prepaid gas.
Assessing value along the yield curve
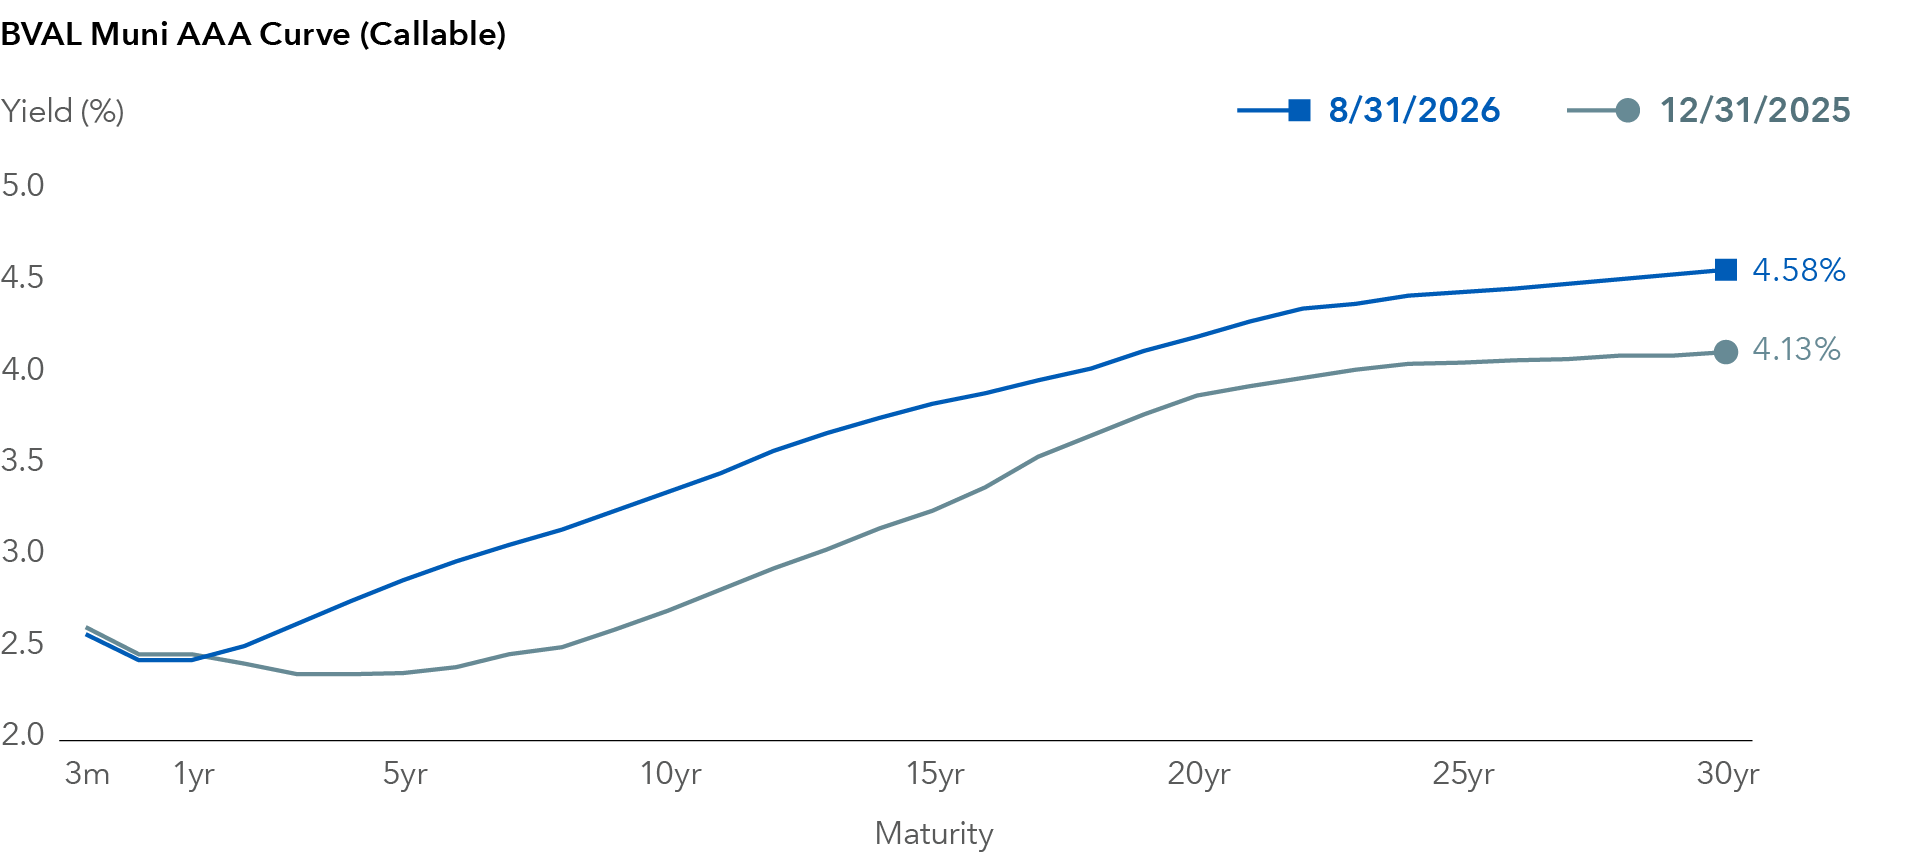
Over the past few years, we had noted that some parts of the muni yield curve were inverted, wherein some shorter term yields were higher than some longer term yields. When it inverted, we invested around the conviction that the curve would normalize in time as has historically been the case. This played out over time, with longer term yields eventually rising relative to shorter term yields. In contrast, passive strategies are tied to the curve and duration (the sensitivity of a bond to changes in interest rates) exposure of the index they track.
As active managers, we also work to understand how and when the rates move. Recently, we have been focusing on the 5- to 10-year segment of the curve. Historically, exposure was structurally expensive here as investors favored this maturity segment. Capital Group managers often took a barbell approach, taking positions on shorter and longer bonds, and avoiding the “belly” of the curve because it was less compelling. Supply dynamics played in here: For years, roughly 80% of the muni supply was 10 years and longer, with less than 20% inside of 10 years. However, the market was hit with a surprise this year – 40% of the issuance has been 10 years or less. This additional supply improved valuation dynamics, cheapening the opportunity to own bonds with these intermediate exposures. We believe demand will support higher prices when that supply normalizes to lower levels. This is an example of how active management provides flexibility to react when the yield curve shifts.
Yields rising in the intermediate part of the curve provides an opportunity
Source: Bloomberg. As of 8/31/26. The muni curve is represented by the BVAL (Bloomberg Valuation Service) Municipal AAA Curve (Callable). Bond ratings, which typically range from AAA/Aaa (highest) to D (lowest), are assigned by credit rating agencies such as Standard & Poor's, Moody's and/or Fitch, as an indication of an issuer's creditworthiness.
Identifying stand-out sectors
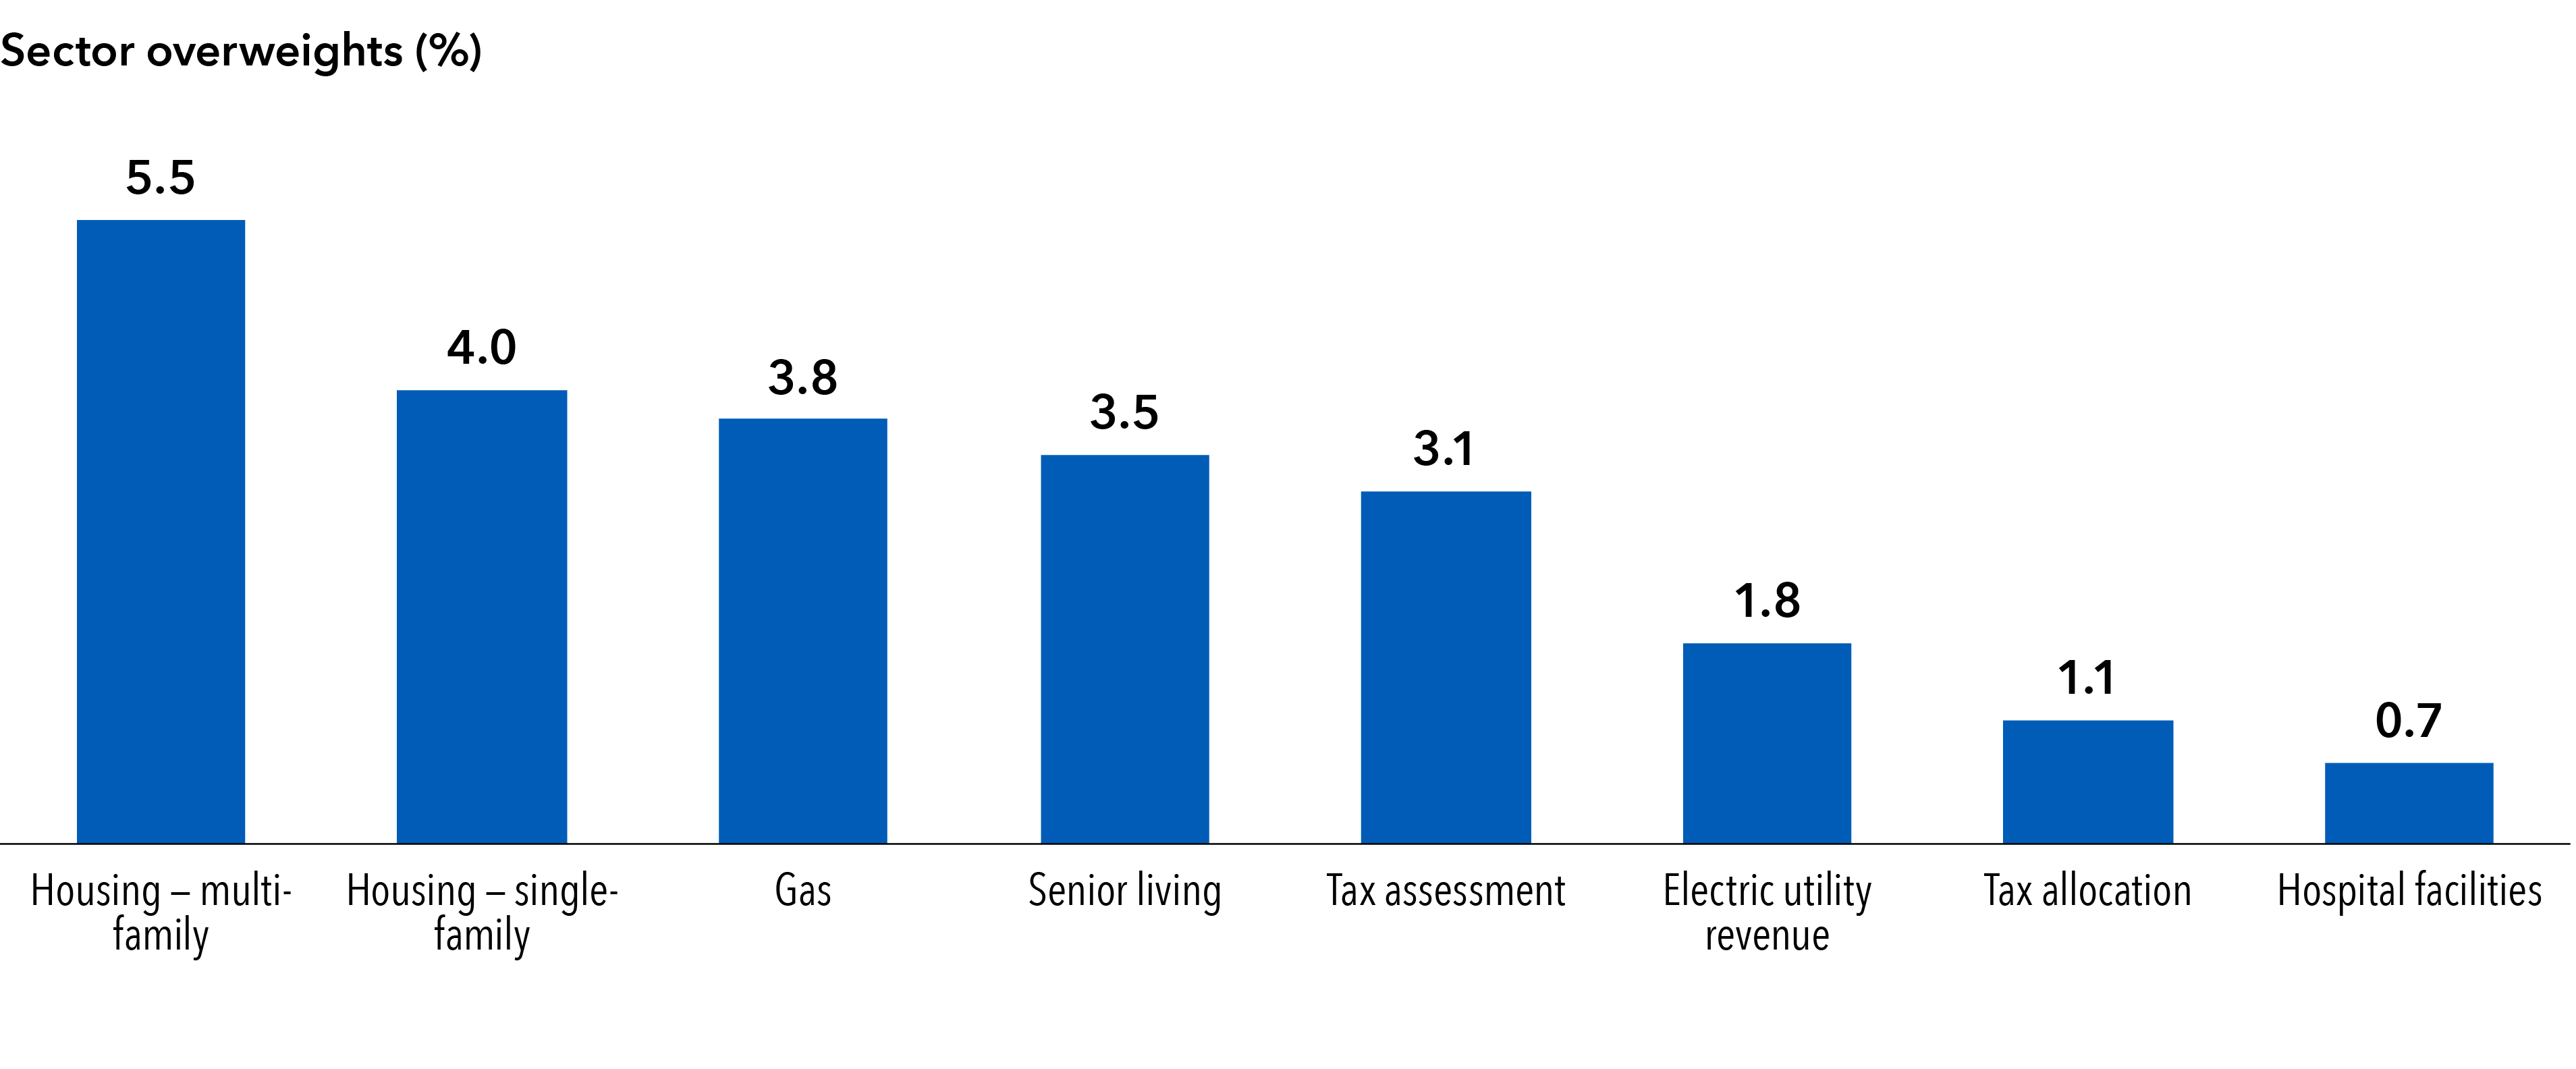
Replicating a benchmark provides no opportunity for a portfolio to be overweight or underweight sectors or securities based on research. In our active portfolios, some overweights have been made in tax assessment/tax allocation (“dirt bonds”), prepaid gas and senior living. Passive management would typically have zero or very little exposure to these sectors.
Senior living is deemed a compelling investment space, offering participation across a range of deal sizes. The macroeconomic fundamentals are strong. It enjoys high margins, potential to maintain pricing discipline and relatively wide spreads. It also benefits from a demographic tailwind: 1 in 6 Americans are over 65, and senior living is one of the fastest growing sectors in real estate, according to RentalRealEstate.com. The senior living space is broad, with more than 46,000 communities nationwide as of June 2026. Opportunities can vary significantly in transparency and risk profile, which is why vigorous research is an essential component in this sector.
Prepaid gas bonds could represent another attractive investment opportunity. These bonds are backed by large banks or insurance companies and involve an upfront purchase of long-term energy supply. This provides municipalities a reliable way to plan and stabilize gas or energy costs over an extended period. The sector’s spreads are higher than what can typically be captured in the taxable market at a similar level of risk. Due to the large supply that has entered the municipal bond market, the yields are at attractive levels. Passive managers generally do not participate here, making it a differentiated opportunity for active managers with the ability to evaluate these issuers and the flexibility to invest in these bonds.
Dirt bonds are a special type of tax assessment/tax allocation bond, representing raw land earmarked for development, such as a single-family home community, a school or a multi-tenant office building. Bond proceeds are used for the neighborhood’s infrastructure, such as sewer setup and service, roads or water. Investing in this space requires hands-on research; for example, site visits may be conducted to verify development is in motion. Additional research is needed to determine the appropriate vintages (the year the bond was created) to own. Older vintages are typically further along in development and may offer less risk while potentially offering significant total return. This is another space where passive managers have little to no exposure, leaving a distinct opportunity for active managers who have the ability to identify which dirt bond deals could be best positioned to enhance a portfolio’s overall return profile.
Notable sector portfolio overweights vs. benchmark
Source: Capital Group. As of 6/30/26. Benchmark is Bloomberg Municipal Bond Index. Example sector overweights for a tax-exempt bond portfolio shown for The Tax-Exempt Bond Fund of America®. Portfolios are managed, so holdings will change.
Building a portfolio issue by issue
Sometimes an entire sector may not be favored, but some issuers may be more attractive than others. General obligation (GO) bonds provide an interesting case. These bonds are often the first thing that comes to mind when many think about munis, so our underweight there may seem surprising. Generally, we find weak relative opportunities in the sector versus revenue bonds, which often make up a larger part of our portfolios. For example, a high-quality school district may have a similar risk profile to a GO but offer 30 to 50 extra basis points.
However, research can also uncover hidden opportunities even in underweighted sectors. California GOs provide such an example where our investors invest tactically. For example, our analysts have found some of the state’s GO bonds exhibit strong fundamentals, attractive valuations and solid trading liquidity. In general, such bonds have strong legal protections, including the state’s full faith and credit pledge. Tax collections have also been stronger than expected, driven by enthusiasm around artificial intelligence (AI) and the related stock market boom, improving the budget’s bottom line. California school districts with strong property-tax security and certain voter-approved bond structures have been preferred. Our analysts believe California GOs are fundamentally sound and may be worthwhile when new issues come at attractive spread levels, like after recent widening.
Converting opportunity to outcome
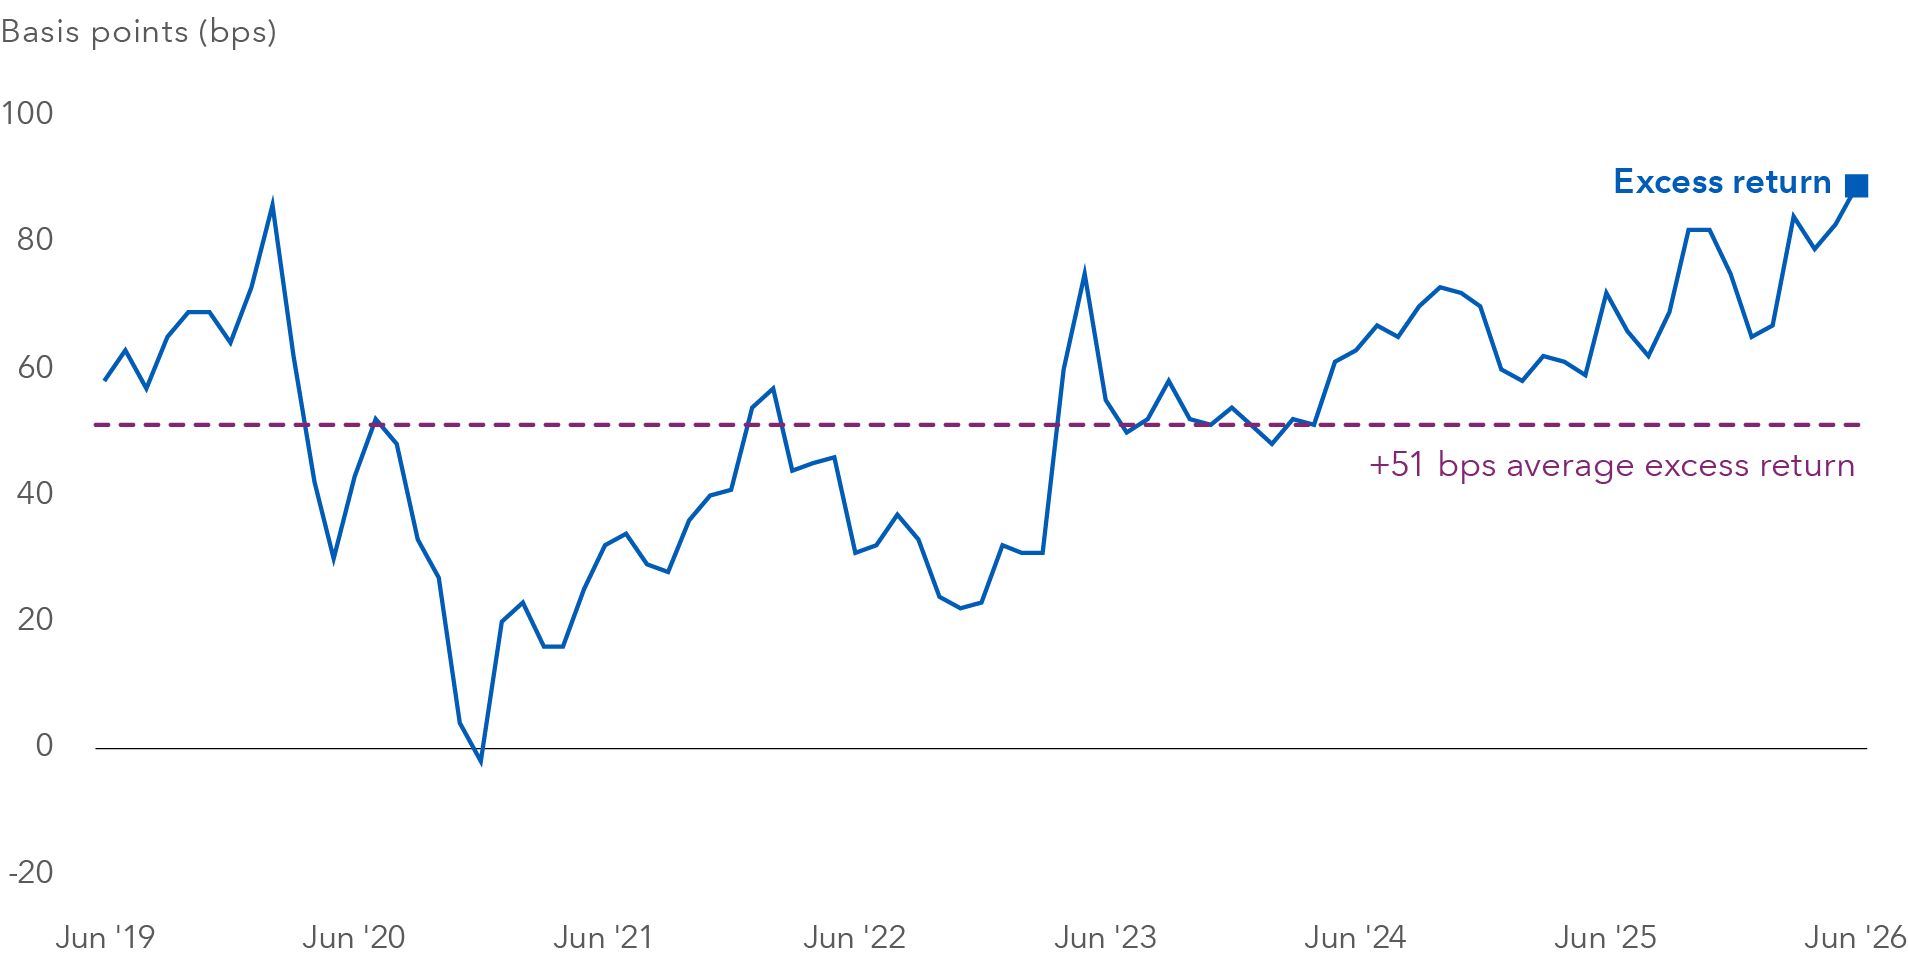
Our flagship municipal bond offering, The Tax-Exempt Bond Fund of America (TEAFX), provides an example of the power that research can have in pursuing returns in excess of peers that take a passive approach. TEAFX averaged 51 basis points (bps) in excess return versus the average passive fund over the past 10 years through 6/30/26. The fund is one of Capital Group’s most diversified municipal bond strategies and focuses on investment-grade securities, with the flexibility to own higher income securities across the rating spectrum.
The Tax-Exempt Bond Fund of America (F-2) versus passive funds
Source: Morningstar. Data as of 6/30/26. Annualized rolling monthly three-year excess return (%) over the Morningstar Passive Fund Muni National Intermediate category, net of fees (10-year period ended 6/30/26).
To more fully understand passive versus active, it helps to highlight more of the restrictions of passive investing. Passive vehicles are “benchmark constrained,” meaning they must adhere strictly to the parameters of the index, maintaining similar risk and return characteristics. Passive funds do not generally seek to engage in risk analysis or management since they are only attempting to achieve index-like outcomes. They are also restricted to the type of issues held in the benchmark, as noted earlier. Passive investors do pay a fee, even if smaller than that of many active competitors, which can result in returns below the benchmark they seek to track.
In contrast, active managers take an active role in designing and implementing a portfolio. Active managers are “benchmark aware,” meaning they may use a benchmark as a reference point, but they aim to outpace the benchmark's return after fees. As an active manager, we may outperform or underperform the portfolio's benchmark over short-term periods, but aim to outperform the benchmark over a full market cycle.
Research has the potential to unlock stronger outcomes
For investors who want exposure to the biggest debtors in a sector at low relative fees by tracking an index, passive may be a good fit. For those who want to seek more potential return even after potentially higher fees where active research is employed may want to consider actively managed portfolios. The fees help pay for research, which is at the heart of active investing. For example, the Capital System uses a holistic, collaborative methodology, with the muni team communicating with other teams across taxable fixed income, rates, equity and macro to synthesize information and seek out the best ideas. Particularly at a time when valuations are tight and valuation can provide opportunities, we believe that active management is well-positioned to provide excess returns.

Gregory Ortman is a fixed income investment director with 31 years of experience (as of 12/31/2025). He holds a master’s degree in economics from Claremont Graduate University and a bachelor’s degree in economics from St. Edwards University in Austin, Texas.

Jose Guzman is an investment product management specialist with 10 years of industry experience (as of 12/31/2025). He holds a master's degree in philosophy from California State University, Los Angeles, and a bachelor's degree in philosophy from University of California, Los Angeles.