On Presidents Day, the New York Stock Exchange and Capital Group’s U.S. offices will be closed.

In observance of the Presidents Day federal holiday, the New York Stock Exchange and Capital Group’s U.S. offices will be closed on Monday, February 16.

Municipal Bonds Municipal bonds:
5 investment themes for 2026

As municipal bonds kick off 2026 with brighter prospects, bond managers are faced with a challenge: How do you find value in a diverse muni market?


Overall, we anticipate stronger performance in muni bonds relative to taxable bonds this year. In particular, after-tax yields for muni investors remain attractive. Strong demand from separately managed account (SMA) and ETF buyers also appears poised to contribute to returns. We see opportunities in both credit selection and in opportunistic positioning in both duration and the municipal bond yield curve. 

Tax-equivalent muni yields look increasingly attractive relative to taxable bonds

Line chart titled Yield to worst (%) showing monthly data from January 2016 through January 2025. Two solid lines are plotted: the Muni Bond Index and the U.S. Agg Index. Both indexes fluctuate between roughly 1% and 5% until 2021. Starting in 2021, yields rise sharply, with the Muni Bond Index climbing to about 5% to 8% through 2023–2025, while the U.S. Agg Index increases more moderately to around 4% to 5% and then levels off. A dotted horizontal line representing the Muni Bond Index 10 year average appears near 4% across the full period.

Source: Bloomberg. As of 12/31/25. Muni Bond Index is the Bloomberg Municipal Bond Index. U.S. Agg Index is the Bloomberg U.S. Aggregate Index. Muni Bond Index yield is the tax-equivalent yield. Tax-equivalent yield = tax-free municipal bond yield / (1 - tax rate). (Based on a federal marginal tax rate of 37%, the top 2026 tax bracket. In addition, we have applied the 3.8% Medicare tax.)

Fundamentals remain broadly healthy across the muni market, with states benefiting from strong balance sheets. Meanwhile, the macro environment appears benign. We anticipate slow and steady U.S. growth, with low risk of recession, which should support fundamentals across both general obligation (G.O.) and revenue bonds.


Technicals have impacted the muni yield curve in a meaningful way, with the curve steepening over the past year. This creates opportunities for both duration and curve positioning. Credit spreads — a measure of the compensation for taking credit risk — feel broadly adequate, but we see plenty of pockets of opportunity when we dig into specific sectors. 


Against this backdrop, here are five themes that we anticipate will drive muni bond portfolios in 2026:

1. Curve positioning offers opportunity – especially at the long end

The muni yield curve inverted amid the U.S. Federal Reserve’s (Fed’s) rate-hiking campaign in late 2022, with yields on AAA-rated, two-year munis exceeding those of comparable 10-year munis by as much as 47 basis points (bps) in early 2024. The muni curve has since steepened on the Fed’s pivot to rate cuts, with the 10-year yield exceeding the two-year yield by 29 bps as of December 31, 2025. The curve remains partially inverted, with three-month AAA-rated munis demanding higher yields than comparable seven-year bonds – creating opportunities for active curve management.


The longer end of the municipal bond yield curve materially underperformed the shorter part of the curve in 2025. Additionally, the muni yield curve steepened more dramatically than the U.S. Treasury yield curve. Yields between AAA-rated, 30-year munis and comparable 10-year munis diverged by 146 bps as of December 31, 2025 – an increase of 72 bps over the year. That rise outpaced a 46 bps increase between similar-tenor U.S. Treasuries over the same period.

The muni yield curve could flatten

Line chart showing yield versus time to maturity. The x-axis represents maturities from 3 months to 30 years, and the y-axis shows yields from 2% to 5%. Four curves are displayed: In a dashed line, the US Treasury curve, as of January 31, 2025, starts near 4.3% at 3 months and rises to about 4.8% at 30 years. In a solid line, the US Treasury curve as of January 31, 2026, starts near 3.7% and gradually increases to about 4.8% at 30 years. In a dashed line, the muni AAA curve, as of January 31, 2025, starts near 2.8% and rises to about 4.0% at 30 years. In a solid line, the muni AAA curve as of January 31, 2026, starts near 2.6% and rises sharply after 10 years to about 4% at 30 years. The chart highlights that the municipal yield curve is sharply steeper past the 10-year mark compared to the Treasury yield curve.

Source: Bloomberg. As of 1/31/26. The muni curve is represented by the BVAL AAA Munis Benchmark. The Treasury curve is represented by the Bloomberg U.S. Treasury Index.

Returns across maturities for muni bonds diverged sharply amid the steepening with the long end underperforming. For example, 22-year and longer munis underperformed 10-year munis by 397 bps in 2025, per the Bloomberg Municipal Bond Index. That return differential is rare, particularly when the overall muni index generated around 4.3% positive total returns. The last time we saw that combination was during the Global Financial Crisis in 2007.


We believe these dynamics point to attractive relative value in the long end of the muni bond curve, especially around the 20-year maturity. Further, we can envision a scenario where the municipal bond yield curve flattens.


Still, there are dynamics at play that may help to maintain a steeper curve — namely strong demand from SMA buyers who have historically shown a preference for the intermediate part of the curve and relatively weak demand from traditional long-end buyers such as banks and insurance companies. That makes it difficult to gauge the timing and magnitude of potential flattening. Regardless, we see attractive total return potential given the high income that these bonds offer in addition to the roll (the price appreciation a bond usually experiences as it matures and “rolls” down the yield curve, with its yield declining and its price rising) at the long end of the curve.


In terms of duration exposure, we favor a slightly longer duration stance and adjusting exposure opportunistically as and when bond yields swing to the outer edges of what we expect will be a range-bound environment, with 10-year Treasuries possibly trading between 4.0% and 4.5%.

2. Robust demand driven by SMA and ETF buyers helps offset rising supply

Flows into muni ETFs surged to a record $37.7 billion in 2025, up from $17.7 billion in 2024, according to Morningstar. Demand from SMA buyers also appears strong after initially picking up during the Fed’s rate-hiking cycle, as high-net-worth individuals sought out tax-loss harvesting strategies.


We anticipate that strong demand from SMA and ETF buyers will continue this year, with that dynamic impacting the front-to-intermediate part of the muni yield curve. These buyers tend to focus on the one- to 10-year part of the curve while largely avoiding the longer end. This trend could support the intermediate part of the muni curve and also helps explain why we view it as the richer part of the curve.


We see some opportunity at the shorter end of the muni bond curve, in the one- to three-year area, as yields are relatively attractive and select securities offer attractive spreads that can drive excess returns. That exposure can be paired with the longer end of the curve for a barbelled approach to curve exposure. 


In terms of supply, munis are coming off a record year for issuance as borrowers rushed to market amid concerns over the future of munis’ tax-exempt status. While those concerns appear to have abated, we anticipate another year of elevated supply as issuers tap the market to fund high infrastructure and construction costs. Still, strong demand coupled with a market expectation of elevated supply should help the market absorb new issue supply. 

Muni issuance hits a record high

Bar chart showing annual U.S. municipal bond issuance, in billions, from 2016 to 2025. Values rise and fall over the period: $452 in 2016, $449 in 2017, $347 in 2018, $426 in 2019, $485 in 2020, $483 in 2021, $392 in 2022, $385 in 2023, $514 in 2024 and a high of $580 in 2025.

Source: SIFMA. As of 12/31/25.

3. Selectivity is essential amid steep G.O. bond valuations

Many states remain on strong financial footing. Enacted budgets for fiscal 2026 suggest states are entering the year in solid fiscal position, though they face tighter budget conditions as revenue growth remains slow and spending pressures build, according to the National Association of State Budget Officers. Meanwhile rainy-day funds, which are reserves that states can tap during a downturn, reached $183 billion at the end of fiscal 2024, matching an all-time high from the prior year.


While fundamentals remain healthy, we remain cautious on G.O. bonds given tight valuations. Spreads on G.O. bonds reached 27 bps as of December 31, 2025 compared with 34 bps a year prior.

Spreads on general obligation bonds remain tight

Line chart showing general obligation bond spreads from mid 2022 to late 2025. Spreads spike above 55 basis points in 2022 and late 2023, then gradually decline to the mid 20s by the end of 2025.

Source: Aladdin. Spreads shown are a subset of G.O. bonds from the Bloomberg Municipal Bond Index.

Despite narrow credit spreads, we are still finding select opportunities in G.O.-related bonds like the New York City Transitional Finance Authority. We favored these bonds during the COVID-19 pandemic when spreads widened, providing an attractive entry point. While they have since tightened, they remain wide relative to their AAA rating and relative to other G.O. or G.O.-related bonds. We remain positive on our outlook for these credits. 


Outside of a few select G.O. names, we’re generally looking elsewhere in the muni market as tight valuations steer us toward other sectors that may offer higher yields with lower credit risks.

4. A focus on relative value in revenue bonds

Looking within the revenue bond universe, we see opportunities within corporate munis, including pre-paid gas bonds. Valuations in these sectors look compelling relative to both the broader muni universe and the taxable corporate bond market.


Corporate muni debt offers select opportunity in corporate sectors like waste management and utilities among others. Spreads on corporate munis reached 83 bps as of December 31, 2025 compared with an average spread of 50 bps among revenue bonds.


Pre-paid gas bonds remain one of our favored sectors, given our positive outlook on the sector and our sanguine macro view. These bonds, which are issued by public utility agencies to fund the long-term, discounted purchase of natural gas, have parallels to corporate debt issuance as they’re usually guaranteed by money center banks. We’re finding opportunities in attractive valuations, with spreads around 124 bps as of December 31, 2025 and in shifting from shorter term to longer term bonds within the sector. Heavy issuance over the past year has caused modest spread widening. On the other hand, the expansion of guarantors that offer greater diversification has been a positive for the sector. 

Gas bonds offer relatively attractive spreads

Line chart comparing spreads for Gas bonds and the Muni Bond Index from late 2022 to late 2025. Gas spreads range from around 100 to 175 basis points and end at 124 basis points. Muni Bond Index spreads remained stable around 40 to 60 basis points, ending at 43 basis points.

Source: Aladdin. Muni Bond Index is the Bloomberg Municipal Bond Index, of which gas bonds are a subset.

5. Research can unearth idiosyncratic opportunities, especially in securitized debt

Opportunities across securitized municipal bonds are increasingly compelling, with deep research essential to uncovering idiosyncratic value.


We’re constructive on housing-related deals, where states are looking to address supply shortages impacting mid-to-lower income households. Citi Community Capital bonds, which bundle affordable housing loans, are attractive given strong underwriting, developers with skin in the game and attractive spreads. Fundamentals also remain positive as lack of housing supply and high mortgage rates continue to drive demand for affordable units.


We also favor planned amortization class (PAC) bonds, a type of housing bond that’s designed to mitigate prepayment risk by implementing a steady payment schedule. PAC bond spreads have tightened on increasing investor demand, and we maintain substantial investments in these securities. 

Securitized housing bonds offer attractive relative value

Bar chart comparing yields: AA Muni Bond Index at 3.5%, Muni Bond Index at 3.6%, and Muni multi family housing at 4.1%.

Sources: Aladdin, Bloomberg. As of 12/31/25. Muni Bond Index is the Bloomberg Municipal Bond Index, of which the AA rated index and the multi-family housing bonds are subsets.

Like the taxable market, investing in housing-related municipal bonds comes with prepayment and extension risk. We leverage our firm’s deep knowledge in mortgages and rates when analyzing these bonds, helping to uncover idiosyncratic opportunities. The need for deep prepayment and credit analysis can serve as a barrier to participation in securitized deals, helping to reduce the buyer base pool and offer attractive spread levels.


The student loan sector also remains appealing due to its defensive credit profile and historically strong performance on a relatively consistent basis. Borrowers are typically high-quality, often with high credit scores. Moreover, a large share of loans are co-signed, supporting low delinquency rates as graduates secure employment and advance in their careers. The sector also benefits from the fact that student debt is difficult to discharge in bankruptcy, enhancing credit stability. At the same time, student loans offer attractive spreads and periodic new‑issue supply, making it a relatively attractive and fairly scalable corner of the market.

Municipal bonds have brighter prospects in 2026

The municipal bond market is starting the year on firmer footing, with fading policy concerns and stabilizing supply, creating a clearer path for muni investors. Healthy fundamentals, strong demand from SMA and ETF buyers, and a steeper yield curve are shaping how we position across the spectrum, from long‑end opportunities to select credit sectors that offer compelling relative value. Attractive after-tax yields may also help drive returns for the muni market, where recent periods of underperformance have typically been followed by outperformance. Together, these dynamics suggest a constructive setting for municipal investors — one where curve positioning and selective credit exposure can help unlock meaningful total return potential in the year ahead.

Courtney Wolf is a fixed income portfolio manager with 20 years of investment industry experience (as of 12/31/25). She holds bachelor’s degrees in computer engineering and economics from Northwestern University.

Lee Chu is a fixed income portfolio manager with 17 years of investment industry experience (as of 12/31/2025). She holds a bachelor’s degree in psychology from Brown University.

Past results are not predictive of results in future periods.
 

The indexes are unmanaged and, therefore, have no expenses. Investors cannot invest directly in an index.


Source: Bloomberg Index Services Limited. BLOOMBERG® is a trademark and service mark of Bloomberg Finance L.P. and its affiliates (collectively "Bloomberg"). Bloomberg or Bloomberg's licensors own all proprietary rights in the Bloomberg Indices. Neither Bloomberg nor Bloomberg's licensors approves or endorses this material, or guarantees the accuracy or completeness of any information herein, or makes any warranty, express or implied, as to the results to be obtained therefrom and, to the maximum extent allowed by law, neither shall have any liability or responsibility for injury or damages arising in connection therewith.
 

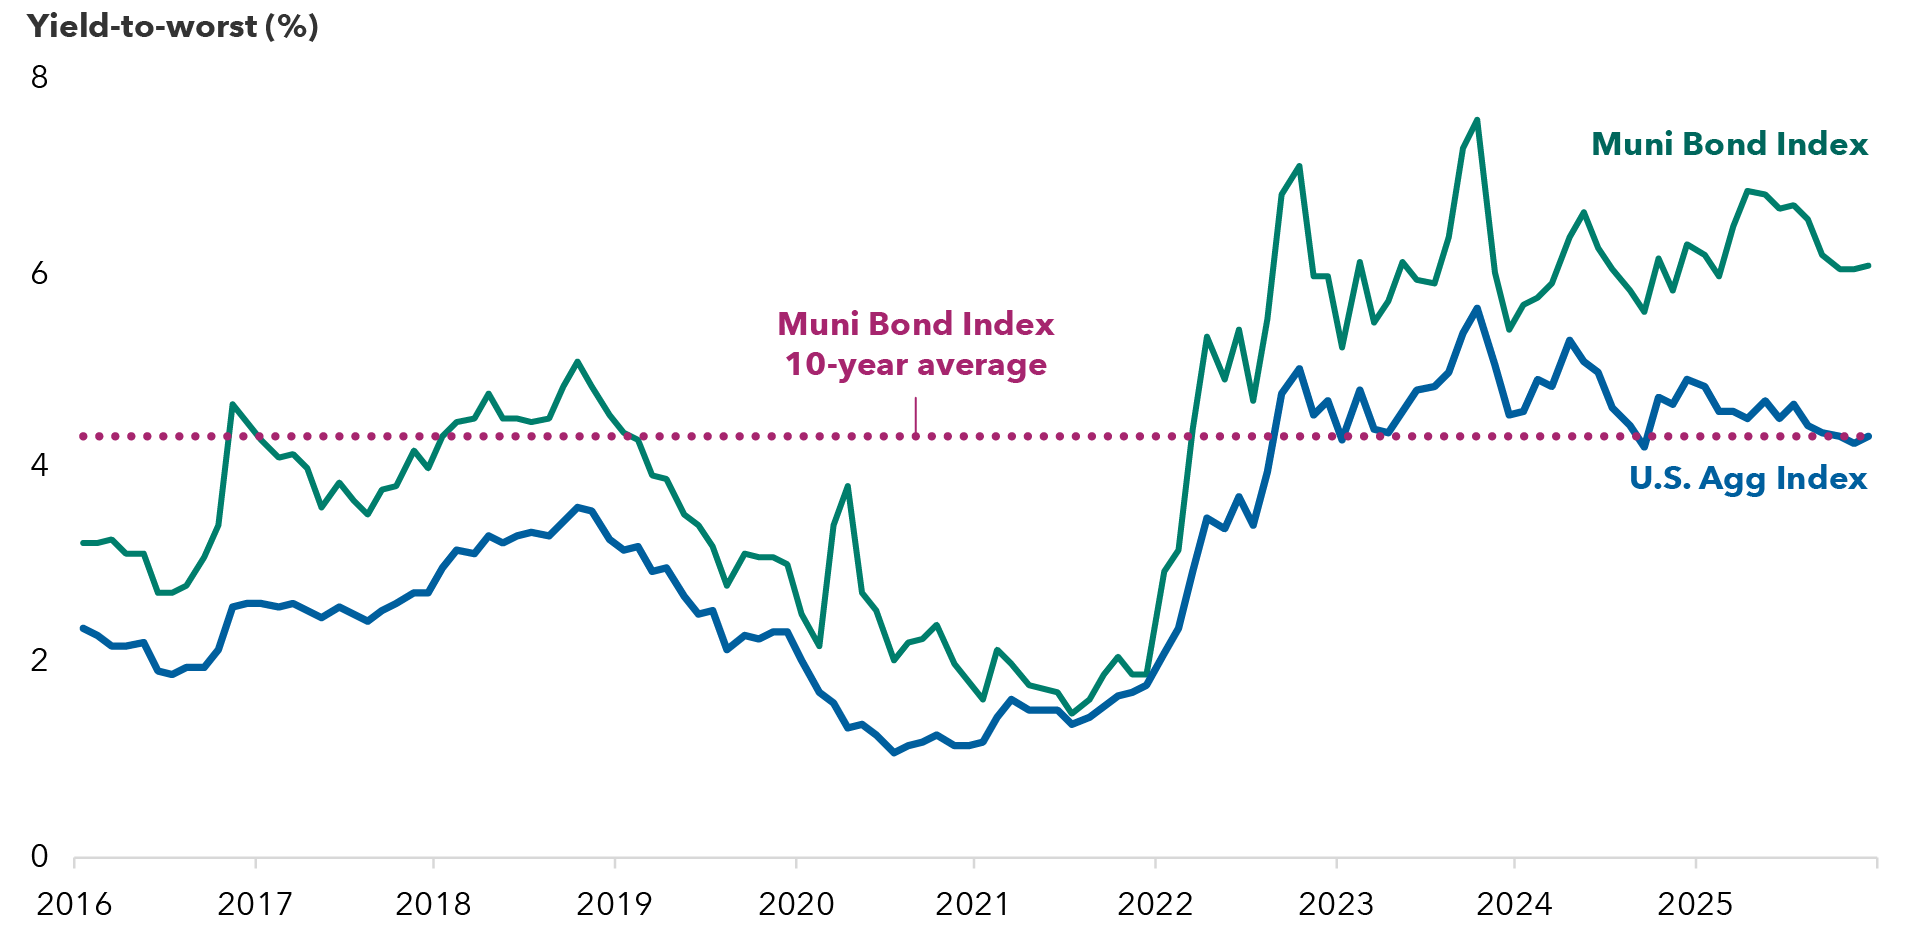
The Bloomberg Municipal Bond Index is a market value-weighted index designed to represent the long-term investment-grade tax-exempt bond market.
 

The Bloomberg U.S. Aggregate Index represents the U.S. investment-grade fixed-rate bond market.
 

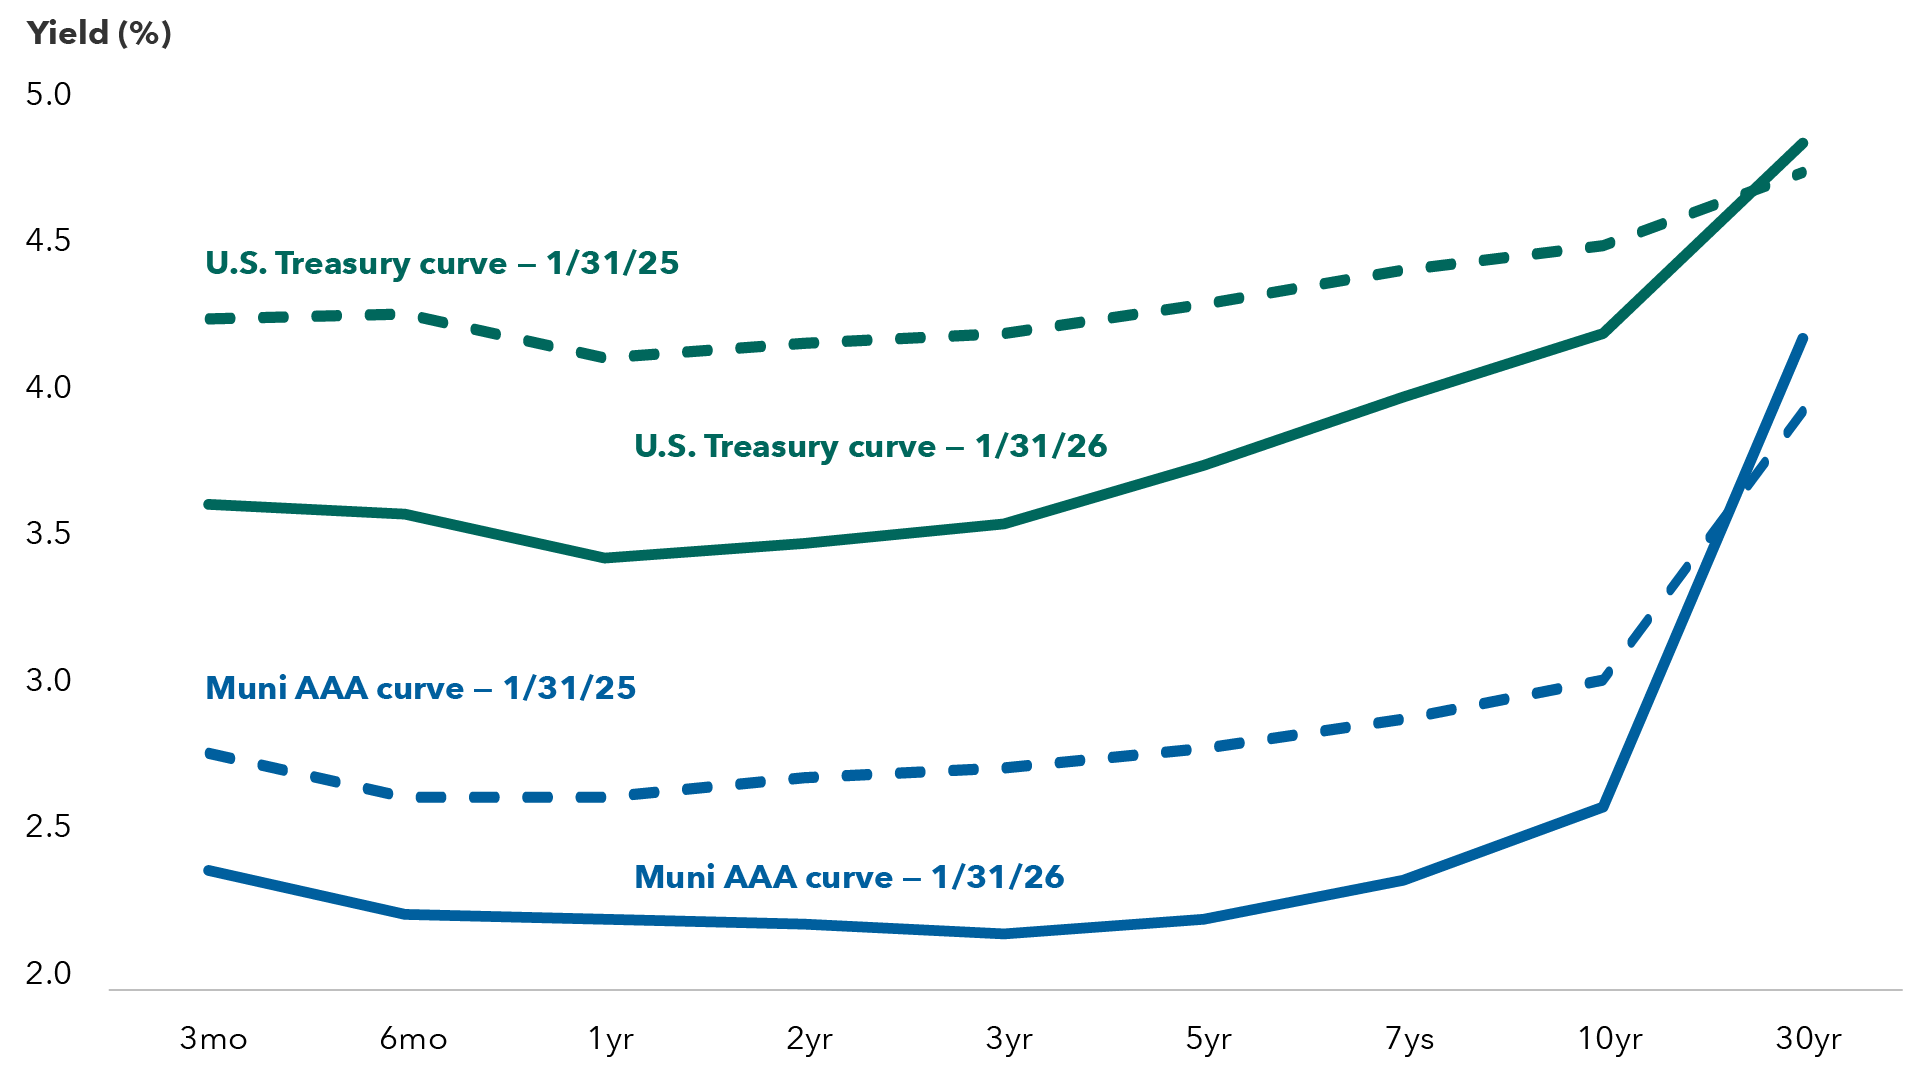
The Bloomberg U.S. Treasury Index represents the public obligations of the U.S. Treasury with a remaining maturity of one year or more.
 

Bond ratings, which typically range from AAA/Aaa (highest) to D (lowest), are assigned by credit rating agencies such as Standard & Poor's, Moody's and/or Fitch, as an indication of an issuer's creditworthiness.
 

The after-tax (or tax-equivalent) yield of a municipal bond investment is the yield a taxable bond would have to offer to equal the same amount as the tax-exempt bond. Highest federal tax rate assumes the 3.8% Medicare tax and the top federal marginal tax rate for 2026 of 37%, for a total federal tax rate of 40.8%. Tax-equivalent yield calculation is yield to worst/(1-(federal tax rate)).
 

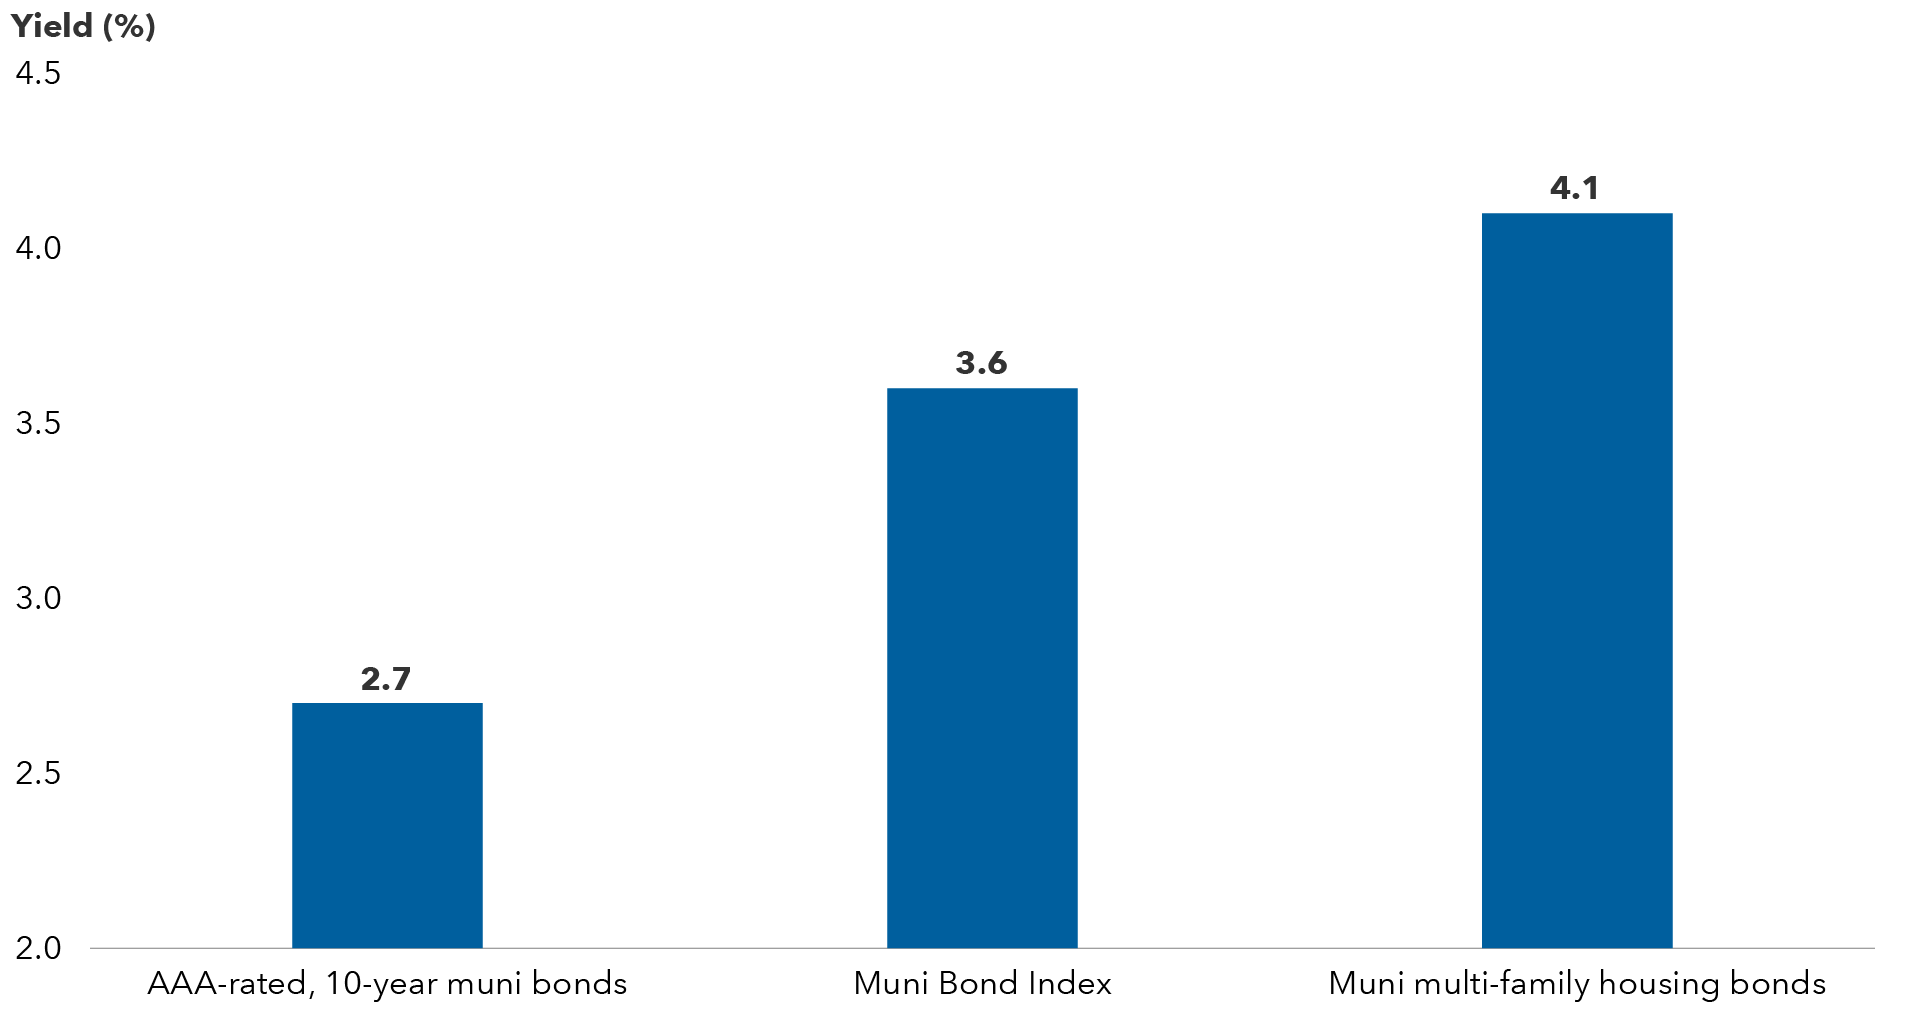
Yield to worst is the lowest yield that can be realized by either calling or putting on one of the available call/put dates, or holding a bond to maturity.
 

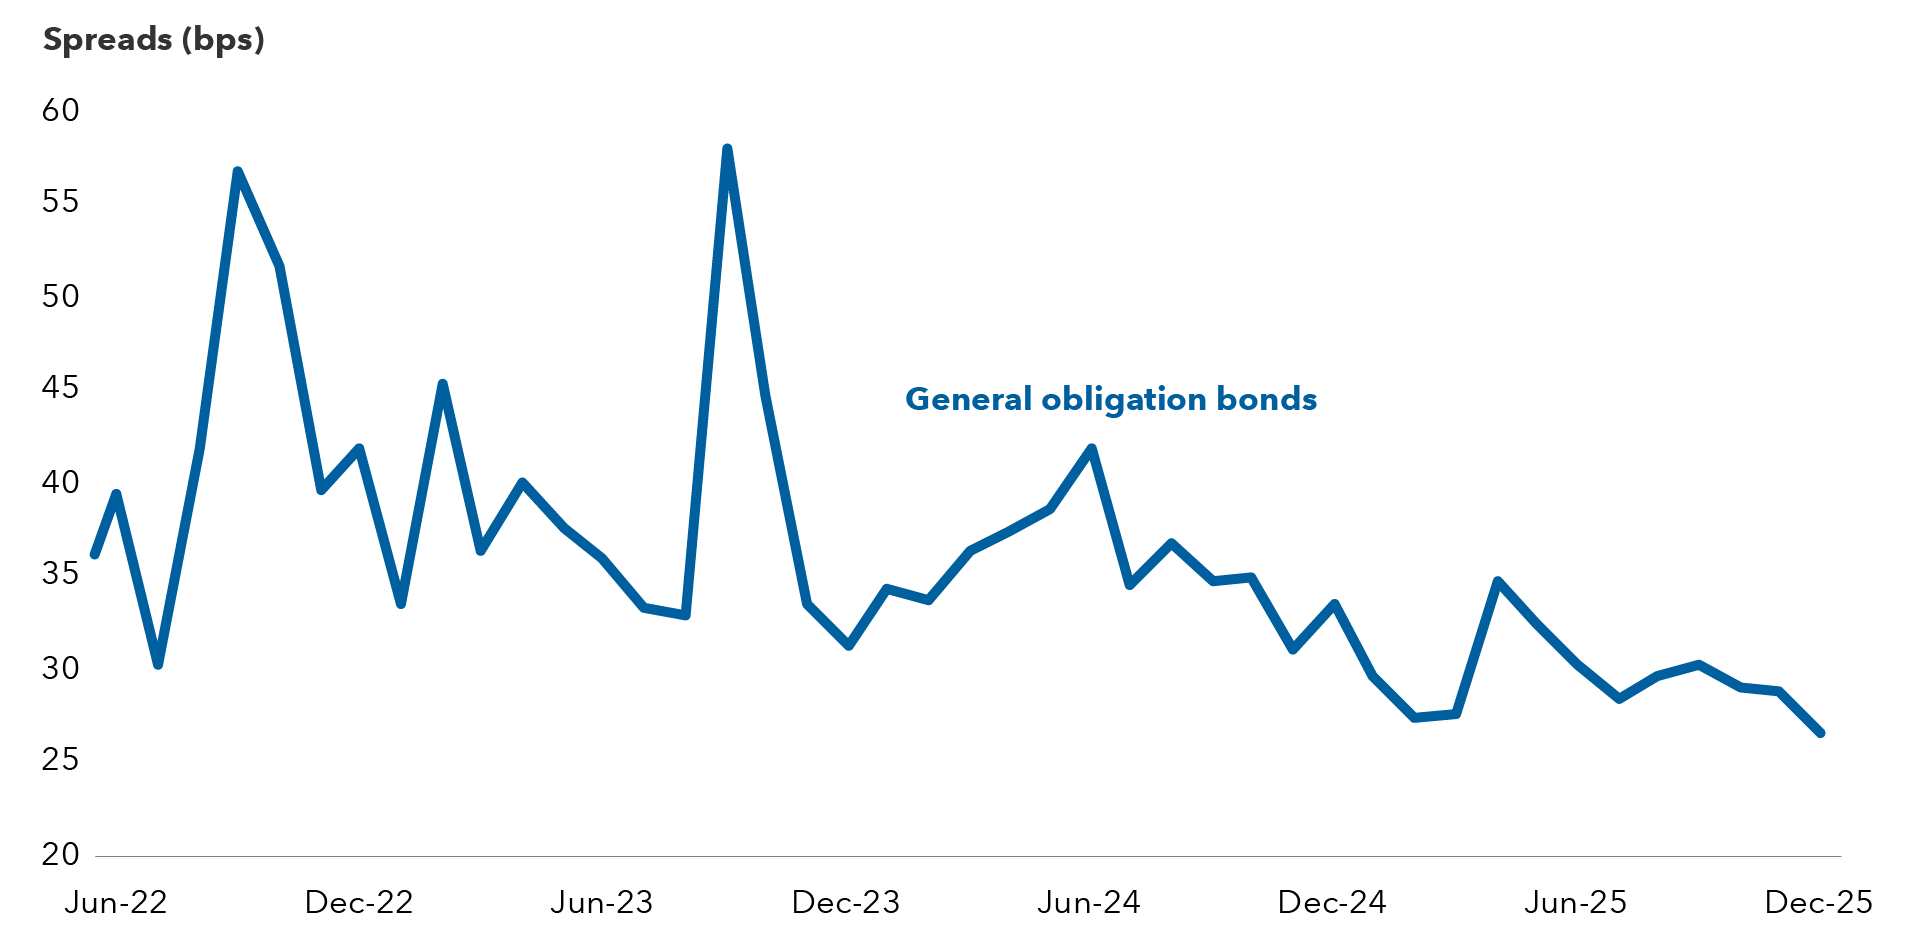
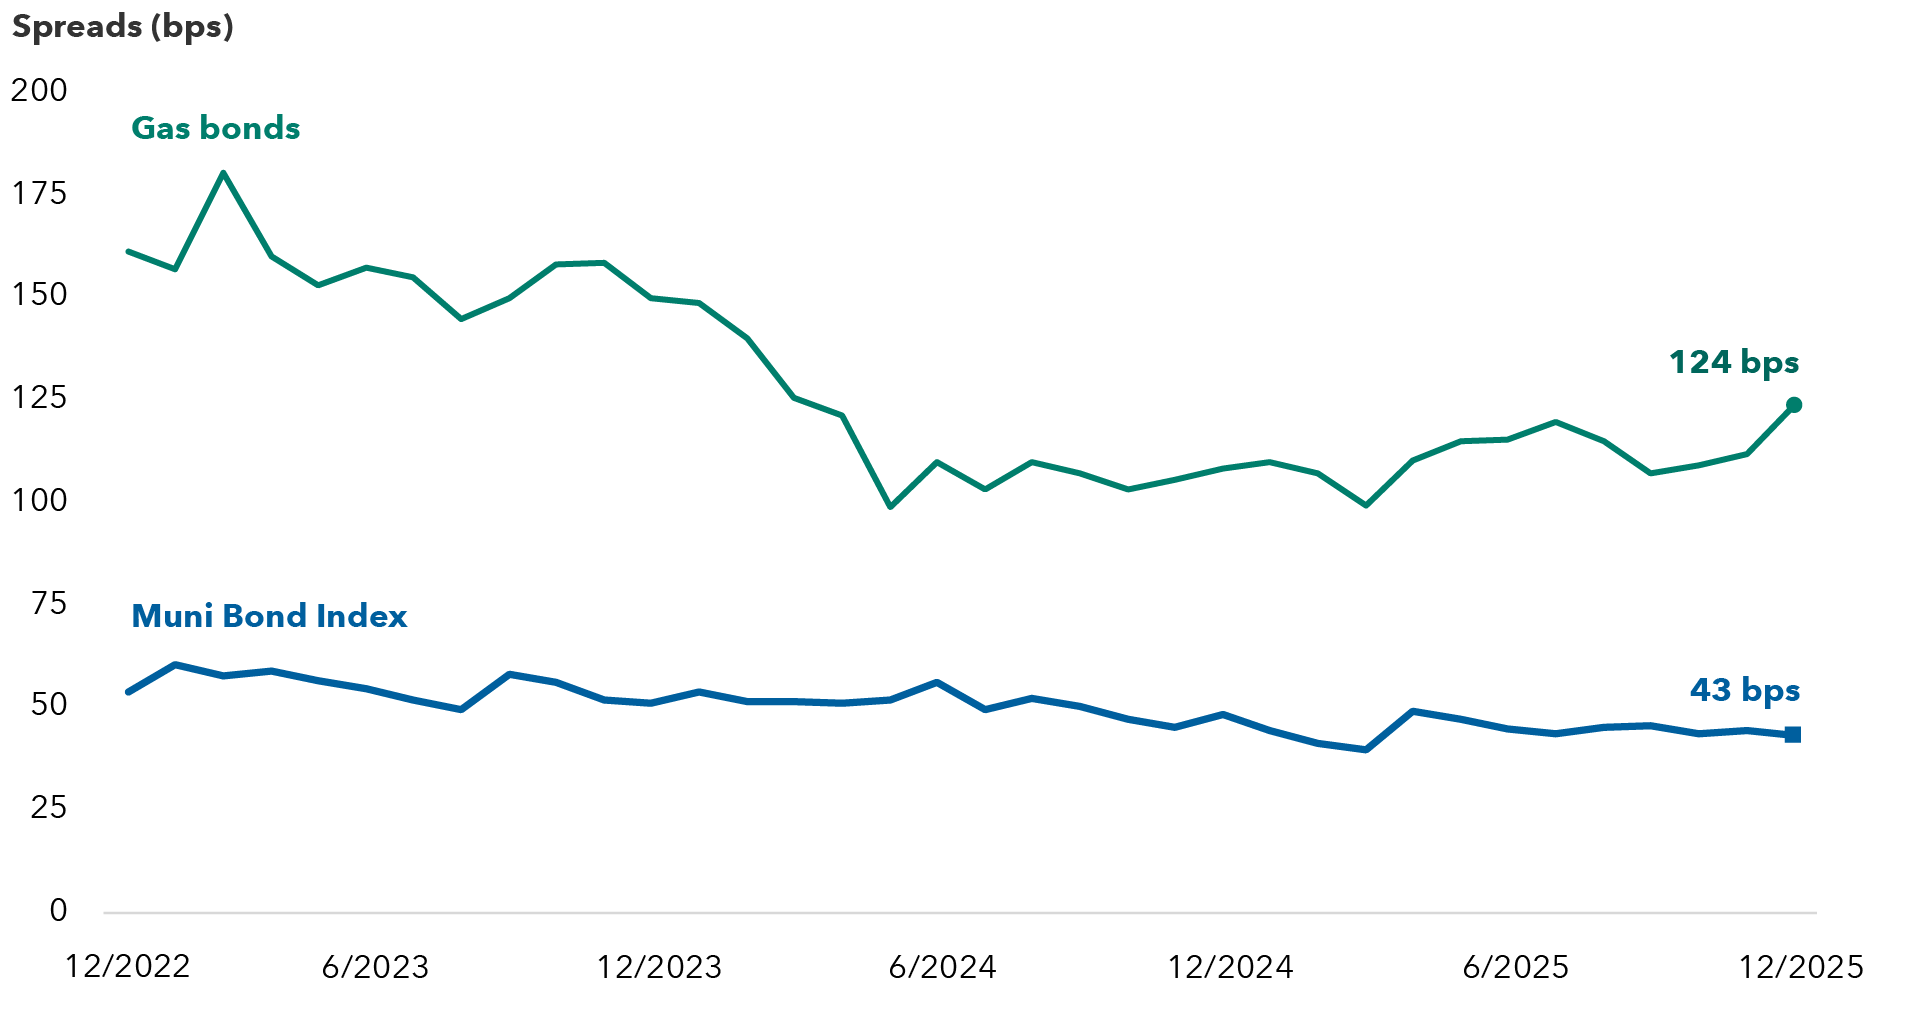
A spread is the difference between the yield of a bond and the yield of a similar maturity Treasury bond.
 

Duration measures a bond’s sensitivity to changes in interest rates. Generally speaking, a bond's price will go up 1% for every year of duration if interest rates fall by 1% or down 1% for every year of duration if interest rates rise by 1%.
 

Carry refers to the income or cost from holding an investment. Positive carry is the return an investor earns simply by holding a bond over time, assuming market prices and yields remain unchanged.

Investments are not FDIC-insured, nor are they deposits of or guaranteed by a bank or any other entity, so they may lose value.
Investors should carefully consider investment objectives, risks, charges and expenses. This and other important information is contained in the mutual fund prospectuses and summary prospectuses, which can be obtained from a financial professional and should be read carefully before investing.
Statements attributed to an individual represent the opinions of that individual as of the date published and do not necessarily reflect the opinions of Capital Group or its affiliates. This information is intended to highlight issues and should not be considered advice, an endorsement or a recommendation.
All Capital Group trademarks mentioned are owned by The Capital Group Companies, Inc., an affiliated company or fund. All other company and product names mentioned are the property of their respective companies.
Use of this website is intended for U.S. residents only. Use of this website and materials is also subject to approval by your home office.
Capital Client Group, Inc.
This content, developed by Capital Group, home of American Funds, should not be used as a primary basis for investment decisions and is not intended to serve as impartial investment or fiduciary advice.
© 2026 Morningstar, Inc. All rights reserved. The information contained herein: (1) is proprietary to Morningstar and/or its content providers; (2) may not be copied or distributed; and (3) is not warranted to be accurate, complete or timely. Neither Morningstar, its content providers nor Capital Group are responsible for any damages or losses arising from any use of this information. Past performance is no guarantee of future results. Information is calculated by Morningstar. Due to differing calculation methods, the figures shown here may differ from those calculated by Capital Group.