

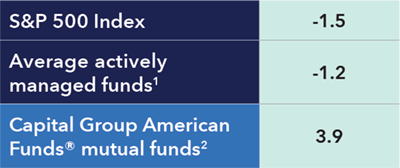
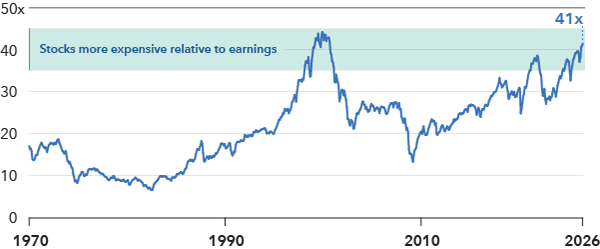
Sources: Capital Group, S&P Global, Shiller Data, Morningstar. S&P 500 benchmarked mutual funds with history dating back to January 31, 1970, based on Class F-2 shares. CAPE ratio can help assess whether an index is overvalued, undervalued or fairly valued. For further details, see footnotes and important information. As of June 30, 2026.
Passive risk grows
Benchmarks are increasingly dominated by a narrow group of AI-linked companies that may be creating unintended risks.
Valuations are extended
Today's leaders are high-quality companies, but elevated valuations may already reflect optimistic outcomes.
Active judgment can help
As market leadership narrows, active management seeks to participate in growth while building resilience.
Passive market risks are stacked
MSCI All Country World Index (ACWI)
Current value and historic range, 20 years through 6/30/26
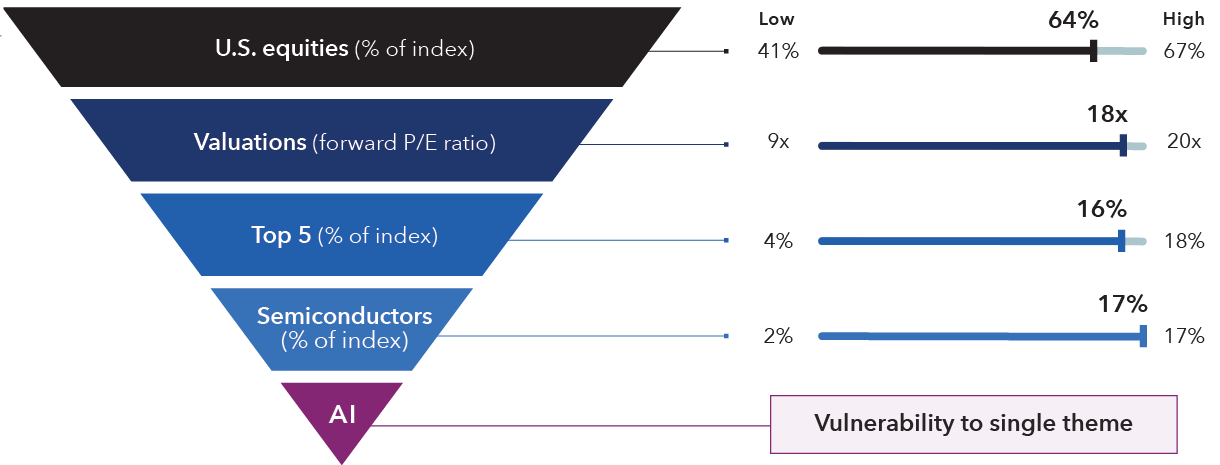
Sources: Capital Group, FactSet, Morningstar. Percent of index is based on market capitalization.

AI disruption is new. Extreme market concentration is not.
See how active investing has navigated narrow markets in the past.
- Risks
- Opportunities
AI cash crunch starting to appear
Soaring AI hyperscalers’ capex is weighing on free cash flow, threatening the high valuations and concentration in AI-related names via passive approaches.
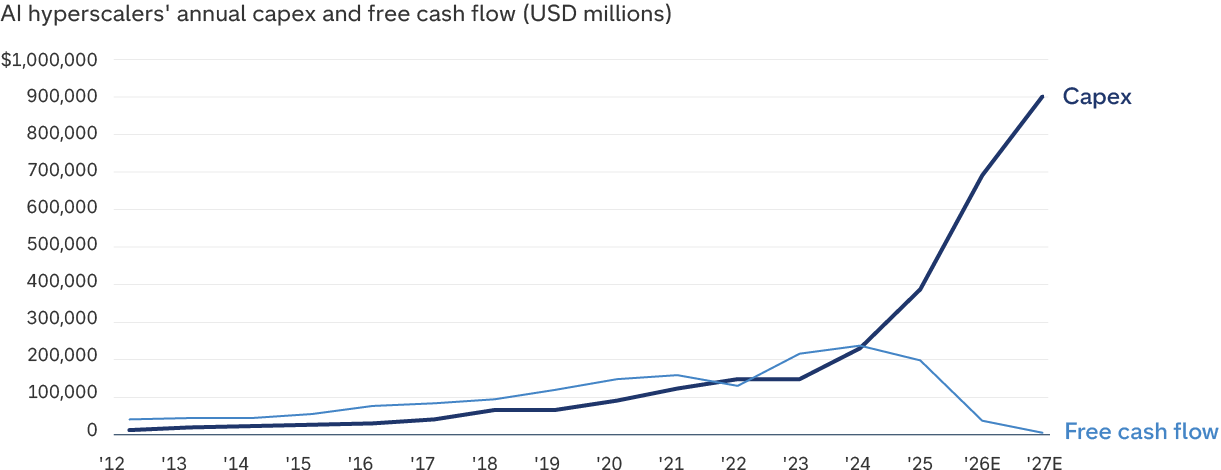
Source: FactSet. As of June 30, 2026. Capex and free cash flow for 2026 and 2027 are estimated. Capex: Capital expenditure. E: Estimated. Hyperscalers' free cash flow include Amazon, Meta, Microsoft and Alphabet.
Active management has historically outpaced when valuations soar
Average 3-year forward returns when S&P 500 CAPE ratio was 35x–45x (%)
S&P 500 cyclically adjusted price-to-earnings (CAPE) ratio
Markets seem convinced on the AI future. What if they’re wrong?
See how Capital Group is approaching this unique market moment in a letter from our CIO Martin Romo.

How Capital Group can help support resilience
The question is not whether AI will create value, but whether any single theme should dictate the shape of a portfolio. An active approach can help investors both participate in powerful innovation and gain differentiated exposure to other growth areas.
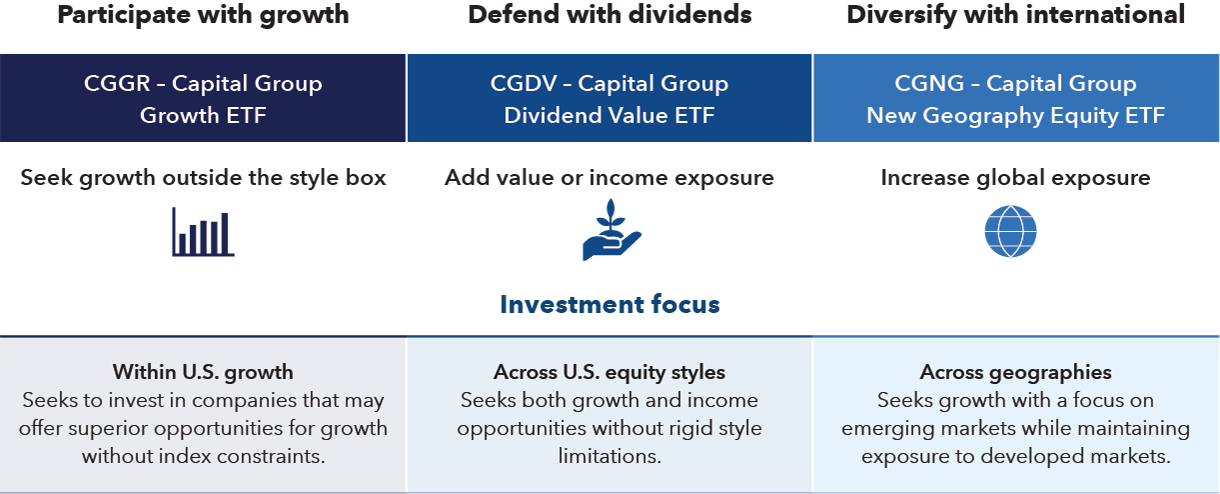
Our funds have not often lagged their benchmarks
Over 3- and 5-year monthly rolling periods on average, Capital Group American Funds equity-focused mutual funds:
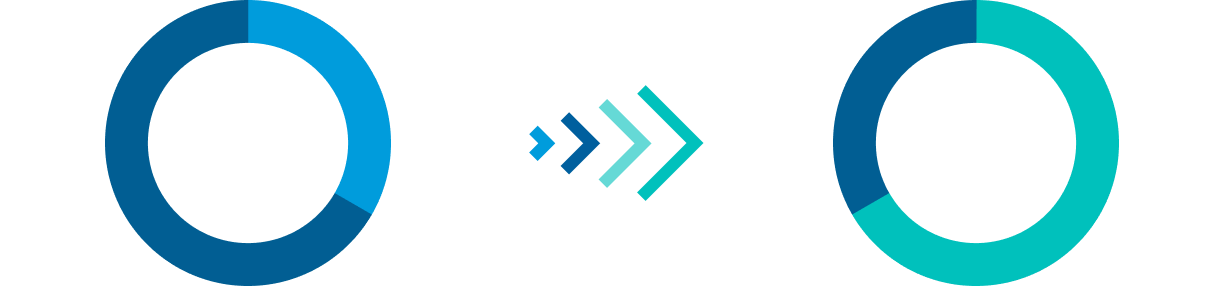
In all subsequent periods after lagging their benchmarks, these funds exceeded their benchmarks by an annualized 139 bps and 165 bps in 3- and 5-year periods, respectively.
Sources: Capital Group, Morningstar. As of June 30, 2026. Bps: Basis points. In 3-year periods, these funds lagged their benchmarks 36% of the time, and in subsequent periods outperformed 60% of the time. In 5-year periods, these funds lagged their benchmarks 31% of the time, and in subsequent periods outperformed 63% of the time. This analysis is based on Class F-2 shares at net asset value and includes all the equity-focused American Funds® mutual funds with 36 or more available rolling monthly 10-year return observations, from which we deem sufficient to draw relevant statistical observations. Start date is January 2, 1934, with subsequent funds added with their inception dates.

About Capital Group
"The Capital System was not designed for easy markets. It was designed for markets like this one."
Martin Romo
Chair and chief investment officer
Equities
A range of equity strategies following a long-term approach to help investors achieve their goals.
Fixed income
See how Capital Group’s core and quality approach to fixed income has resulted in a differentiated pattern of results across different market environments.
ETFs
Our active ETFs are objective-oriented strategies that offer more choice for our investors, along with the full support of Capital Group’s extensive resources.
PORTFOLIO CONSTRUCTION
Want more personalized portfolio analysis?
Our portfolio consulting team works with advisors to help surface potential risks, highlight opportunities and provide additional perspective as client needs evolve and the market changes.

Index comparisons:
AMCAP Fund, American Mutual Fund, Fundamental Investors, The Growth Fund of America, The Investment Company of America and Washington Mutual Investors Fund (S&P 500 Index); American Balanced Fund (60% S&P 500/40% Bloomberg U.S. Aggregate indexes); American Funds Global Balanced Fund (Global Balanced Historical Benchmarks Index); Capital Income Builder (70% MSCI ACWI/30% Bloomberg U.S. Aggregate indexes); The Income Fund of America (65% S&P 500/35% Bloomberg U.S. Aggregate indexes); The New Economy Fund (MSCI All Country World Index); New World Fund (New Geography/New World Historical Benchmarks Index); American Funds International Vantage Fund (MSCI EAFE Index); American Funds Global Insight Fund (MSCI World Index); American Funds Developing World Growth and Income Fund (MSCI Emerging Markets Index); Capital World Growth and Income Fund (Capital World Growth and Income Fund Historical Benchmarks Index); New Perspective Fund (New Perspective Fund Historical Benchmarks Index); EUPAC Fund (EUPAC Fund Historical Benchmarks Index); SMALLCAP World Fund (SMALLCAP World Fund Historical Benchmarks Index); and International Growth and Income Fund (International Growth and Income Fund Historical Benchmarks Index). Index blends are rebalanced monthly.
The current primary benchmark indexes for four funds lacked sufficient history to cover the funds’ lifetimes, so comparable indexes were used during the following periods: The Income Fund of America (12/1/73–12/31/75, 65% S&P 500/35% Bloomberg U.S. Government/Credit Bond indexes); American Balanced Fund (7/26/75–12/31/75, 60% S&P 500/40% Bloomberg U.S. Government/Credit Bond indexes); Capital Income Builder (7/30/87–12/31/87, MSCI World Index); and The New Economy Fund (12/1/83–12/31/87, MSCI World Index).
Footnotes/Important information:
1Average actively managed return is the average of 2,983 U.S. large cap funds with history dating back to January 31, 1970, using the oldest available share class. Categories include Large Value, Large Blend, Large Growth and is inclusive of open-ended and exchange-traded funds. The methodology rebalances monthly and includes both live and obsolete funds.
2Funds included in the analysis are: American Mutual Fund®, Washington Mutual Investors Fund, The Investment Company of America®, Fundamental Investors®, AMCAP Fund® and The Growth Fund of America®.
Forward price-to-earnings (P/E) ratio measures a stock’s current price relative to its projected earnings over the next 12 months, reflecting market expectations for future growth.
S&P 500 cyclically adjusted price-to-earnings (CAPE) ratio is a valuation measure that adjusts for short-term earnings variability by dividing an index’s current price by the average ofthe prior 10 years of inflation-adjusted earnings to assess an index’s valuation over a full business cycle.
S&P 500 Index is a market-capitalization-weighted index of about 500 major U.S. stocks. Includes reinvested dividends but excludes fees and taxes.
MSCI Emerging Markets Index is a free-float-adjusted market-capitalization-weighted index designed to measure equity market results in global emerging markets.
MSCI All Country World Index (ACWI) captures large- and mid-cap representation across developed markets (DM) and emerging markets (EM) countries. The index is float-adjusted and covers approximately 85% of the global investable equity opportunity set.
Use of this website and materials is also subject to approval by your home office.
Figures shown are past results and are not predictive of results in future periods. Current and future results may be lower or higher than those shown. Investing for short periods makes losses more likely.
Prices and returns will vary, so investors may lose money.
View mutual fund expense ratios and returns.
Investments are not FDIC-insured, nor are they deposits of or guaranteed by a bank or any other entity, so they may lose value.
Investors should carefully consider investment objectives, risks, charges and expenses.
This and other important information is contained in the mutual fund prospectuses and/or summary prospectuses, which can be obtained from a financial professional and should be read carefully before investing.
This and other important information is contained in the ETF prospectuses and summary prospectuses, which can be obtained from a financial professional and should be read carefully before investing.
Capital Group exchange-traded funds (ETFs) are actively managed and do not seek to replicate a specific index. ETF shares are bought and sold through an exchange at the then current market price, not net asset value (NAV), and are not individually redeemed from the fund. Shares may trade at a premium or discount to their NAV when traded on an exchange. Brokerage commissions will reduce returns. There can be no guarantee that an active market for ETFs will develop or be maintained, or that the ETF's listing will continue or remain unchanged.
Investing outside the United States involves risks, such as currency fluctuations, periods of illiquidity and price volatility. These risks may be heightened in connection with investments in developing countries.
Nondiversified funds have the ability to invest a larger percentage of assets in the securities of a smaller number of issuers than a diversified fund. As a result, poor results by a single issuer could adversely affect fund results more than if the fund invested in a larger number of issuers. See the applicable prospectus for details.
There have been periods when the results lagged the index(es) and/or average(s).
The indexes are unmanaged and, therefore, have no expenses. Investors cannot invest directly in an index.
The MSCI information may only be used for your internal use, may not be reproduced or redisseminated in any form and may not be used as a basis for or a component of any financial instruments or products or indices. None of the MSCI information is intended to constitute investment advice or a recommendation to make (or refrain from making) any kind of investment decision and may not be relied on as such. Historical data and analysis should not be taken as an indication or guarantee of any future performance analysis, forecast or prediction. The MSCI information is provided on an “as is” basis and the user of this information assumes the entire risk of any use made of this information. MSCI, each of its affiliates and each other person involved in or related to compiling, computing or creating any MSCI information (collectively, the “MSCI Parties”) expressly disclaims all warranties (including, without limitation, any warranties of originality, accuracy, completeness, timeliness, non-infringement, merchantability and fitness for a particular purpose) with respect to this information. Without limiting any of the foregoing, in no event shall any MSCI Party have any liability for any direct, indirect, special, incidental, punitive, consequential (including, without limitation, lost profits) or any other damages. Please visit the data provider's website for more information.
Each S&P Index ("Index") shown is a product of S&P Dow Jones Indices LLC and/or its affiliates and has been licensed for use by Capital Group. Copyright © 2026 S&P Dow Jones Indices LLC, a division of S&P Global, and/or its affiliates. All rights reserved. Redistribution or reproduction in whole or in part is prohibited without written permission of S&P Dow Jones Indices LLC.
All Capital Group trademarks mentioned are owned by The Capital Group Companies, Inc., an affiliated company or fund. All other company and product names mentioned are the property of their respective companies.
Portfolios are managed, so holdings will change.
Certain fixed income and/or cash and equivalents holdings may be held through mutual funds managed by the investment adviser or its affiliates that are not offered to the public.
Totals may not reconcile due to rounding and/or cash flows.
Investment results assume all distributions are reinvested and reflect applicable fees and expenses.
Certain share classes were offered after the inception dates of some funds. Results for these shares prior to the dates of first sale are hypothetical based on the original share class results without a sales charge, adjusted for typical estimated expenses.
- Class F-2 shares were first offered on 8/1/2008.
Use of this website is intended for U.S. residents only.
Capital Client Group, Inc.
This content, developed by Capital Group, home of American Funds, should not be used as a primary basis for investment decisions and is not intended to serve as impartial investment or fiduciary advice.
© 2026 Morningstar, Inc. All rights reserved. The information contained herein: (1) is proprietary to Morningstar and/or its content providers; (2) may not be copied or distributed; and (3) is not warranted to be accurate, complete or timely. Neither Morningstar, its content providers nor Capital Group are responsible for any damages or losses arising from any use of this information. Past performance is no guarantee of future results. Information is calculated by Morningstar. When applicable, due to differing calculation methods, the figures shown here may differ from those calculated by Capital Group.