Plan sponsors face ongoing scrutiny over the performance of their qualified default investment alternative (QDIA) selections, especially within target date products. In recent years, several legal cases have been filed against plan sponsors and fiduciaries alleging Employee Retirement Income Security Act (ERISA) violations tied to the underperformance of their selected target date funds. While some of those cases have been dismissed, several of them have advanced to class action status.
With the panoply of target date funds (TDFs) available for plan sponsors and fiduciaries to choose from — running the spectrum from fully active to fully passive and with differing approaches to various asset class exposures and other characteristics — this increase in litigiousness raises the stakes when it comes to QDIA manager selection and monitoring. A sole focus on fees has never been enough to justify the choice of QDIA, and now participant outcomes net of fees (as well as their durability and consistency) are increasingly called into question.
Not only is choosing and keeping an underperforming QDIA solution a potential legal threat for plan sponsors, but it can also be very costly. After years of litigation, UnitedHealth Group agreed to settle its class action lawsuit in December 2024. The company agreed to pay $69 million to about 300,000 current and former participants of its 401(k) Savings Plan, according to a court filing.
In the past, judges have been appropriately skeptical of returns-focused litigation. Now that some of these cases have been elevated to class action status, it signals a significant shift that may spark even further scrutiny, especially given the wide dispersion of investment results among providers.
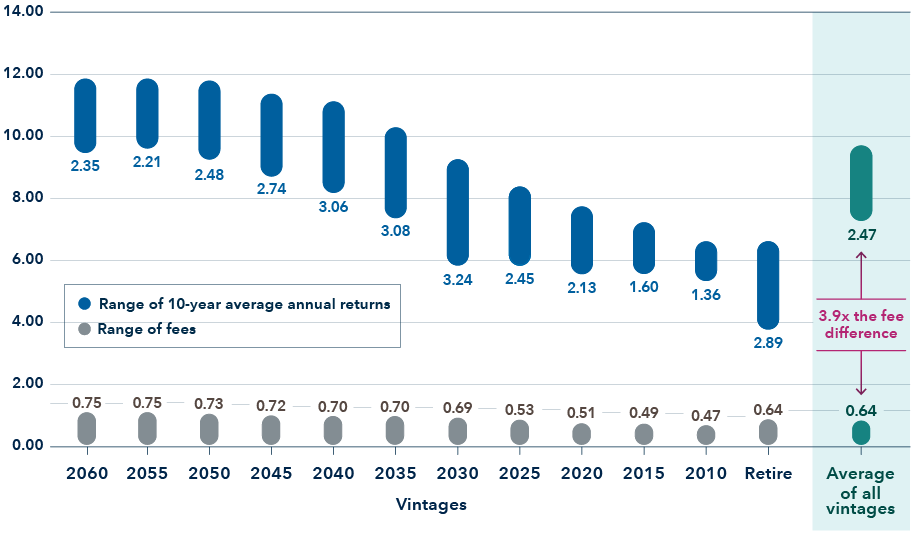
On average, the dispersion of participant outcomes has been 3.9 times greater than the dispersion of fees among target date providers.