Interest Rates
Categories
Asset Allocation
3 reasons why 60/40 portfolios may make a comeback
 Hilda Applbaum
 David Hoag
February 2, 2023
The death of the 60/40 portfolio has been greatly exaggerated.
Ask your search engine, “Is the 60/40 portfolio dead?” and it will generate about half a million results, many of them published recently. Following a difficult year for both stocks and bonds, the increased interest is understandable.
The 60/40 portfolio — shorthand for a diversified portfolio built with 60% equities and 40% fixed income — is intended to generate solid returns while minimizing risk. This did not happen in 2022, as stocks and bonds declined in tandem.
Investors expressed their disappointment with their dollars, withdrawing $43.6 billion from strategies in Morningstar’s “Allocation — 50% to 70% Equity” category in 2022. That followed a period when investors withdrew billions from such strategies in six of seven years for different reasons, including when stock markets were soaring.
“We saw a lot of folks exit balanced strategies in 2022,” says Hilda Applbaum, an equity portfolio manager for American Balanced Fund®. “While there is a lot of wisdom in markets, there also is a herd mentality. I believe many investors have become disbelievers in balanced strategies at the wrong time. I am confident that, going forward, balanced portfolios — whether they are a 60/40 split or 65/35 — may continue to be a successful approach for most investors over the long term.”
Investors have pulled billions of dollars from balanced strategies
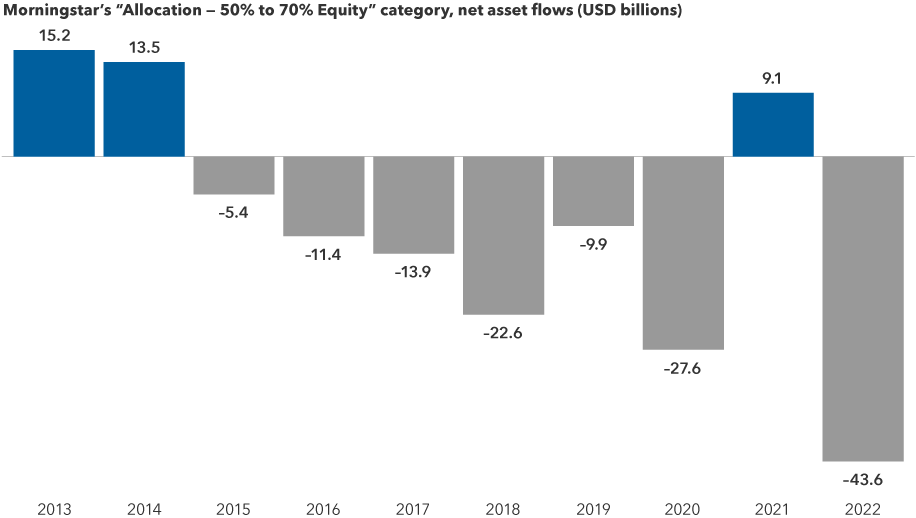
Sources: Capital Group, Morningstar. Figures reflect the total estimated combined net flow of funds across exchange-traded funds (ETFs) and mutual funds that fall into the Morningstar category “Allocation — 50% to 70% Equity,” and broadly represent funds that reflect a roughly 60/40 blend between equity and bond exposure, respectively. Data as of 12/31/2022.
Below, Applbaum, who invests in both stocks and bonds, and David Hoag, a fixed income portfolio manager with The Bond Fund of America®, share three reasons they believe conditions today are more favorable for balanced investing, as well as perspective on how they see balanced approaches evolving.

Capital Ideas™ webinars
Insights for long-term success
CE credit available
Reason #1: 2022 was an anomaly, not the norm
Last year stands out as the only time in the past 45 years that both stocks and bonds declined in tandem for a full calendar year. “The culprit for the chaos in both stocks and bonds last year was the Fed’s aggressive rate hikes,” Hoag says. “I think it’s very reasonable to say that bonds will go back to offering diversification benefits as we near the end of the tightening cycle.”
Applbaum says such correlation between the two asset classes won’t likely repeat soon. “With stocks and bonds correlated in terms of their returns, I believe last year reflected an inflection point, not a new normal,” she says.
Most investors had never faced a year as challenging as 2022
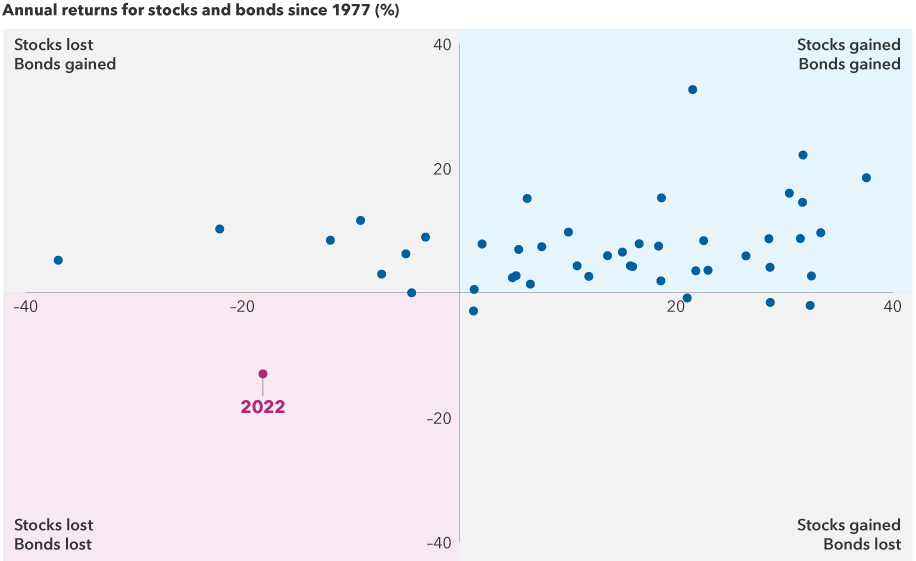
Sources: Capital Group, Bloomberg Index Services Ltd., Standard & Poor's. Each dot represents an annual stock and bond market return from 1977 through 2022. Stock returns represented by the S&P 500 Index. Bond returns represented by the Bloomberg U.S. Aggregate Index. Past results are not predictive of results in future periods.
Once the Fed gets inflation under reasonable control, it will have more flexibility, and investors can likely expect bond markets to zig when stock markets zag.
Reason #2: Attractive income is back in fixed income
If there’s a silver lining to the aggressive Fed action, it’s that most classes of bonds are offering significantly higher yields than a year ago. The yield on the Bloomberg U.S. Aggregate Index, a widely used benchmark for investment-grade (BBB/Baa and above) bond markets, was 4.25% as of January 25, 2023. That compares to 1.75% on December 31, 2021. The yields for the Bloomberg U.S. Corporate Investment Grade Index and Bloomberg U.S. Corporate High Yield Index stood at 4.96% and 8.16%, respectively, on January 25.
Dating back to the 2008–2009 global financial crisis, historically low rates meant that investors were not able to count on bonds to make much of a contribution to a portfolio’s total return. But with bonds offering higher potential income today, investors may be able to take less risk with their equity investments and still meet their return expectations.
“Today many core bonds can provide a dependable return in the mid-single digits,” Applbaum says. “And investors who are comfortable taking a little more risk by including some investment-grade and high-yield bonds can look for their bond portfolios to potentially contribute even more to a portfolio’s total return. That means you can take less risk with respect to your allocation to stocks in your pursuit of income and total return.”
Reason #3: Dividends can make a difference
If a bond portfolio can provide mid-single digit returns or better, dividends can potentially contribute to an attractive overall return picture within a portfolio’s equity allocation — without taking undue risk.
Historically, dividend-paying stocks have tended to be less volatile than growth stocks. And although dividends accounted for a slim 16% of total return for the S&P 500 Index in the 2010s, historically they have contributed an average 38% from January 1, 1926, to November 30, 2022. In the inflationary 1970s, they climbed to more than 70%.
Many investor portfolios don’t focus on dividend payers
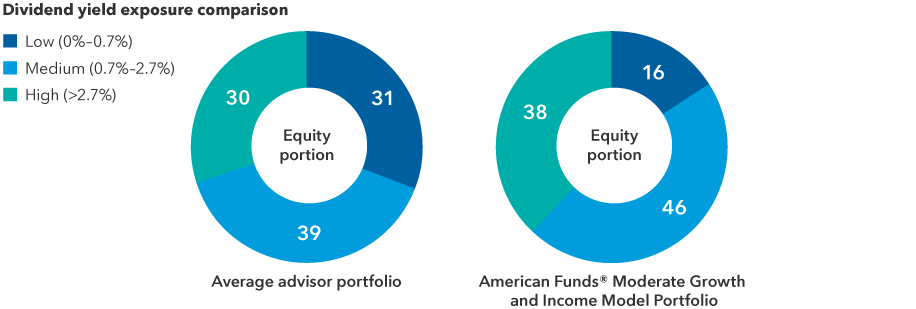
Sources: Capital Group, FactSet and Morningstar. Totals may not reconcile due to rounding. The average advisor portfolio is representative of the aggregate exposures of 543 portfolios analyzed by Capital Group’s Portfolio Consulting and Analytics team from 10/1/2022 to 12/31/2022. The American Funds Moderate Growth and Income Model Portfolio represents the most recent available data calculated as of 12/31/2022. This model aligns closely to the broad asset allocation of the average advisor portfolio.
“For the first time in a long time, I get to talk about the importance of dividends in terms of shareholder returns,” says Applbaum. “When interest rates were zero, companies really didn't have to think about their cost of capital. They could have lower hurdle rates in terms of returns on investment. Now that capital isn’t free they must be more thoughtful about how they can get the best return on investment, in addition to being thoughtful about when it makes more sense to return money to shareholders in the form of dividends.”
Bottom line: Look for better returns, lower risk in 2023
There are several reasons investors can expect a 60/40 portfolio to deliver better potential returns and lower volatility in 2023 and beyond. Bonds today are offering higher yields than a year ago, and with the Fed taking a less aggressive approach to rate hikes lately, interest rate volatility will likely be more muted. Valuations across a range of stocks are more attractive than they were a year ago as well.
But it is important to remember that there is more to balanced investing than deciding on how much equity and how much fixed income to include in a portfolio. “These aren’t monolithic allocations,” explains Applbaum. “For example, growth stocks and dividend payers offer very different risk-reward profiles. So successful balanced investing depends not simply on how much equity is in a portfolio but also what kind of equity is in a portfolio.”
A balanced portfolio would have outpaced other strategies over the past 16 years
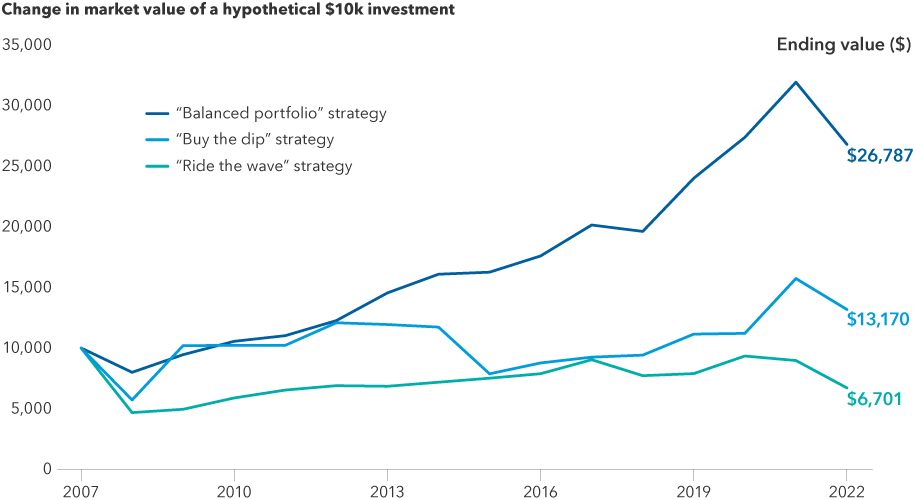
Sources: Capital Group, Bloomberg Index Services Ltd., FTSE Russell, ICE Benchmark Administration Ltd., MSCI, Refinitiv Datastream, Standard & Poor's. Returns figures are as of December 31, 2022. "Buy the dip" strategy represents buying the prior year's worst performing asset class every year. "Ride the wave" strategy represents buying the prior year's best performing asset class every year. "Balanced portfolio" strategy represents maintaining a 60/40 split between U.S. large cap stocks (represented by the S&P 500 Index) and U.S. core bonds (represented by the Bloomberg U.S. Aggregate Index). This assumes the portfolios are rebalanced annually. Past results are not predictive of results in future periods.
“Last year many types of asset allocation models failed to deliver on their pursuit of solid returns with moderate risk,” Applbaum adds. “But that followed a long period of relative success. Asset allocation is not a broken or failed strategy. It will always make sense to think about balance, diversification and risk in portfolios. But a one-size-fits-all approach doesn’t work. It’s about building portfolios from the bottom up that align with investor objectives.”
Learn more about
The return of principal for bond funds and for funds with significant underlying bond holdings is not guaranteed. Fund shares are subject to the same interest rate, inflation and credit risks associated with the underlying bond holdings. Lower rated bonds are subject to greater fluctuations in value and risk of loss of income and principal than higher rated bonds. Bond ratings, which typically range from AAA/Aaa (highest) to D (lowest), are assigned by credit rating agencies such as Standard & Poor's, Moody's and/or Fitch, as an indication of an issuer’s creditworthiness.
The indexes are unmanaged and, therefore, have no expenses. Investors cannot invest directly in an index.
Bloomberg U.S. Aggregate Index represents the U.S. investment-grade fixed-rate bond market.
Bloomberg U.S. Corporate Investment Grade Index represents the universe of investment grade, publicly issued U.S. corporate and specified foreign debentures and secured notes that meet the specified maturity, liquidity and quality requirements.
Bloomberg U.S. Corporate High Yield Index covers the universe of fixed-rate, non-investment grade-debt.
The S&P 500 Index is a market capitalization-weighted index based on the results of approximately 500 widely held common stocks.
BLOOMBERG® is a trademark and service mark of Bloomberg Finance L.P. and its affiliates (collectively “Bloomberg”). Bloomberg or Bloomberg’s licensors own all proprietary rights in the Bloomberg Indices. Neither Bloomberg nor Bloomberg’s licensors approves or endorses this material, or guarantees the accuracy or completeness of any information herein, or makes any warranty, expressed or implied, as to the results to be obtained therefrom, and, to the maximum extent allowed by law, neither shall have any liability or responsibility for injury or damages arising in connection therewith.
London Stock Exchange Group plc and its group undertakings (collectively, the “LSE Group”). © LSE Group 2023. FTSE Russell is a trading name of certain of the LSE Group companies. FTSE® and Russell® indexes are trademarks of the relevant LSE Group companies and are used by any other LSE Group company under license. All rights in the FTSE Russell indexes or data vest in the relevant LSE Group company which owns the index or the data. Neither LSE Group nor its licensors accept any liability for any errors or omissions in the indexes or data and no party may rely on any indexes or data contained in this communication. No further distribution of data from the LSE Group is permitted without the relevant LSE Group company’s express written consent. The LSE Group does not promote, sponsor or endorse the content of this communication.
©2023 Morningstar, Inc. All rights reserved. The information contained herein: (1) is proprietary to Morningstar and/or its content providers; (2) may not be copied or distributed; and (3) is not warranted to be accurate, complete or timely. Neither Morningstar nor its content providers are responsible for any damages or losses arising from any use of this information. Past performance is no guarantee of future results.
MSCI has not approved, reviewed or produced this report, makes no express or implied warranties or representations and is not liable whatsoever for any data in the report. You may not redistribute the MSCI data or use it as a basis for other indices or investment products.
The S&P 500 Index is a product of S&P Dow Jones Indices LLC and/or its affiliates and has been licensed for use by Capital Group. Copyright © 2023 S&P Dow Jones Indices LLC, a division of S&P Global, and/or its affiliates. All rights reserved. Redistribution or reproduction in whole or in part are prohibited without written permission of S&P Dow Jones Indices LLC.
Our latest insights
-
-
-
Municipal Bonds
-
Artificial Intelligence
-
Target Date
RELATED INSIGHTS
-
Portfolio Construction
-
Portfolio Construction
-
Portfolio Construction
Never miss an insight
The Capital Ideas newsletter delivers weekly investment insights straight to your inbox.
Investments are not FDIC-insured, nor are they deposits of or guaranteed by a bank or any other entity, so they may lose value.
Investors should carefully consider investment objectives, risks, charges and expenses.
This and other important information is contained in the fund prospectuses and summary prospectuses, which can be obtained from a financial professional and should be read carefully before investing.
Statements attributed to an individual represent the opinions of that individual as of the date published and do not necessarily reflect the opinions of Capital Group or its affiliates. This information is intended to highlight issues and should not be considered advice, an endorsement or a recommendation.
All Capital Group trademarks mentioned are owned by The Capital Group Companies, Inc., an affiliated company or fund. All other company and product names mentioned are the property of their respective companies.
Use of this website is intended for U.S. residents only. Use of this website and materials is also subject to approval by your home office.
American Funds Distributors, Inc.
This content, developed by Capital Group, home of American Funds, should not be used as a primary basis for investment decisions and is not intended to serve as impartial investment or fiduciary advice.