Private Markets Putting private markets in model portfolios: 3 key considerations

7 MIN ARTICLE

KEY TAKEAWAYS

  • Private markets can give investors access to a wider range of companies and investment opportunities, with the potential for stronger returns and enhanced diversification versus public market investing.
  • Model portfolios that use interval funds to access private markets can make these markets accessible to a broader range of investors.
  • Advisors could benefit from taking an active role in tailoring private market exposure to align with client goals.

Private markets have grown considerably in recent years, and the development of semi-liquid interval funds has made them more accessible to a broader range of investors. These trends create both opportunities and questions for advisors: Should you recommend that clients consider model portfolios with exposure to private markets? And what factors go into that decision?


Key considerations for advisors as you analyze this potential investment include opportunity, options and implementation.


 “Many advisors are already turning to model portfolios to save time and reduce the complexity of due diligence with help from asset management partners,” says Mario DiVito, multi-asset investment director at Capital Group. “As asset managers find ways to incorporate private market investment into model portfolios, advisors now have a new option to give clients a wider range of choices.”

The opportunity: Higher potential return in an expanding market


Private markets are expanding and maturing, with an estimated $16.1 trillion in assets under management in 2024, according to Cerulli.1 While private markets span different asset classes and vehicle structures, two key areas are: 


  • Private equity — investing in private companies or buying public companies to take them private, typically to help improve the business and create value through active ownership
  • Private credit — non-bank lenders providing capital to borrowers instead of through the public bond market or traditional banks


Several trends continue to fuel growth in private markets. More companies are choosing to go public later in their life cycle, in part because they can often meet their capital needs in private markets and may find that quarterly earnings pressures affect the ability to make long-term management decisions. On the credit side, growth stems from factors such as tighter bank regulation in traditional financing channels and increased flexibility with the terms and structure of private debt.

Private equity and credit correlations based on quarterly returns for the 20 years ended June 30, 2025

Two sets of bar charts: one set representing global private equity, the other private credit, specifically US direct lending. These charts show the correlation between the performances of global private equity and private credit with the S&P 500, MSCI ACWI ex USA and Bloomberg US Aggregate indexes. In each comparison, the correlations are less than 1. The correlations with the Bloomberg US Aggregate Index are negative.]

Source: Bloomberg, MSCI, Capital Group. Global private equity is represented by the MSCI Global Private Equity Closed-End Fund Index; Private credit (U.S. direct lending) is represented by the Cliffwater Direct Lending Index. Correlation is a statistical measure of how a security and an index move in relation to each other. A correlation ranges from -1 to 1. A positive correlation close to 1 implies that as one moved, either up or down, the other moved in “lockstep,” in the same direction. A negative correlation close to -1 indicates the two have moved in the opposite direction. Cliffwater Direct Lending Index data prior to September 30, 2015, is hypothetical. See disclosures for additional information.

Private markets can offer diversification potential for an investor with a portfolio that has been 100% invested in public markets. The opportunity set of investments is different, and managers have ways to add value beyond just selection.  Measured correlations between private and public market indices have historically been below 1, suggesting that public and private markets don’t typically move in the same direction, which indicates diversification potential.


Despite the potential benefits, private markets also come with additional risks. Investors give up some liquidity in exchange for the possibility of higher long-term returns, often called the illiquidity premium. Historically, private investments have outperformed similar public investments partly because investors were rewarded for committing their money for a longer period. 


“We believe private market investments have strong potential to continue adding long-term value relative to their public counterparts, even if the pace of return slows from previous decades,” says Wesley Phoa, solutions portfolio manager at Capital Group.

20-year annualized returns for 6/30/05-6/30/25 (%)

A bar chart comparing the 20-year annualized returns for the period of June 30, 2005 through June 30, 2025. The individual bar categories are labeled as private and public with only two groups labeled public: global private equity and private credit, also referred to as US direct lending. Global private equity had the highest returns, 13.3%, followed by US equity at 10.7% and private credit at 9.6%. All the other categories, US high yield, non US equity and US fixed income, were lower.]

Source: Bloomberg, MSCI, Cliffwater, Capital Group. Quarterly data from 6/30/2005–6/30/2025. Global private equity is represented by the MSCI Global Private Equity Closed-End Fund Index; U.S. equity is represented by the S&P 500; Private credit (U.S. direct lending) is represented by the Cliffwater Direct Lending Index; U.S. high yield is represented by the Bloomberg U.S. High Yield 2% Issuer Capped Index; Non-U.S. equity is represented by the MSCI ACWI ex USA Index; and U.S. fixed income is represented by the Bloomberg U.S. Aggregate Bond Index. All results listed are gross of fees, except for results for the MSCI Global Private Equity Closed-End Fund Index, which is comprised of private market drawdown funds and net of fees as well as carried interest paid by Limited Partners. Past results are not predictive of results in future periods. Cliffwater Direct Lending Index data prior to September 30, 2015, is hypothetical. See disclosures for additional information.

The options: Model portfolios can be a simpler path to private market access


For advisors and clients who have been exclusively invested in public markets, the first steps into private markets may feel daunting. What about the complexity of some investment vehicles? What about liquidity risk? What about fee structures? Accessing private markets through interval funds held in model portfolios can help address these concerns.


While traditional private markets set a high bar with minimum asset thresholds and strict limits on liquidity (as well as complex tax reporting), interval funds can offer private market exposure to a wider spectrum of investors. Interval funds often blend private assets with public investments, balancing access to capital with private market exposure and, in many cases, competitive fee structures. 


“A smaller minimum entry point is a key benefit of interval funds as a method of private investment,” Phoa says. “It opens the door to a sizable population of investors who have less available capital than traditional private market investors.”

 Mutual fundsExchange-traded funds (ETFs)Interval fundsPrivate market funds
Underlying assetsPrimarily stocks and/or bondsPrimarily stocks and/or bondsAbility to invest significantly in less liquid private assets (private credit, private equity, real estate)Private credit, private equity, real estate, infrastructure
LiquidityDailyIntradayCan only be sold periodically (typically quarterly) through fund repurchase offersIlliquid; capital is typically locked in for 10-12 years
Sale limitsNoneNoneUsually 5% of outstanding shares at the periodic intervalWithdrawals are heavily restricted; possible to sell on secondary market
Closed end?SomeNoYesYes
Tax efficiencyCapital gains distributions may be triggered when an underlying security is soldTend to have higher level of tax efficiency, due to externalization and in-kind redemptionsMore likely to hold assets for a longer period of time, lowering capital gains distributionsGenerally higher as assets are held for longer, but dependent on the type of underlying asset
Minimum investmentUsually $500 - $1K for the initial investmentThe price of a single share, or as little as $1 through fractional share tradingTypically $1K - $10KAs low as $25K


Source: Capital Group. For illustrative purposes only.

Manager selection is also important. Consider managers with long track records in private markets, clear reporting practices and a demonstrated ability to source opportunities, conduct due diligence and add value across market cycles. Manager quality has always mattered in capital markets, in general, but it has a special significance in private markets, where the difference between top- and bottom-quartile manager returns has been substantial over longer time periods.2

3. Implementation: Advisors can take an active role in tailoring private market exposure to meet client goals


A third consideration when investing in private markets is how to tailor private market exposure to align with client goals, a familiar consideration that applies to any kind of investment or portfolio construction decision. Does it fit the client’s time horizon, risk tolerance, liquidity needs and overall objectives?  


Consider a growth-oriented investor early in their career with a long time horizon and a high tolerance for risk. Although this investor may hold a portfolio focused entirely on public equities, adding a public-private equity interval fund could increase return potential while maintaining a greater degree of liquidity than a purely private fund would provide.


On the more conservative end, a retired investor who prioritizes capital preservation and income over growth may have less tolerance for liquidity constraints and market volatility, making private equity less appropriate. However, a modest allocation to private credit might still help enhance portfolio diversification and income potential. 


“Private markets are broad and growing even broader,” says Zechariah Lee, senior investment product specialist at Capital Group. “As the range of private market investment options continues to expand, we are identifying more ways to serve cautious investors.”


Many clients fall somewhere in the middle — mid-career investors with moderate risk tolerance and a 15- to 25-year time horizon. A targeted allocation to private equity and private credit alongside public investments may help broaden diversification while maintaining a degree of liquidity.


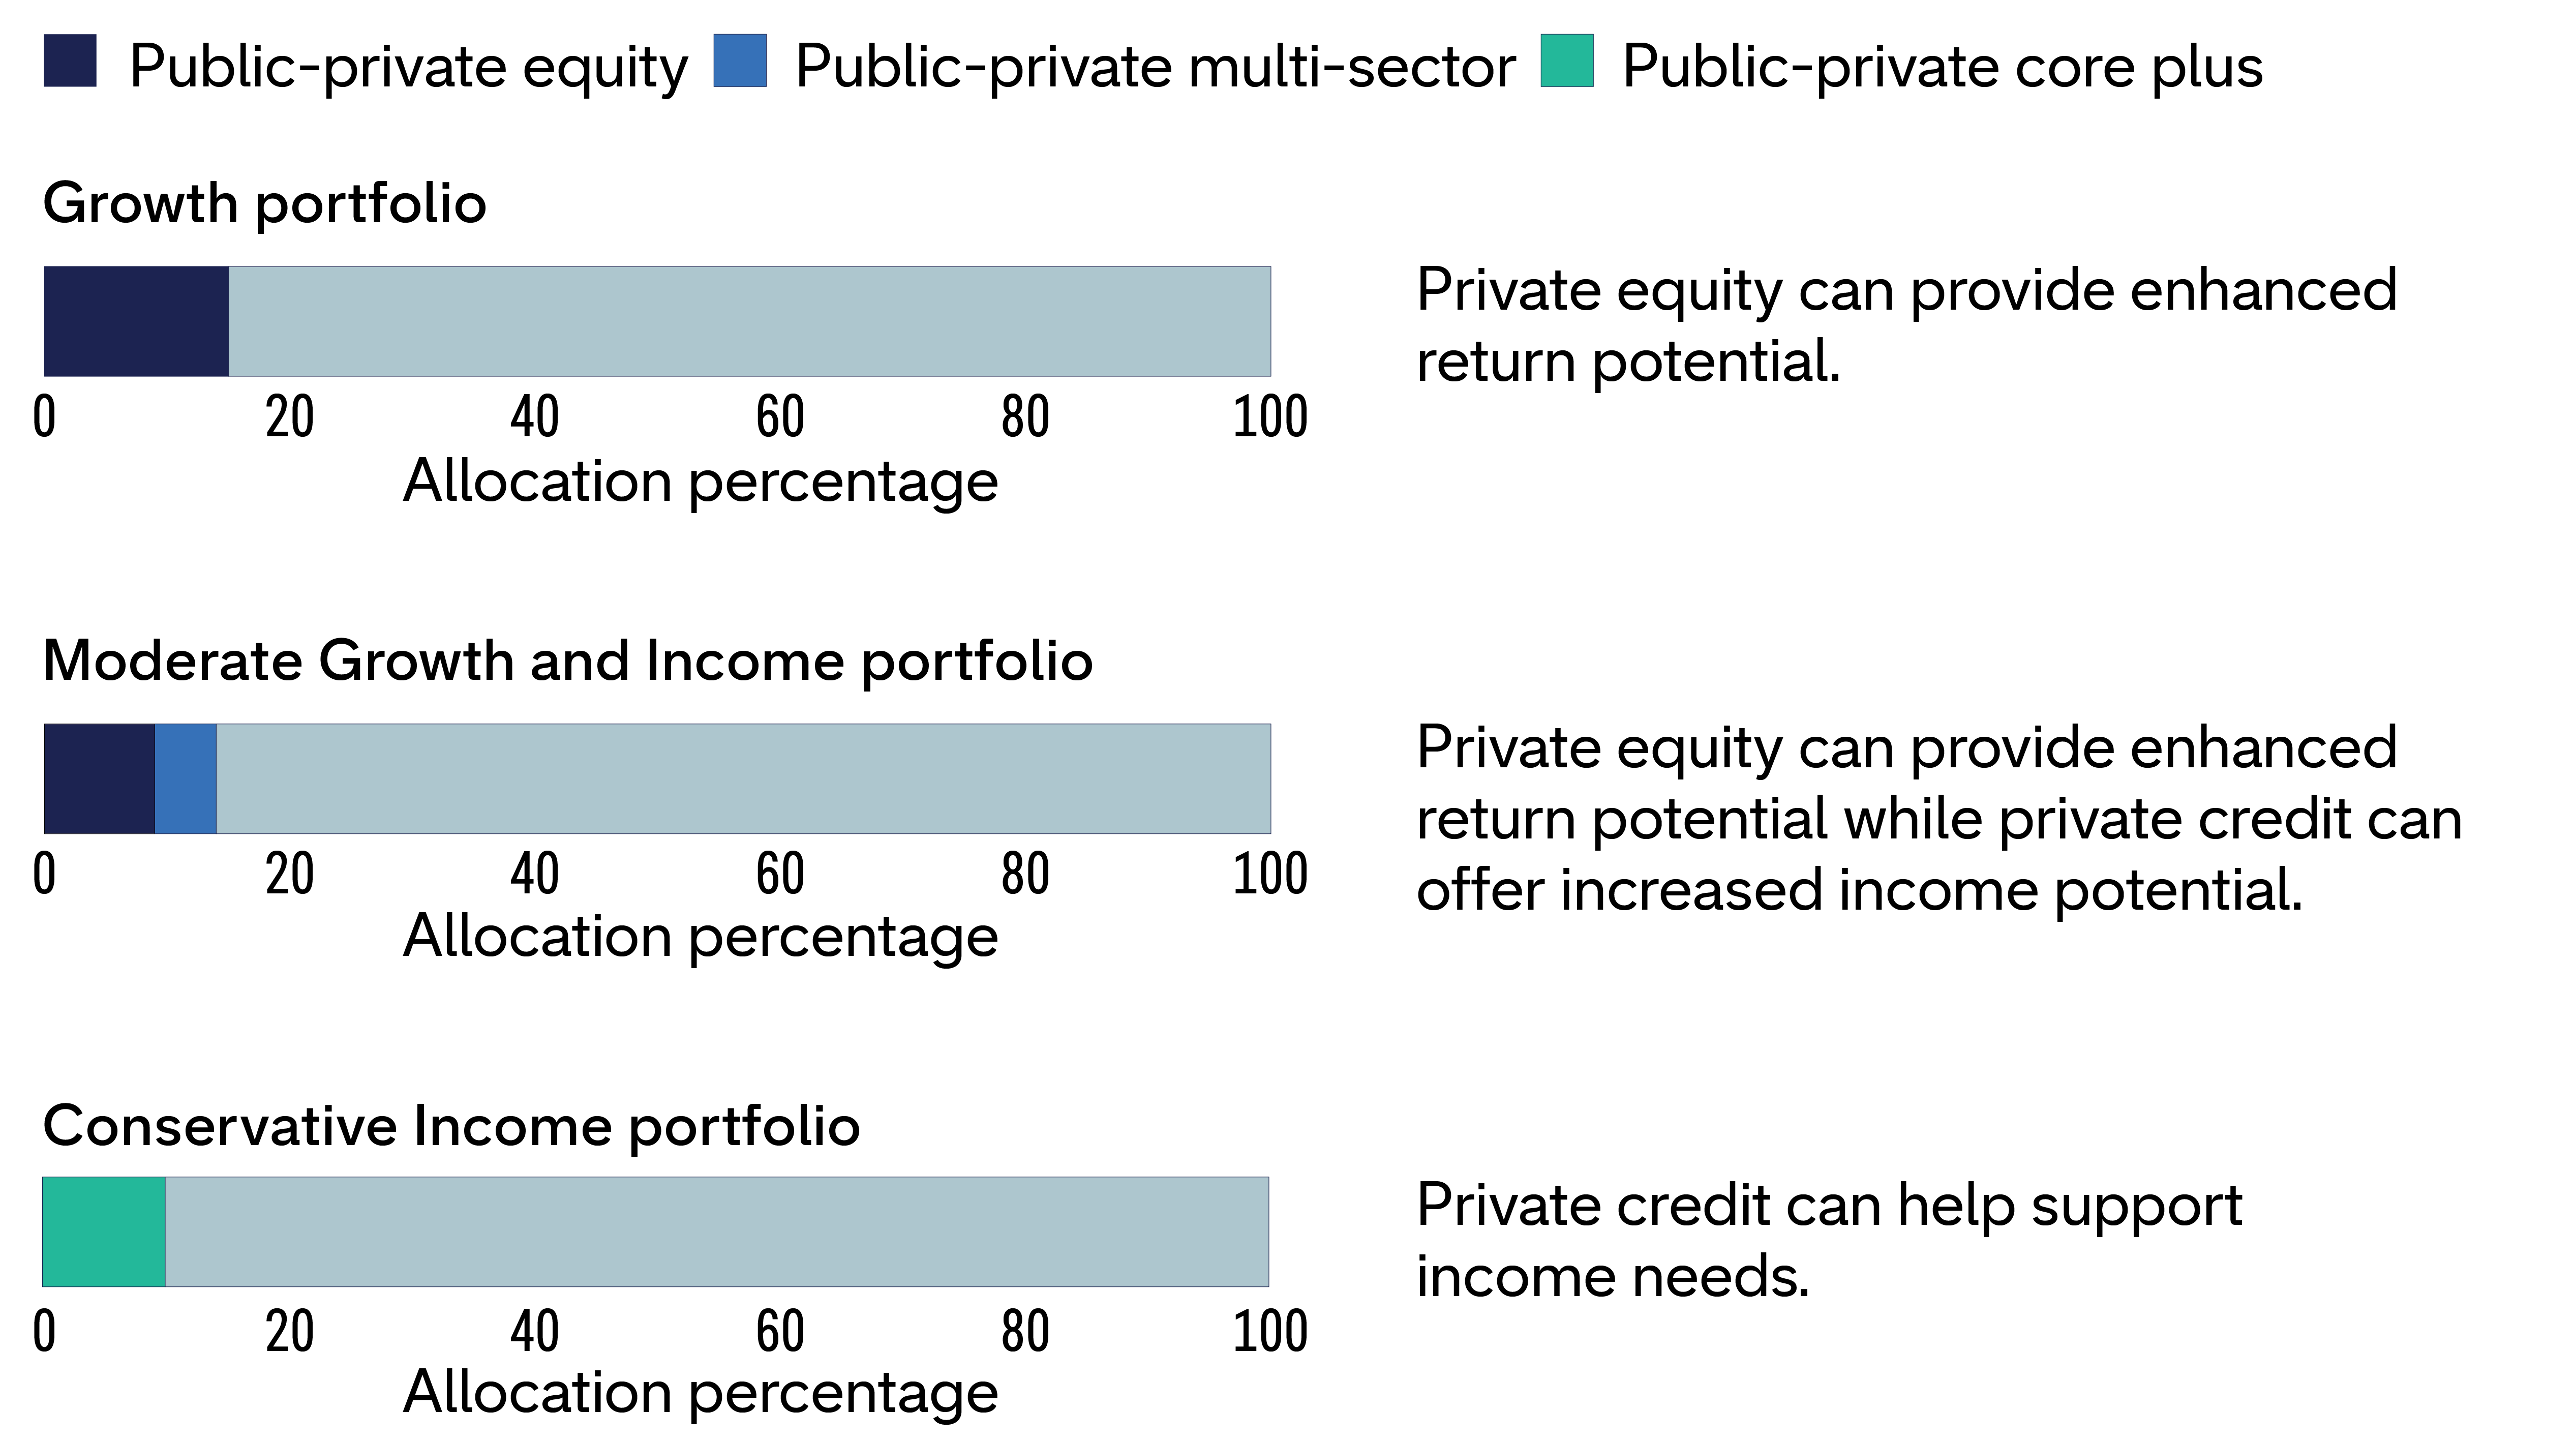
The framework below can help adapt private equity and credit allocations to client goals. These sample portfolios can serve as model portfolios or as a guide for advisors to build customized solutions, with allocations adjusted based on each client’s needs.

3 portfolio ideas for public-private equity investing

Adjust private equity and credit allocations to your clients’ needs

A chart showing three model portfolios with three different objectives (growth, moderate growth and income, conservative). For each model portfolio, it shows a proposed percentage of different private-public categories, represented by Capital Group KKR interval funds. For growth – roughly 15% to public private equity, for moderate growth and income about 10% to public private equity and 5% to public private multi sector and for conservative income about 10% to public private core plus.

Source: Capital Group. For illustrative purposes only.

The funds expect to make repurchase offers on a quarterly basis. The funds currently conduct quarterly repurchase offers for up to 10% of their outstanding shares under ordinary circumstances, subject to approval of the board. To the extent more than 10% of outstanding shares are tendered for repurchase, the redemption proceeds are generally distributed proportionately to redeeming investors (“proration”). Due to this repurchase limit, shareholders may be unable to liquidate all or a portion of their investment during a particular repurchase offer window. Written notification of each quarterly repurchase offer will be sent to shareholders around thirty (30) days before the date by which shareholders can tender their shares in response to a repurchase offer.

Bottom line


Combining private and public markets in model portfolios can provide access to a broader opportunity set and the potential for better investment outcomes, albeit while introducing new risks. Success depends on thoughtful consideration of liquidity, fees, valuations and manager selection.


As access to private markets expands, the focus for many advisors may shift from whether to include them, to how and for which clients. The ability to have insightful conversations about private markets with clients will help you better serve them, even if they ultimately opt not to include this exposure in their portfolios. 

Wesley Phoa is a solutions portfolio manager with 33 years of industry experience (as of 12/31/2025). He holds a PhD in pure mathematics from Trinity College at the University of Cambridge and a bachelor’s degree with honors from the Australian National University.

Mario DiVito is a multi-asset investment director with a focus on model portfolios and target date services. He has 37 years of investment industry experience (as of 12/31/2025). He holds an MBA from DePaul University and a bachelor’s degree in finance from Loyola University.

Zechariah Lee is a senior investment product specialist at Capital Group, home of American Funds. He has seven years of industry experience (as of 12/31/2025), all with Capital Group. Earlier in his career at Capital, Zechariah worked as an investment resource group analyst and before that, a core operations valuation associate. He holds a bachelor's degree in economics from Vassar College. Zechariah is based in Los Angeles.

1Sources: Based on data as of September 30, 2024, from the Cerulli Report “U.S. Private Markets 2025: Incorporating  Private Market Investments into Model Portfolios.” The total private investment asset calculation includes dry powder, representing double counting, or assets that are unaddressable to U.S. private capital managers.


2Sources: Capital Group, MSCI. Based on annual IRR for top and bottom quartiles of 5,242 private equity funds for vintage years 2000-2020. Internal Rate of Return (IRR) calculates an annualized growth rate while taking into account the amount and timing of cash flows. It is the return that equates the present value of all invested capital in an investment to the present value of all returns, or the discount rate that will provide a net present value of all cash flows equal to zero. Annualized return calculates an annualized growth rate from the beginning to the end of the investment period, or the percentage increase or decrease of an investment.


Investments in private equity, private credit, and related strategies involve substantial risks, including limited liquidity, long investment horizons, and the potential loss of capital. These strategies may entail exposure to illiquid or difficult‑to‑value investments, leverage, low or unrated credit instruments, structured products, derivatives, and operational risks within portfolio companies, as well as heightened market, economic, credit, and valuation risks, as applicable. Investors should consult with their financial professional when considering such strategies for their portfolios.


Capital Group and Kohlberg Kravis Roberts & Co. L.P. (“KKR”) are not affiliated. The two firms maintain an exclusive partnership to deliver public private investment solutions to investors. KKR serves as the sub-adviser of Capital Group KKR Core Plus+ and Capital Group KKR Multi-Sector+ with respect to the management of each fund's private credit assets. KKR is not a sponsor, promoter, investment adviser, sub-adviser, underwriter or affiliate of Capital Group KKR U.S. Equity+. 


The Cliffwater Direct Lending Index was launched on September 30, 2015. Data before this date is hypothetical (back-tested) and based on the methodology established at that time. Adjustments during back-testing aimed to capture a comprehensive universe of securities and simulate the target market or strategy, especially during market anomalies. Back-tested performance provides historical insights but has limitations, including survivorship and look-ahead biases. Actual returns may differ significantly from back-tested results, and past performance does not guarantee future results. Index returns shown do not reflect actual trading activities and exclude sales charges or fees associated with purchasing securities or investment funds tracking the Index. Additional fees and charges may impact performance of securities or funds compared to the Index. Market risks, including financial market fluctuations, liquidity risks, and regulatory risks, may affect the Index's performance. The Index may also be subject to concentration risks if heavily weighted towards specific sectors, industries, or geographic regions.


BLOOMBERG® is a trademark and service mark of Bloomberg Finance L.P. and its affiliates (collectively “Bloomberg”). Bloomberg or Bloomberg’s licensors own all proprietary rights in the Bloomberg Indices. Neither Bloomberg nor Bloomberg’s licensors approves or endorses this material, or guarantees the accuracy or completeness of any information herein, or makes any warranty, express or implied, as to the results to be obtained therefrom and, to the maximum extent allowed by law, neither shall have any liability or responsibility for injury or damages arising in connection therewith. 


The S&P 500 Index and the S&P Target Date Index are products of S&P Dow Jones Indices LLC and/or its affiliates and has been licensed for use by Capital Group. Copyright © 2026 S&P Dow Jones Indices LLC, a division of S&P Global, and/or its affiliates. All rights reserved. Redistribution or reproduction in whole or in part is prohibited without written permission of S&P Dow Jones Indices LLC. 


MSCI. The MSCI information may only be used for your internal use, may not be reproduced or redisseminated in any form and may not be used as a basis for or a component of any financial instruments or products or indices. None of the MSCI information is intended to constitute investment advice or a recommendation to make (or refrain from making) any kind of investment decision and may not be relied on as such. Historical data and analysis should not be taken as an indication or guarantee of any future performance analysis, forecast or prediction. The MSCI information is provided on an “as is” basis and the user of this information assumes the entire risk of any use made of this information. MSCI, each of its affiliates and each other person involved in or related to compiling, computing or creating any MSCI information (collectively, the “MSCI Parties”) expressly disclaims all warranties (including, without limitation, any warranties of originality, accuracy, completeness, timeliness, noninfringement, merchantability and fitness for a particular purpose) with respect to this information. Without limiting any of the foregoing, in no event shall any MSCI Party have any liability for any direct, indirect, special, incidental, punitive, consequential (including, without limitation, lost profits) or any other damages. Please refer to the data provider's website for more information. 


The indexes are unmanaged and, therefore, have no expenses. Investors cannot invest directly in an index.


Private markets include investments that are not traded on public exchanges, such as private equity, venture capital, real estate, and private credit or debt.


An interval fund is a nontraditional closed-end mutual fund. Unlike a conventional closed-end fund whose shares generally trade on an exchange, an interval fund periodically offers to buy shares back directly from shareholders at net asset value (NAV). 

Investments are not FDIC-insured, nor are they deposits of or guaranteed by a bank or any other entity, so they may lose value.
Investors should carefully consider investment objectives, risks, charges and expenses. This and other important information is contained in the fund prospectuses and/or summary prospectuses, which can be obtained from a financial professional and should be read carefully before investing.
All Capital Group trademarks mentioned are owned by The Capital Group Companies, Inc., an affiliated company or fund. All other company and product names mentioned are the property of their respective companies.
Use of this website is intended for U.S. residents only. Use of our website and materials is subject to approval by your home office.
Advisory services offered through Capital Research and Management Company (CRMC) and its RIA affiliates. Capital Client Group, Inc., member FINRA.
This content, developed by Capital Group, home of American Funds, should not be used as a primary basis for investment decisions and is not intended to serve as impartial investment or fiduciary advice.