
Many advisors look at risk and return statistics when screening and selecting fund managers, according to the Capital Group Portfolio Consulting and Analytics team. Advisors tend to focus on rankings — which funds had the best returns, especially over shorter term periods. But what factors might some advisors be missing when it comes to long-term portfolio success? Our portfolio consulting and institutional solutions teams have met with thousands of advisors and reviewed even more funds through multiple time periods over the years. Here’s what they’ve found has historically led to stronger portfolio outcomes, especially through periods of significant volatility.
October 24, 2024
6 MIN ARTICLE
Choosing the right manager screens can make a difference over the long term
Senior specialist Vincent Fu and others on Capital Group’s Institutional Solutions team have drawn from decades of research on portfolio analytics and met with many clients looking to assess their manager selection criteria. What they’ve found is that six factors stand out when it comes to results, with three rising to the top of the list: low expenses, manager ownership and downside capture.
Six factors have been associated with better results
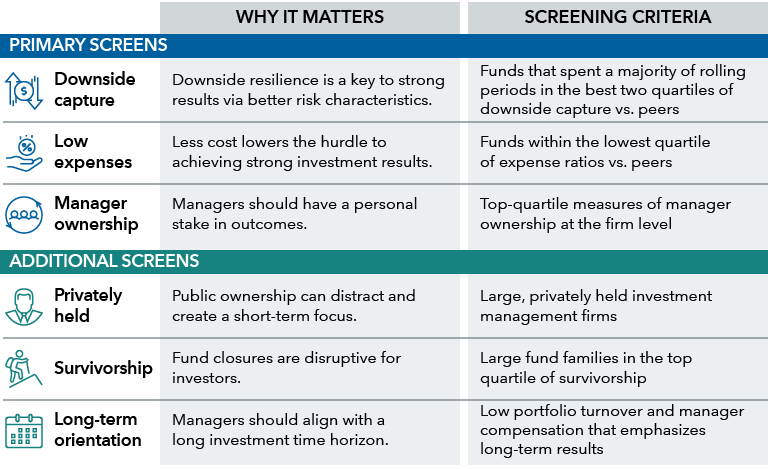
Source: Capital Group. Using the first three factors greatly narrows the universe of active managers, leaving a subset that has on average delivered enhanced outcomes to investors. The remaining three factors are additional metrics to consider to help act as “tie-breakers” where appropriate. In our view, the screens also reflect an asset manager’s culture and overall investment philosophy, which we think are important considerations when choosing investments.
Secondary screens include being privately held, long-term focus and survivorship (how often a manager eliminates a fund or strategy, which can sometimes obscure unwanted results). Other factors can suggest the potential for longer term positive results such as momentum, dividend yield and geographic flexibility. But why do the top three stand out?
Downside capture crucial yet often overlooked
Many advisors agree that reducing risk is vital to improving client portfolio outcomes. Yet they don’t always prioritize downside capture — which measures a fund’s results relative to its benchmark during periods of market weakness.
“Downside capture is one of the key factors that most affects risk over the long term,” according to Fu. (Low expenses and manager ownership have tended to be stronger indicators of long-term returns.) “Down capture is crucial in time periods when there are market corrections. But it’s also commonly overlooked by advisors,” Fu says.
“We find that relative risk metrics are more consistent than relative return. If you’re looking for a conservative manager you could start by assessing managers with a history of attractive downside capture,” Fu adds.
Fu and team have found that funds that have been conservative in the past tend to stay that way in future periods. For example, a fund that focuses on dividend-paying utility companies is less likely to invest in a negative cash flow biotech company.
“Our screening criteria identifies active funds that have consistently generated top 50th percentile better downside capture over their history,” Fu says.
The screened cohorts for both the U.S. large-cap universe and the global large-cap universe had higher 10-year rolling success rates and returns versus their unscreened cohorts and their respective benchmarks for the period from January 1996 to December 2023. In general, the downside capture screen has consistently found funds that have had reduced volatility, lower maximum drawdowns and more attractive down capture, especially when combined with screenings for firm manager ownership and low expenses.
Why screening for downside capture, low expenses and manager ownership matters
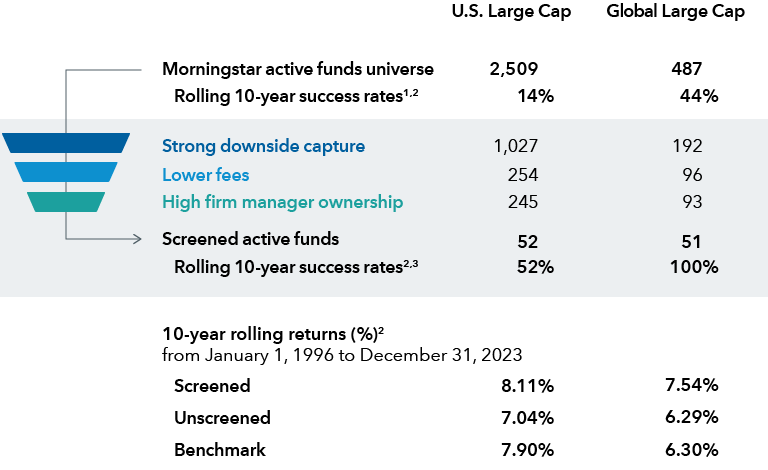
Sources: Capital Group, Morningstar as of December 31, 2023. U.S. Large Cap funds are those in the Morningstar Large Value, Large Blend and Large Growth categories. Global Large Cap funds are those in the Morningstar World Large Stock, Morningstar Global Large-Stock Blend, Global Large-Stock Growth and Global Large-Stock Value categories. These universes were screened as follows: Top 50% down capture filter for the U.S. large-cap universe versus the S&P 500 Index followed by cross section of top 25% lowest expense ratios and top 25% highest firm manager ownership in their fund. Top 50% down capture versus MSCI ACWI Index followed by cross section top 50% in both the lowest fees and highest firm manager ownership (given its smaller sampling size). Past results are not predictive of results in future periods. The indexes are unmanaged and therefore, have no expenses. Investors cannot invest directly in an index.
1Morningstar universe of active funds uses an asset-weighted methodology. This method can increase comparability between portfolios as compared with an equal-weighting methodology. For this analysis we relied on Morningstar Direct℠ data analysis software.
2Success rates are calculated at NAV for rolling 10-year periods on a monthly basis from 1/1/96 to 12/31/23. Returns are for the same period; the S&P 500 Index is the U.S. Large Cap benchmark, while the MSCI ACWI Index is the Global Large Cap benchmark.
3Results reflect funds within the specified Morningstar category that met the combined strong downside capture, low expense ratio and high firm manager ownership screens. Not all individual funds beat their benchmark.
Combining factors with incremental changes can add up in the long term
Often differences in return among the factors are small but incremental, with each screen increasing the chances of outpacing the benchmark over time.
“Combining the factors is very important for long-term impact,” Fu says. “Fees help a little, firm manager ownership helps a little more. If you combine the two, it helps even more. What I like to see is a stair step that improves your odds of meeting portfolio goals over the long term while increasing the likelihood of beating the benchmark,” Fu adds.
How incremental changes can impact long-term portfolio success
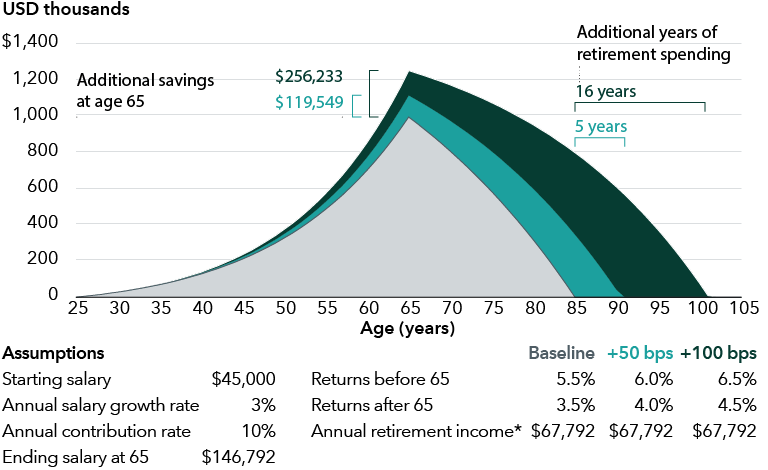
*Withdrawal that produces 20 years of income in the baseline scenario, which equates to a 46% income replacement.
Source: Capital Group. The demographic assumptions, returns and ending balances are hypothetical and provided for illustrative purposes only and are not intended to provide any assurance or promise of actual returns and outcomes. Returns will be affected by the management of the investments and any adjustments to the assumed contribution rates, salary or other participant demographic information. The additional years of retirement spending are intended to represent a conservative measure. Actual results may be higher or lower than those shown. Past results are not predictive of results in future periods. Based on an exhibit from Russell Investments.
“There are several issues when advisors have a narrow focus,” says senior portfolio consultant Greg Smith. “Being in the top quartile doesn't guarantee a fund will stay there. In fact, focusing too much on the top funds could introduce unintended risks in portfolios,” Smith says.
Recent investment results can be driven by trends that are difficult to decipher until they are over. The key risk of that approach is that investor portfolios are positioned for outcomes that have already happened. “But we can develop a framework for decision-making through periods of uncertainty,” Smith adds.
“Selecting good managers is a critical part of portfolio construction,” says Mark Barile, manager of the Capital Group Portfolio Consulting and Analytics team. “We encourage clients to think about their screening process as more than a view on past results, but rather a window into people, process, philosophy and durability of results.”
Want to talk through your approach to manager selection and screening?
Consider meeting with our Portfolio Consulting and Analytics team.

Vincent C. Fu is a senior client specialist with 21 years of investment industry experience (as of 12/31/2024). He holds an MBA from New York University and a bachelor's degree in business economics from the University of California, Los Angeles.

Greg Smith is a senior portfolio consultant with 20 years of investment industry experience. He holds a bachelor's degree in history and education from Taylor University. He also holds the Certified Financial Planner™ and Certified Investment Management Analyst® designations.

Mark Barile is a Senior Manager, Portfolio Consulting and Analytics with 20 years of industry experience as of 12/31/2025. He holds a bachelor's degree in studio art from Trinity University. He also holds the Certified Investment Management Analyst® designation.