Purchase Restrictions: Class F-2 shares are available through certain registered investment advisor and fee-based programs, but are not available for purchase in most employer-sponsored retirement plans. See the prospectus for details.
Coming soon: We’re refreshing our webpage design and introducing new data visualizations to serve you better. Stay tuned!
Coming soon: We’re refreshing our webpage design and introducing new data visualizations to serve you better. Stay tuned!
Summary
Internal Prompt
A balanced approach to growth-and-income investing.
With a diversified portfolio of quality stocks and bonds, this balanced strategy invests between 50% and 75% in equities, with flexible exposure to growth-oriented and dividend-paying stocks. The fixed income portion generally invests in investment-grade bonds, providing diversification from equities.
Price at NAV
$40.76
as of 7/10/2026 (updated daily)
Fund Assets (millions)
$288,086.6
Portfolio Managers
11
Expense Ratio
(Gross/Net %)
0.35 / 0.35%
(Gross/Net %)
Asset Mix
| U.S. Equities51.1% | |
| Non-U.S. Equities10.2% | |
| U.S. Bonds31.7% | |
| Non-U.S. Bonds2.5% | |
| Cash & Equivalents |
As of 5/31/2026
(updated monthly)
Morningstar Ownership ZoneTM
Moderate Allocation
Weighted average of holdings
75% of fund's stock holdings
Morningstar data as
of 3/31/26
(updated quarterly)
Returns
Internal Prompt
Growth of 10K
Read important investment disclosures
AMBFX
60%/40% S&P 500 Index/Bloomberg U.S. Aggregate Index
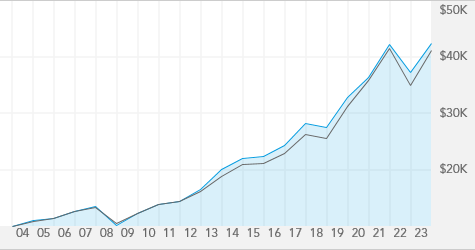
For Class F-2 Shares, this chart tracks a hypothetical investment with dividends reinvested, over the last 20 years, or since inception date if the fund has been in existence under 20 years, through 12/31/2025.
High & Low Prices
Ratings & Risk
Morningstar Rating TM
|
Overall Morningstar RatingTM
Funds rated(460)
|

|
|
3-yr. Morningstar RatingTM
(460 funds rated)
|
|
|
5-yr. Morningstar RatingTM
(440 funds rated)
|
|
|
10-yr. Morningstar RatingTM
(375 funds rated)
|
|
| Overall Morningstar Risk |
Average
HIGH
LOW
|
| Category | Moderate Allocation |
Ratings are based on risk-adjusted returns as of 6/30/2026 (updated monthly).
Lipper Leader Scorecard
| Overall Over-all | 3 yr. | 5 yr. | 10 yr. | |
|
Consistent Return Within Category Funds Rated |

|
|
|

|
|
Expense Within Category Funds Rated |
|
|
|
|
|
Preservation Within Category Funds Rated |
|
|
|
|
|
Tax Efficiency Within Category Funds Rated |
|

|
|
|
|
Total Return Within Category Funds Rated |
|
|
|
|
Category | Mixed-Asset Target Allocation Growth |
 KEY
KEY
HIGHEST

 LOWEST
LOWEST
As of 6/30/2026
(updated monthly)
%
of net assets as of 6/30/2026
(updated monthly)
Holdings
Equity Fund Holdings
| Information technology 20.4% | |
| Health care 7.2% | |
| Financials 6.8% | |
| Industrials 5.6% | |
| Communication services 5.2% | |
| Consumer discretionary 5.2% | |
| Consumer staples 3.9% | |
| Energy 3.3% | |
| Materials 2.5% | |
| Utilities 1.0% | |
| Real estate 0.8% |
% of net assets as of 6/30/2026 (updated monthly)
Prices & Distributions
Internal Prompt
|
2026 |