
August 4, 2025
Emerging markets debt (EMD) is navigating a pivotal moment in global finance. The uncertainty introduced by tariffs, tax reforms and other U.S. policies will help to shape the sector’s future. These policy shifts have redefined American economic leadership, creating both challenges and opportunities for developing nations adapting to a new global order.
While some regions face immediate economic pressures, others, particularly in South America, demonstrated resilience and potential for growth. The global trade environment remains fragile, with the impact of rising tariffs extending well beyond the U.S.-China tensions. This uncertainty demands that investors remain vigilant and adaptable.
Despite the ongoing volatility, the outlook for EMD remains reasonably constructive. Three compelling arguments support this more bullish view.
1. Policy resilience, rising credibility and strong fundamentals
Emerging market (EM) economies had already strengthened their policy frameworks before the recent global inflationary pressures. This proactive approach enabled them to respond quickly and often ahead of their developed market counterparts. Many EM central banks took decisive action to help anchor inflation expectations and reinforce their policy credibility, often acting more swiftly than their developed market peers.
Several EM central banks have recently begun cutting interest rates but have done so gradually for the most part — striking a balance between providing near-term economic support and preserving the flexibility to respond more aggressively if needed. This proactive approach reflects stronger institutional frameworks and a deeper understanding of inflation and growth dynamics.
Another notable shift in EM economies is how they manage debt. Many now issue debt in local currency and rely more heavily on domestic investors. This strategy reduces their exposure to foreign capital flight and currency volatility. Moreover, public and private debt levels remain manageable and generally lower than those in many advanced economies.
Domestic vs. foreign holders of government debt by country
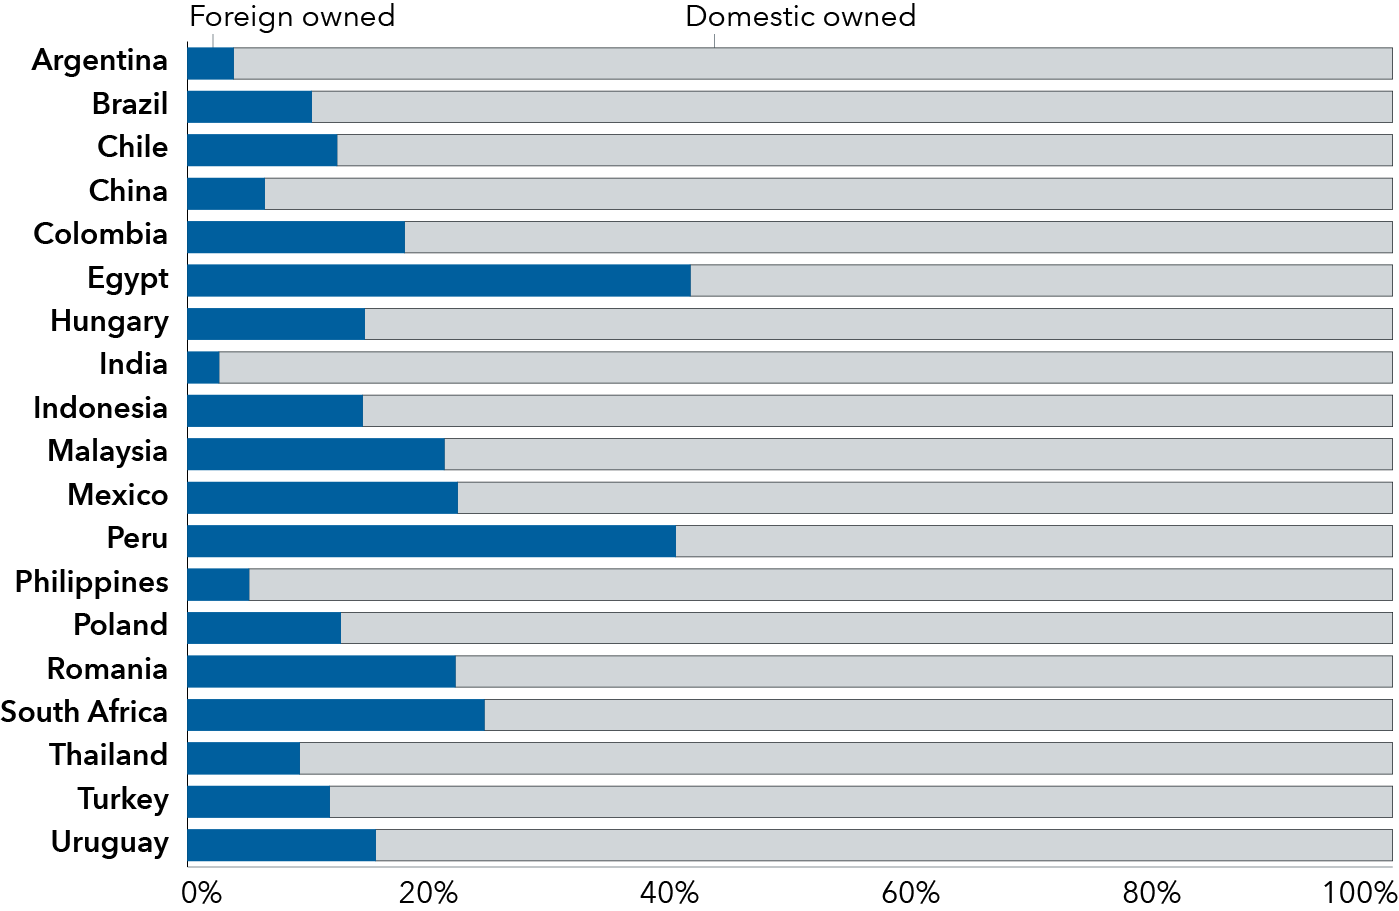
Source: International Monetary Fund as of 5/2/25. Data is as of 12/31/24.
Additionally, EMs are evolving in their approach to managing external risks. Countries once heavily indebted to foreign lenders are now building robust financial buffers, including ample levels of foreign exchange reserves.
Despite these improvements, investors often overlook EMs, clinging to developed markets within their comfort zone. While an understandable impulse, neglecting EMs can be detrimental: Many are not just weathering global volatility, they are adapting and thriving. Solid fundamentals, improved governance and rising domestic demand present diversification opportunities and long-term growth potential for investors.
In a world where developed markets face mounting debt and slowing growth, emerging markets stand out as a notable contrast.
2. Yield potential and robust opportunities in a diversified market
Real yields across several local rates markets — particularly in Latin America — are proving compelling. Countries such as Brazil and Mexico stand out for their relatively high real yields, macroeconomic stability and credible policy frameworks.
These opportunities come despite a challenging global backdrop. Uncertainty around U.S. interest rates, geopolitical tensions and an uneven recovery in China continue to pose risks. Still, local currency denominated EMD offers distinct potential advantages: diversification benefits, attractive yield premiums and undervalued currencies relative to the U.S. dollar. While short-term volatility is likely, long-term valuations remain favorable.
A potential turning point in the U.S. dollar cycle could significantly enhance the attractiveness of EM local currency debt. Over the past 10 to 15 years, a strengthening dollar has sometimes offset the excess returns of EM local bonds relative to U.S. Treasuries. However, a weaker dollar could reverse that trend, as appreciating EM currencies would directly boost returns for dollar-based investors. It would also ease pressure on EM central banks, reducing the need to raise interest rates defensively to support their currencies. This added policy flexibility would likely be supportive for local markets and further strengthen the investment case for EM debt.
In the hard currency sovereign space, a selective investment approach is advised. Investors may benefit from balancing allocations between high-quality, investment-grade issuers (rated BBB/Baa and above) and selective exposure to idiosyncratic high-yield bonds that offer attractive carry — defined as income from interest or yield — and sufficient total return to compensate for their higher credit risk and lower liquidity. As 2025 enters its second half, compelling opportunities are emerging in Sub-Saharan Africa and Latin America, highlighting the importance of a discerning and research-driven selection process.
Global comparison of inflation-adjusted yields
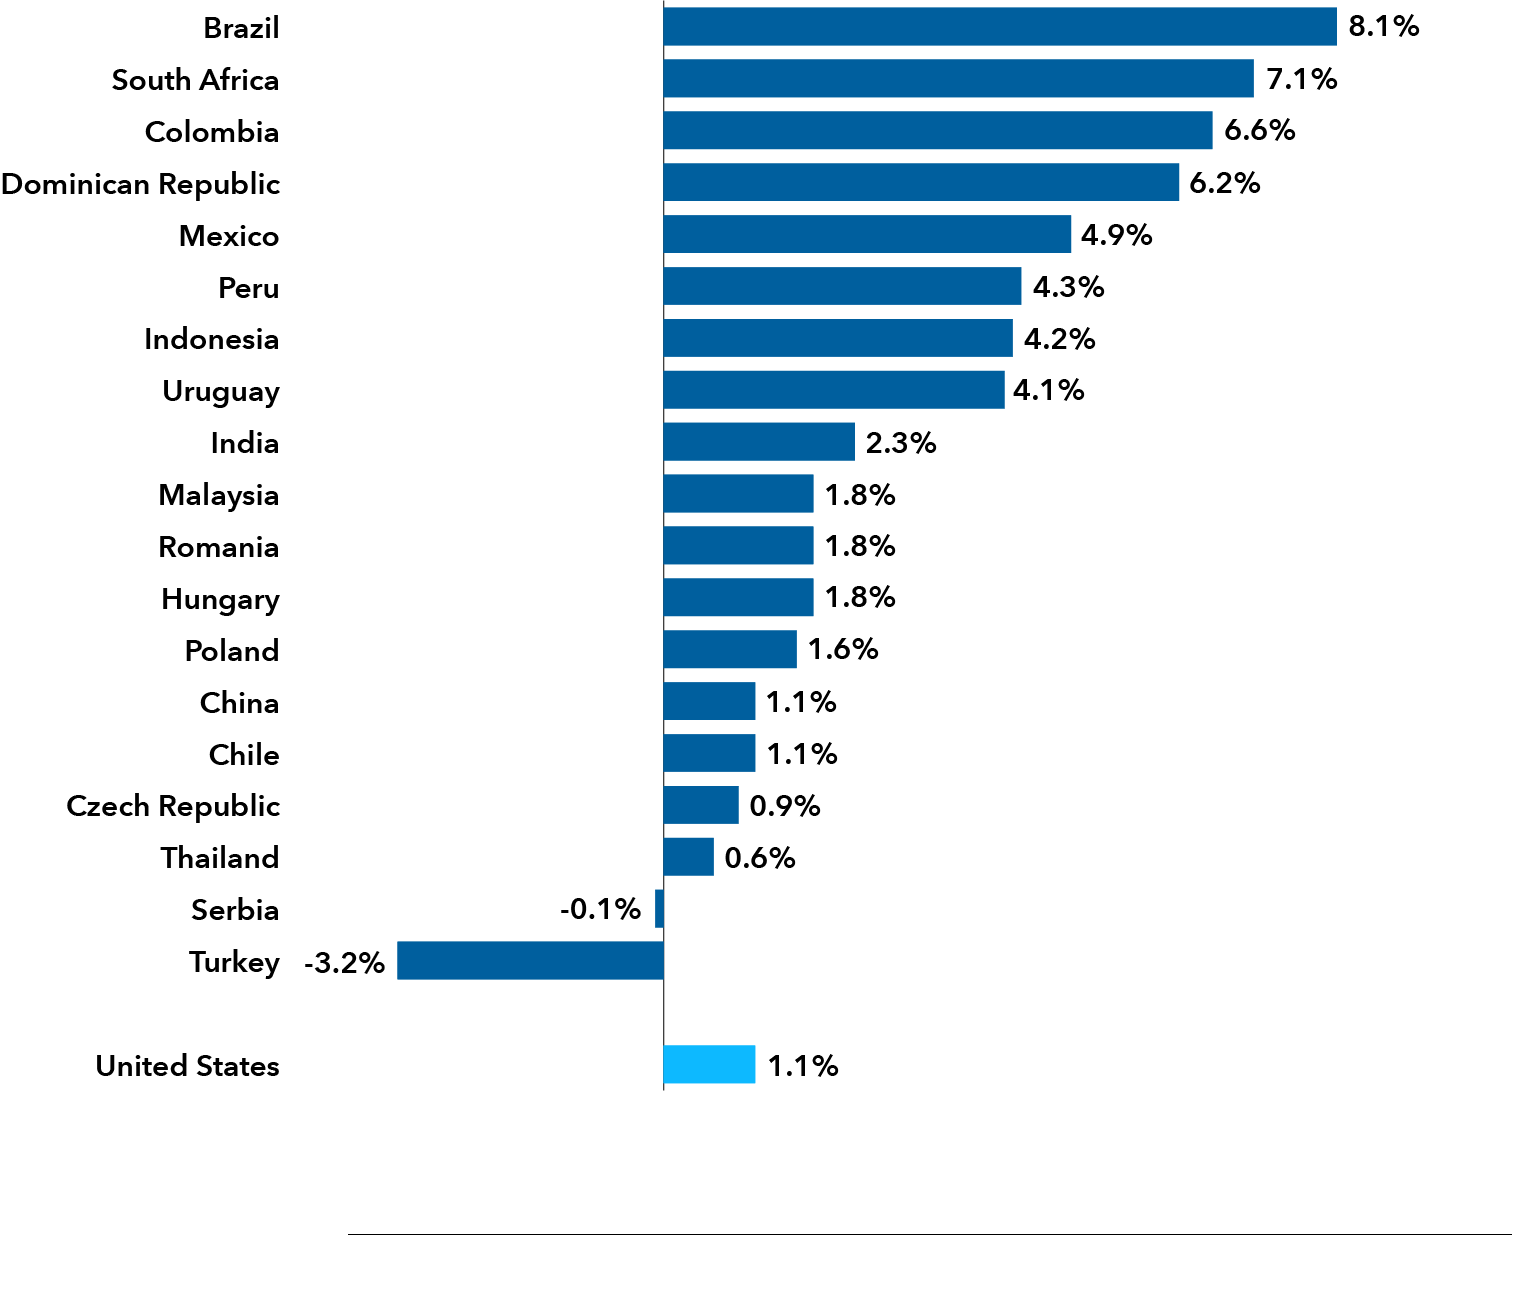
Sources: Bloomberg, J.P. Morgan. Data as of 06/30/25. The J.P. Morgan Government Bond Index – Emerging Markets (GBI-EM) Global Diversified and the 5-year U.S. Treasury yield minus core inflation are used to calculate the inflation-adjusted yields across various countries.
Corporate EMD can also serve as a valuable complementary allocation. Given the wide dispersion in credit quality across emerging market corporate issuers, thorough bottom-up analysis is essential to identify companies with resilience to withstand market fluctuations.
3. Strategic diversification benefits
The rapid pace of executive actions and geopolitical repositioning creates volatility and opens doors for investors who can navigate the complexity.
The U.S.'s retreat from traditional global leadership roles contributes to a more fragmented and uncertain geopolitical environment. This shift raises concerns about stability in regions such as Eastern Europe and East Asia while increasing the importance of country-specific analysis in EMD investing.
Despite facing challenges, many emerging markets are entering this period with stronger fundamentals. For instance, Brazil has demonstrated resilience through effective macroeconomic management and structural reforms. The country has introduced a new fiscal framework aimed at enhancing public spending efficiency and supporting long-term sustainability. Nonetheless, concerns persist regarding the trajectory of fiscal policy, contributing to elevated local yields. That said, these concerns may be overstated, and at current yield levels, investors appear well-compensated for the associated risks. Furthermore, Brazil's central bank has taken decisive steps to control inflation, bolstering its credibility and contributing to broader economic stability. EMD continues to offer attractive yields and diversification benefits, particularly where developed market assets face valuation pressures. A blended investment approach — balancing hard and local currency exposures — can help manage risk while capturing upside potential. Active management is especially critical in this environment, where macroeconomic shifts must be weighed against issuer-level fundamentals.
Attractive yields and diversification from EM bonds
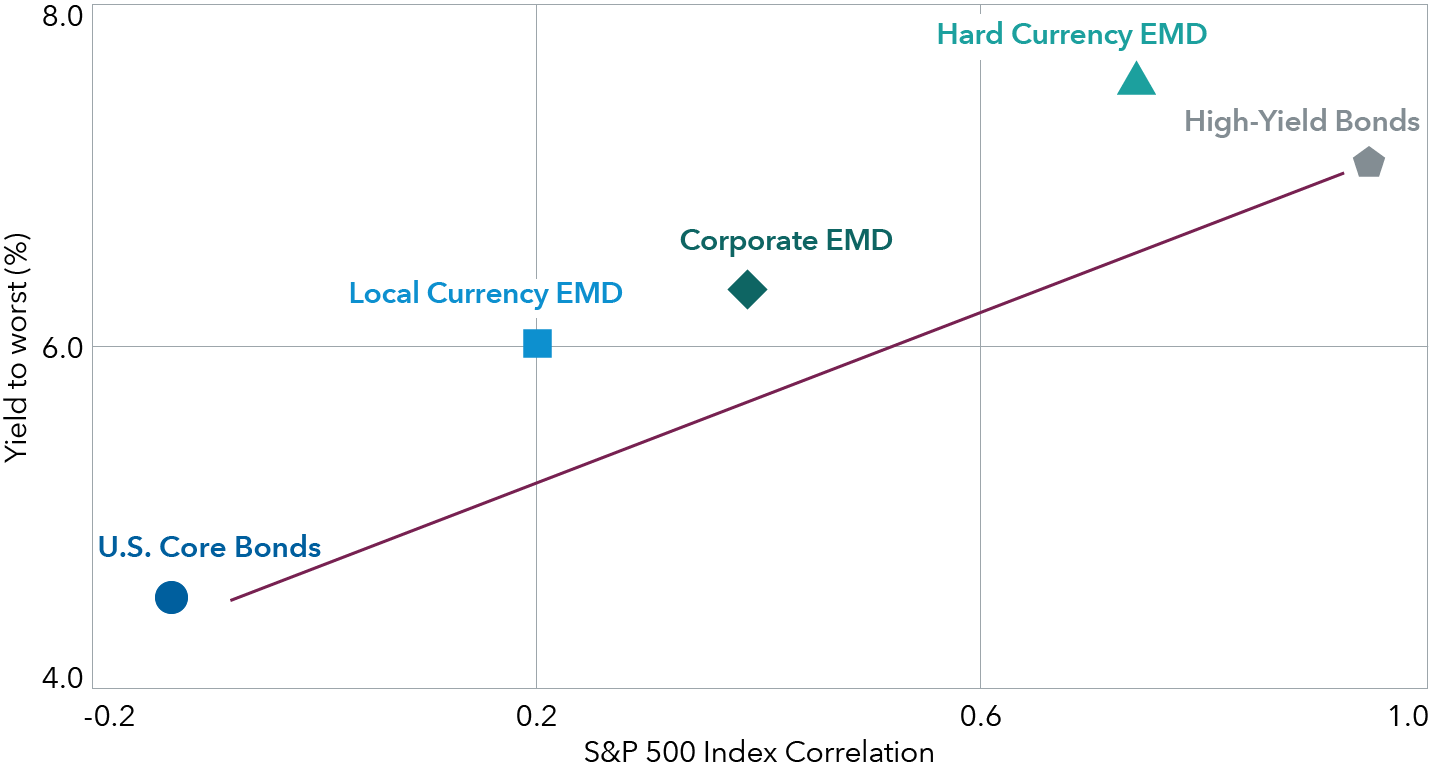
Sources: Bloomberg, J.P. Morgan. Data as of 06/30/25. The benchmark for U.S. Core Bonds is the Bloomberg US Aggregate Index. For EMD, the benchmarks are: the J.P. Morgan Government Bond Index – Emerging Markets (GBI-EM) Global Diversified for Local Currency EMD; the J.P. Morgan Corporate Emerging Markets Bond Index (CEMBI) Broad Diversified for Corporate EMD; and the J.P. Morgan Emerging Markets Bond Index (EMBI) Global Diversified for Hard Currency EMD. The benchmark for High-Yield Bonds is the Bloomberg US Corporate High Yield Bond Index.
While America’s political shift introduces new uncertainties, it also reinforces the strategic case for EMD. The asset class remains a potentially valuable source of income and diversification, particularly for investors seeking alternatives to concentrated developed market equities. In a world increasingly defined by geopolitical fragmentation and shifting alliances, EMD stands out as a potential source of income and diversification.
A truly emerging sector
Investors may find emerging markets debt an attractive source of diversification, resilience and yield amid global realignment. As developed markets grapple with mounting debt and slowing growth, many emerging economies benefit from strong fundamentals, credible policy frameworks and more stable political environments than in decades past. These improvements likewise can help stabilize their financial systems and enhance their appeal to global investors.
The evolving global trade landscape — shaped by tariff tensions and policy realignments — further underscores the importance of a diversified investment approach. EMD, when actively managed and strategically allocated across hard and local currency exposures, provides a compelling alternative to U.S.-focused fixed income strategies. With high real yields across a geographically and economically diverse issuer base, EMD stands out as a forward-looking asset class. It is not just a tactical play for investors navigating uncertainty, it could be a strategic long-term strategy.

Robert Burgess is a fixed income portfolio manager at Capital Group with 35 years of investment industry experience (as of 12/31/2024). He holds a master’s degree in economics from the University of London and a bachelor’s degree in politics and economics from Oxford University.

Harry Phinney is a fixed income investment director with 20 years of industry experience (as of 12/31/2025). He holds an MBA in international business from Northeastern University, a master's degree in applied statistics and financial mathematics from Columbia University and a bachelor's degree in international political economy, graduating magna cum laude, from Northeastern University.