Variations on value: A closer look at U.S. value investing

KEY TAKEAWAYS

  • Diversification from growth equities could be on the cusp of a sustained turnaround, given valuation and macro tailwinds.
  • For advisors and investors looking to reallocate, an appreciation of the diversity within the U.S. value spectrum is warranted.
  • Moreover, passive implementation within the value space can introduce various risks that select active managers may be able to avoid.

After more than a decade of growth style dominance and megacap‑driven returns, the U.S. equity market is changing — stretched valuations, widening dispersion and indexes increasingly reliant on a handful of companies. Beneath the surface, value investing is quietly regaining momentum.

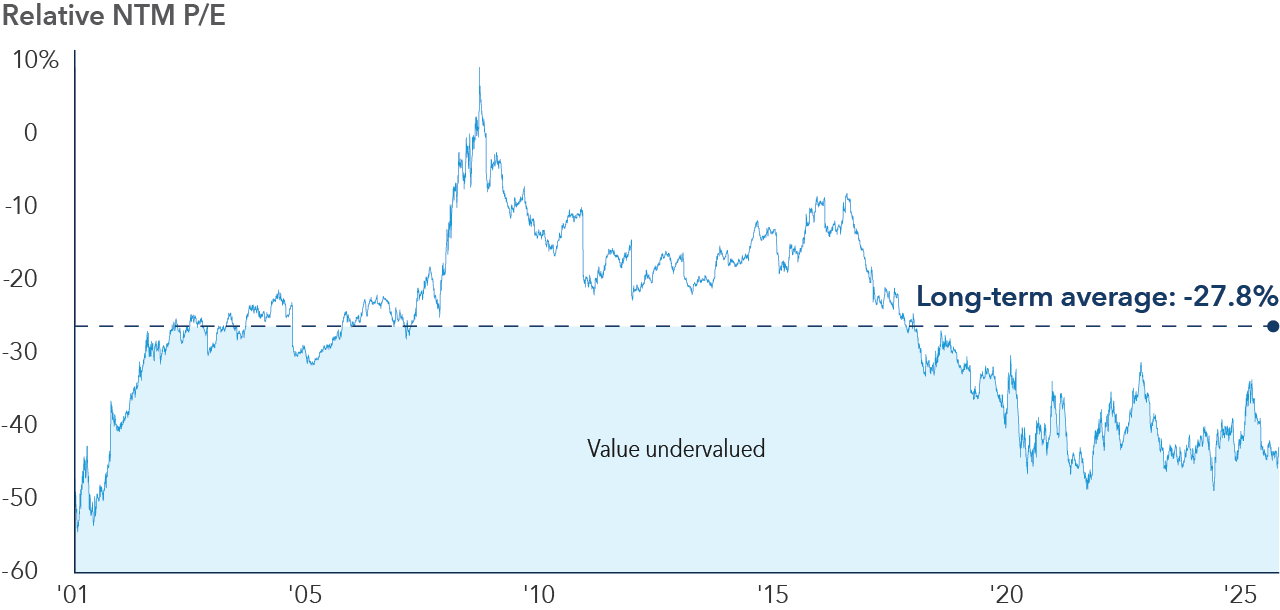
Recent performance underscores that shift. In the fourth quarter of 2025, the Russell 1000 Value Index outpaced its growth counterpart by 270 basis points (3.8% compared with 1.1%), cutting the Russell 1000 Growth Index’s full‑year advantage nearly in half. Valuations tell a similar story: While the S&P 500 Index cyclically adjusted price-to-earnings (CAPE) ratio nears 40 times earnings — levels historically linked to weaker forward returns — U.S. value equities continue to trade well below their average 27.8% discount to growth. 

Value vs. growth relative price-to-earnings

Russell 1000 Value Index vs. Russell 1000 Growth Index

Line chart depicts the relative forward 12-month price-to-earnings ratio between the Russell 1000 Value Index compared with the Russell 1000 Growth Index from 2001 to 2025. The long-term average is -27.8%. There was a period of gradual rise from 2001 to about 2005, followed by a period of greater increase around 2007 and a small dip in 2015. Finally, there was a steady decline through December 2025. In a brief period, during the 2007 rise, growth was undervalued versus value.

Sources: FactSet, London Stock Exchange Group, S&P Dow Jones Indices, J.P. Morgan Asset Management. Monthly data from January 1, 2001, to December 31, 2025. NTM: Next 12 months. P/E: Price-to-earnings.

For investors, that combination of mispriced entry points and the potential for multiple expansion creates a compelling risk‑reward backdrop at a time when active value managers are increasingly outpacing their benchmarks.
 

From a market structure lens, today’s benchmarks are also extremely top-heavy. The last time markets became this narrow, during the dot-com bubble, long‑term returns stalled for nearly a decade. Once leadership broadened, the market returned to an emphasis on fundamentals, which has historically favored value. We’re seeing hints of that today: Health care was the top appreciating sector within the S&P 500. From a global perspective, defensive sectors led cyclicals (5.3% versus 2.8%) within the MSCI All Country World Index (ACWI) in the fourth quarter of 2025.
 

A major part of this story sits beyond fundamentals in the macroeconomic backdrop itself. A steepening yield curve, with falling short‑term rates and firmer long‑term yields, is creating more favorable conditions for value‑oriented areas such as financials, industrials and energy. This effect is reinforced by the inflation backdrop. Research shows in high‑inflation regimes, value’s outperformance (7.4%) was nearly 15 times the 0.5% seen in low‑inflation environments. Even in moderate‑inflation conditions, value maintained a meaningful return advantage over growth.

Value has outperformed as inflation rose

Bar charts depict rising value excess return as inflation rises. From 1927–2020, excess returns for value were 0.5% for the lowest inflation regimes (less than 1.1%), 4.0% for moderate inflation regimes (1.1% to 4.4% ) and 7.4% for highest inflation regimes (greater than 4.4%). Current inflation is at 2.7% as of December 2025, which fits into the moderate inflation regime.

Sources: BlackRock, U.S. Bureau of Labor Statistics. The level of annual inflation is defined as the year-over-year change in the Consumer Price Index. Inflation data and value excess return is annualized and calculated using annual data from 1927 to 2020. Current inflation of 2.7% is as of December 2025. Value excess return represents the returns of value stocks minus growth stocks, as defined by the Fama-French HML research factor (i.e., high valuation minus low valuation, using book to price). Fama/French data uses the CRSP universe, which includes all companies incorporated in the U.S. and listed on the NYSE, AMEX or NASDAQ exchanges. 

As investors look to reintroduce value, the opportunity set is far from one‑dimensional. Across the value spectrum, approaches range from deep‑value turnarounds to quality‑oriented strategies that prioritize stability and dividends. Sitting between them is a growing category often referred to as total value — approaches designed to gather exposure across a full range of value opportunities, rather than anchor to one end of the spectrum. For many investors, this balanced profile can be especially compelling — offering exposure that can flex as markets rotate — while still staying grounded in valuation discipline.
 

Not all value exposure, however, is created equal. Passive approaches can unintentionally concentrate risk or pull portfolios into mid cap or structurally challenged names, because the benchmarks they are seeking to replicate may be focusing on these areas. These value traps may over-rely on simple valuation screens. Active approaches, grounded in fundamentals and security selection, can navigate these differences more deliberately as they seek to provide index-beating results.
 

In the paper linked below, we take a closer look at the value spectrum, highlighting where risks emerge, how styles differ and how fundamental research can help investors better capitalize on value opportunities.

Jacob M. Gerber is an equity and multi-asset investment director with 28 years of investment industry experience (as of 12/31/2025). He holds a bachelor’s degree in biology from University of California, Los Angeles.

Read all perspectives on equity markets

Investments are not FDIC-insured, nor are they deposits of or guaranteed by a bank or any other entity, so they may lose value.

The indexes are unmanaged and, therefore, have no expenses. Investors cannot invest directly in an index.
Source: MSCI. The MSCI information may only be used for your internal use, may not be reproduced or redisseminated in any form and may not be used as a basis for or a component of any financial instruments or products or indices. None of the MSCI information is intended to constitute investment advice or a recommendation to make (or refrain from making) any kind of investment decision and may not be relied on as such. Historical data and analysis should not be taken as an indication or guarantee of any future performance analysis, forecast or prediction. The MSCI information is provided on an “as is” basis and the user of this information assumes the entire risk of any use made of this information. MSCI, each of its affiliates and each other person involved in or related to compiling, computing or creating any MSCI information (collectively, the “MSCI Parties”) expressly disclaims all warranties (including, without limitation, any warranties of originality, accuracy, completeness, timeliness, non-infringement, merchantability and fitness for a particular purpose) with respect to this information. Without limiting any of the foregoing, in no event shall any MSCI Party have any liability for any direct, indirect, special, incidental, punitive, consequential (including, without limitation, lost profits) or any other damages. Please visit the data provider's website for more information.
FTSE/Russell indexes: London Stock Exchange Group plc and its group undertakings (collectively, the “LSE Group”). © LSE Group 2026. FTSE Russell is a trading name of certain of the LSE Group companies. FTSE indexes are trademarks of the relevant LSE Group companies and are used by any other LSE Group company under license. All rights in the FTSE Russell indexes or data vest in the relevant LSE Group company which owns the index or the data. Neither LSE Group nor its licensors accept any liability for any errors or omissions in the indexes or data and no party may rely on any indexes or data contained in this communication. No further distribution of data from the LSE Group is permitted without the relevant LSE Group company's express written consent. The LSE Group does not promote, sponsor or endorse the content of this communication.
Each S&P Index ("Index") shown is a product of S&P Dow Jones Indices LLC and/or its affiliates and has been licensed for use by Capital Group. Copyright © 2026 S&P Dow Jones Indices LLC, a division of S&P Global, and/or its affiliates. All rights reserved. Redistribution or reproduction in whole or in part is prohibited without written permission of S&P Dow Jones Indices LLC.
Statements attributed to an individual represent the opinions of that individual as of the date published and do not necessarily reflect the opinions of Capital Group or its affiliates. This information is intended to highlight issues and should not be considered advice, an endorsement or a recommendation.
All Capital Group trademarks mentioned are owned by The Capital Group Companies, Inc., an affiliated company or fund. All other company and product names mentioned are the property of their respective companies.
Use of this website is intended for U.S. residents only.
Capital Client Group, Inc.

Past results are not predictive of results in future periods.


Passive funds are not striving to outpace their benchmarks; rather, they seek to replicate the benchmark’s return pattern.


MSCI All Country World Index (ACWI): A free-float-adjusted market-capitalization-weighted index designed to measure equity market results in global developed and emerging markets. Results reflect dividends net of withholding taxes.

Russell 1000 Index: An index of approximately 1,000 of the largest companies in the U.S. equity market. The Russell 1000 is a subset of the Russell 3000 Index. It represents the top companies by market capitalization. The Russell 1000 typically comprises approximately 90% of the total market capitalization of all listed U.S. stocks.


Russell 1000 Growth Index: A market-capitalization-weighted index that represents the large-cap growth segment of the U.S. equity market and includes stocks from the Russell 1000 Index that have higher price-to-book ratios and higher expected growth values.


Russell 1000 Value Index: A composite of large- and mid-cap companies located in the U.S. that also exhibit a value probability. The Russell 1000 Value is published and maintained by FTSE Russell.


S&P 500 Index: A market-capitalization-weighted index based on the results of approximately 500 widely held common stocks.


This content, developed by Capital Group, home of American Funds, should not be used as a primary basis for investment decisions and is not intended to serve as impartial investment or fiduciary advice.