
May 7, 2026

It's delivered both growth and income
- Washington Mutual Investors Fund (WMIF) strives to accomplish its objective through fundamental research, careful selection and broad diversification, considering current and anticipated income, as well as the potential for long-term capital appreciation.
- The fund emphasizes dividend payers, with flexibility to own select nonpayers.
- This approach has translated into higher yields and stronger returns.
10-year range of 12-month dividend yields (%)
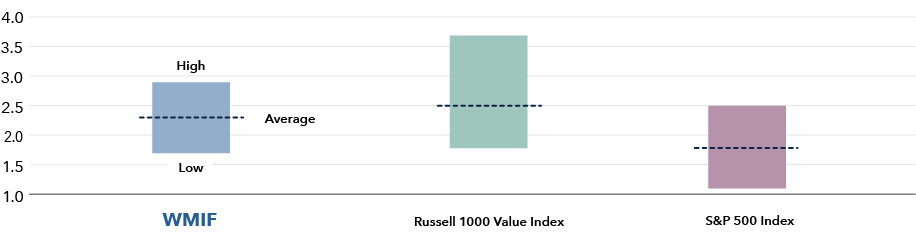
Source: Morningstar. Data from 12/31/15 of 12/31/25. Calculated by Capital Group. Due to differing calculation methods, the figures shown here may differ from those calculated by Morningstar.

Focused on high quality
- The fund stands apart from the S&P 500 and the Russell 1000 Value indexes through its focus on high-quality companies.
- The fund maintained 85% of its holdings in high-quality companies, well above the S&P 500 and Russell 1000 Value.
- In our view, quality dividend-paying companies can help consistently mitigate downside risk in a way traditional value stocks cannot.
10-year average investment grade by holdings and assets (%)
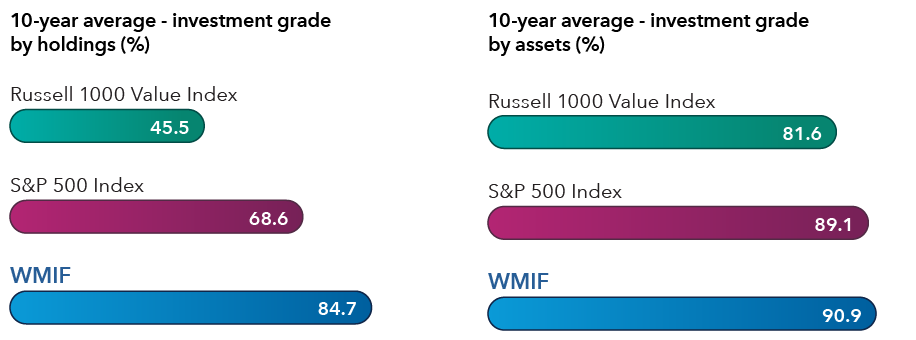
Source: FactSet, with credit ratings by S&P Global Ratings. As of 12/31/25. Data reflect the average percentage of fund holdings and index constituents rated investment grade (BBB- and above) by S&P Global Ratings. The average percentage by assets are in U.S. dollars for those holdings and constituents. Investments not rated or rated BB+ or lower are not reflected in the data.

A disciplined framework
- The fund has an eligible list of securities considered appropriate for a prudent investor seeking opportunities for income and growth of principal.
- This differentiated positioning is enabled by continuous research, a global presence and active management.
- Out of 2,245 companies listed on the New York Stock Exchange, only 745 met WMIF’s investment standards and approximately 1/4 of those stocks were held in the fund.
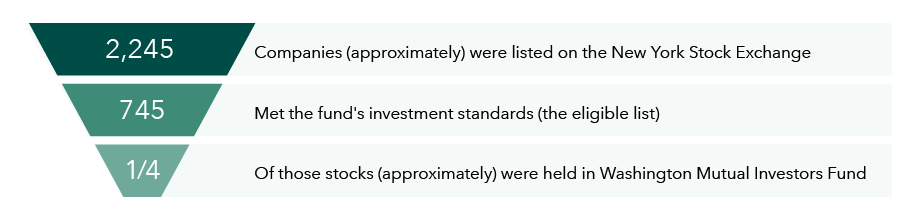
Source: FactSet, with credit ratings by S&P Global Ratings. As of 12/31/25.

A history of more upside, with less downside
- Beyond strong results in rising markets, WMIF demonstrated resilience when markets fell.
- With an emphasis on quality dividend-paying stocks, the fund has led the S&P 500 and Russell 1000 Value in the majority of the recent market corrections.
- A distinctive approach, active flexibility and an emphasis on quality dividend payers have helped when markets were at their worst.
WMIF excess returns during market downturns (%)
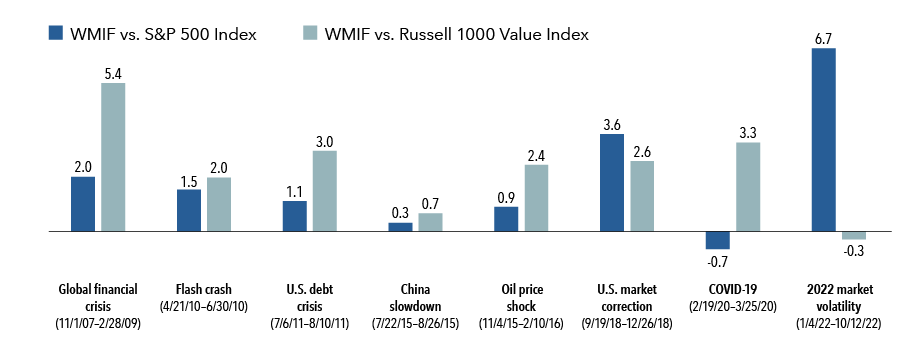
Source: Morningstar. As of 12/31/25. Market downturns are defined as cumulative declines of the S&P 500 Price Return Index of more than 10% from peak to trough with a 100% recovery. Past results are not predictive of results in future periods.

A differentiated approach
- Using a bottom‑up approach, WMIF has unique sector exposures compared to the S&P 500 and Russell 1000 Value indexes.
- The fund has been materially more weighted in technology versus the Russell 1000 Value — while remaining below the S&P 500’s concentration — and less weighted in consumer discretionary and communication services.
- This positioning seeks to deliver diversification from extreme market concentration while breaking from conventional value allocations.
Sector allocations (%)
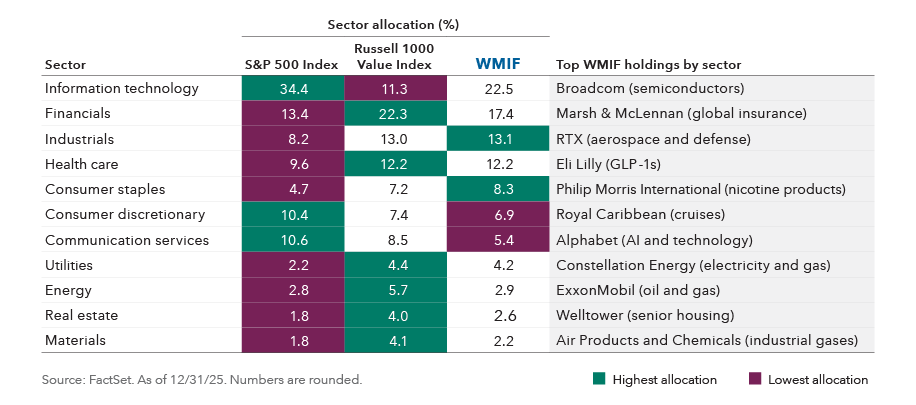
Source: Capital Group, FactSet. As of 12/31/25. Numbers are rounded.