
5 things to know about Capital Group International Focus Equity ETF

CGXU
 1

Investing with conviction
 

  • CGXU seeks to invest in attractively valued stocks of companies outside the U.S., including those in both developed and emerging markets.
  • Geographic flexibility enables the fund’s managers to navigate various markets in pursuit of what managers believe are attractive investment opportunities.
  • With a focus on aiming to add value through a company-by-company approach, the fund invests in a focused subset of the larger international market, emphasizing stock selection.

Total number of equity holdings
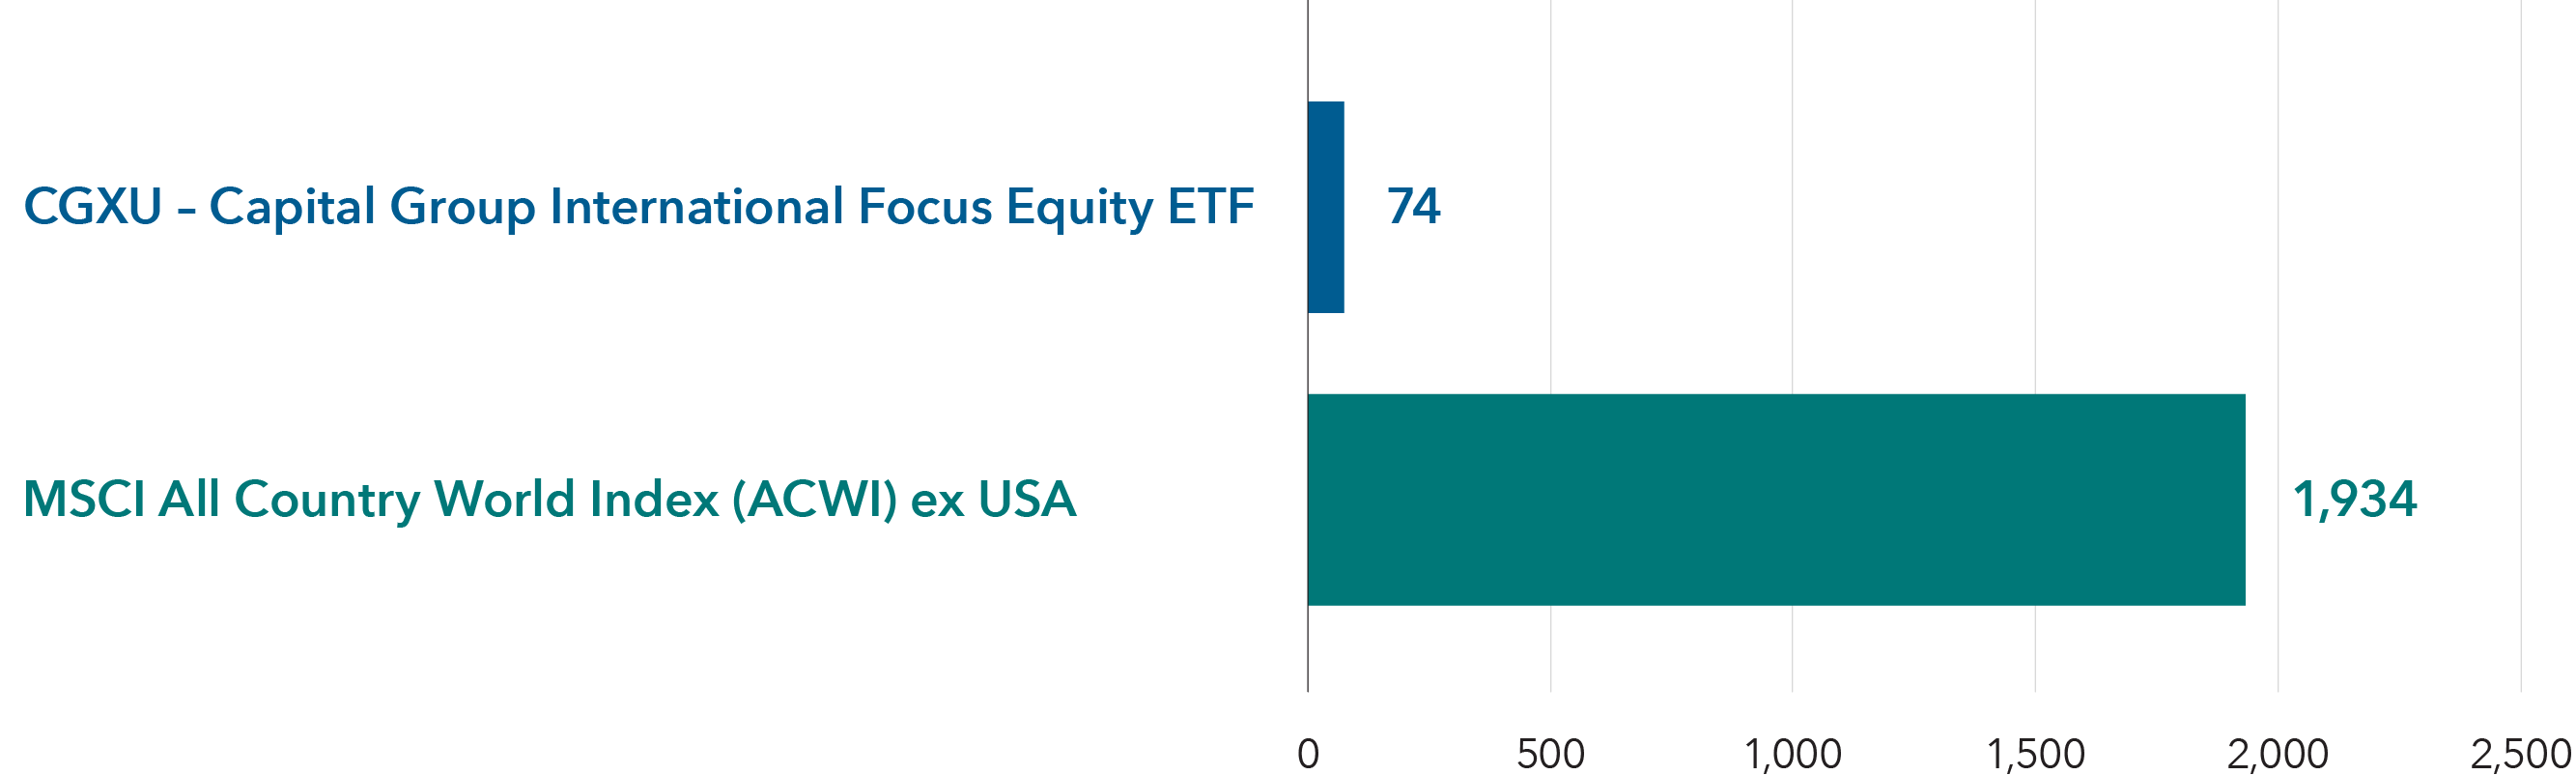
Horizontal bar chart compares the total number of equity holdings in CGXU - Capital Group International Focus Equity ETF and the MSCI All Country World Index (ACWI) ex USA. CGXU holds 74 stocks, compared with 1,934 stocks in the index. The horizontal axis ranges from 0 to 2,500 holdings.

Sources: Capital Group, MSCI. As of 6/30/26.

 2

Dynamic positioning
 

  • CGXU’s sector positioning reflects bottom‑up security selection rather than top‑down sector views or benchmark-driven weights.
  • As conviction in individual holdings changes, sector exposures naturally expand or contract based on where research identifies growth opportunities.
  • The result is dynamic sector positioning over time, rather than static alignment with index sector weights.

Sector exposures (%)
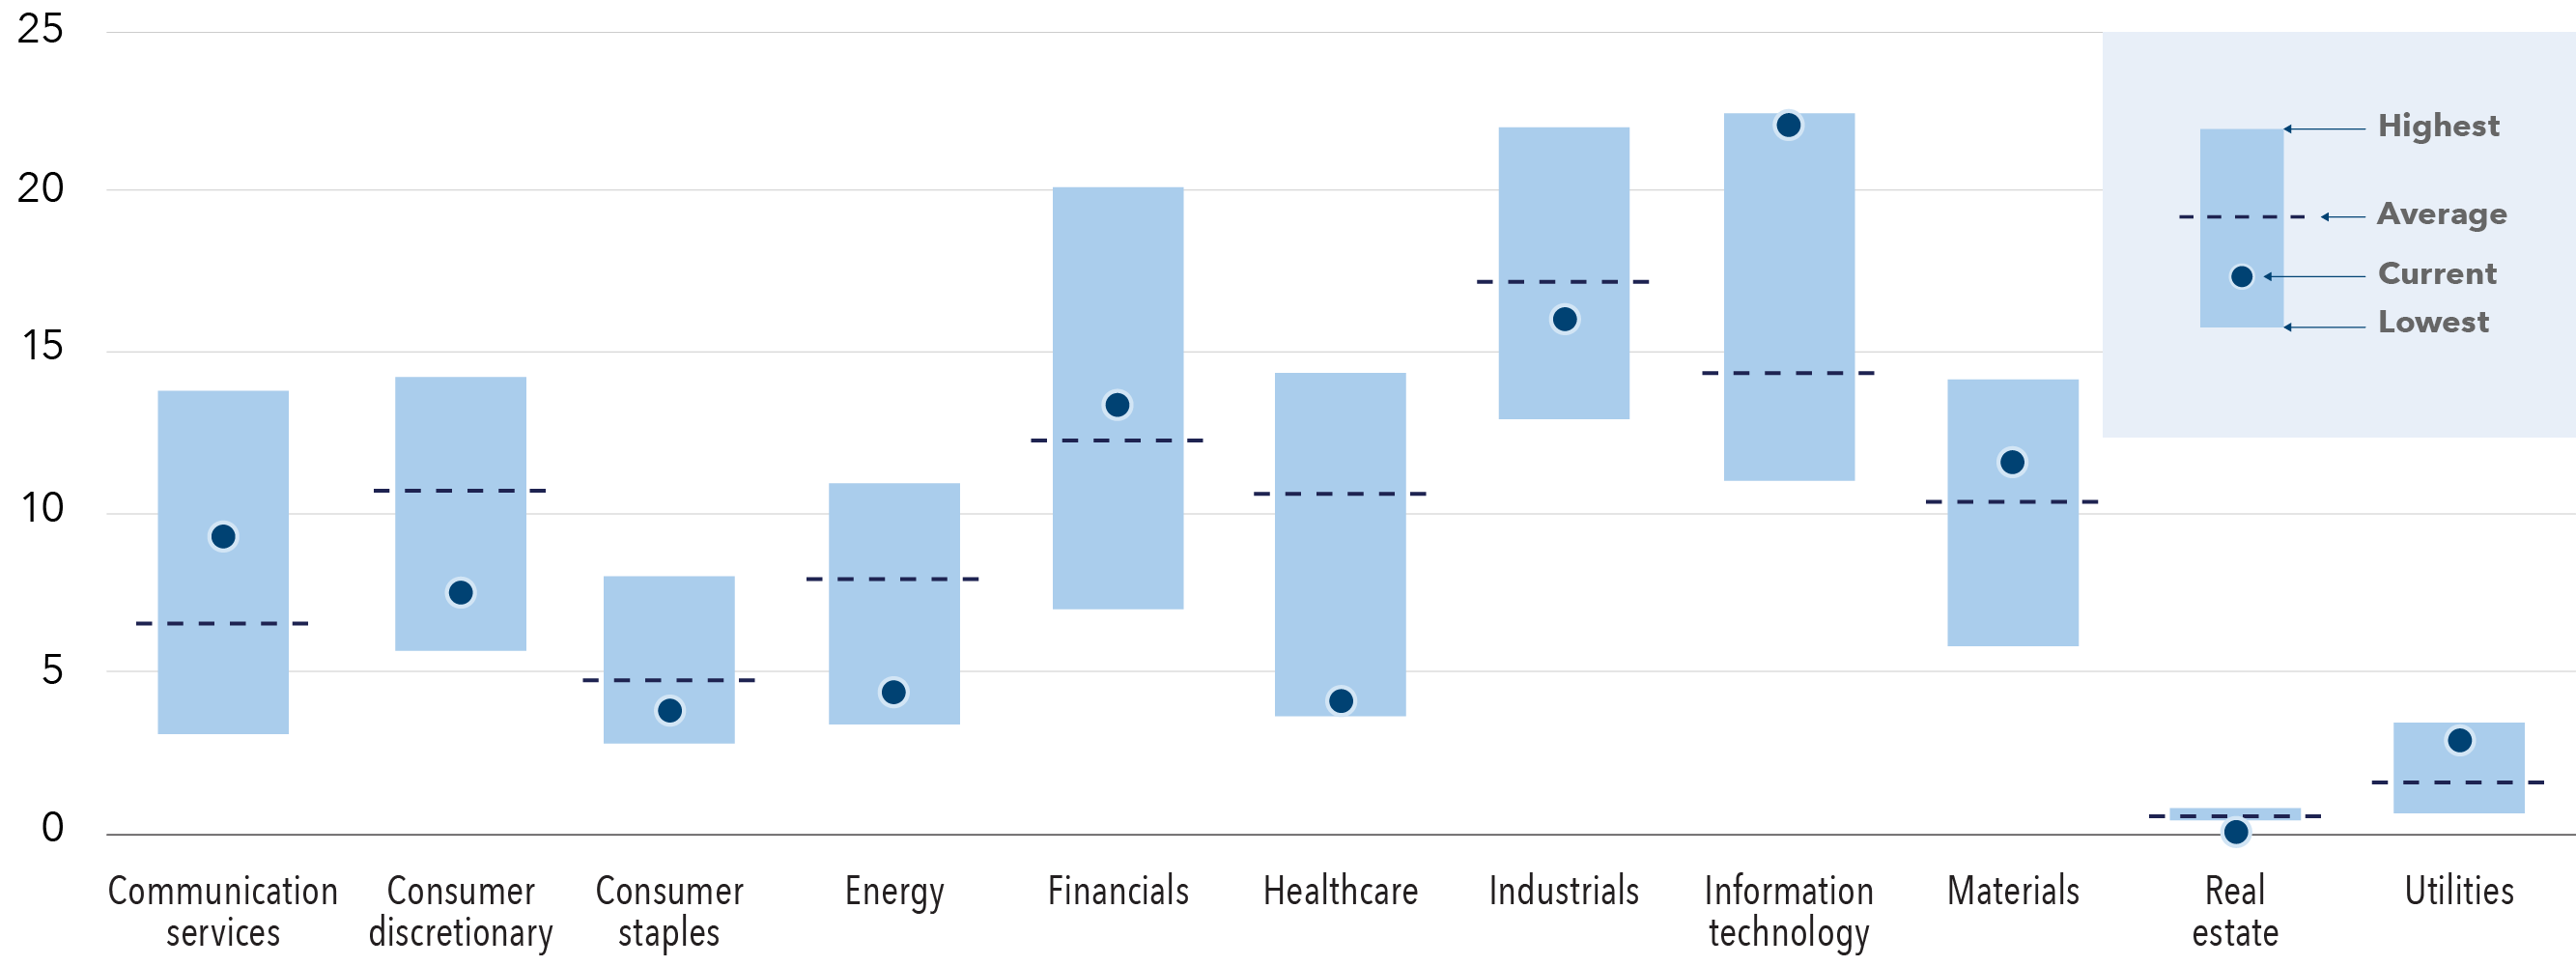
Bar chart shows sector exposures for CGXU  - Capital Group International Focus Equity ETF as percentage ranges across major sectors, including communication services, consumer discretionary, consumer staples, energy, financials, healthcare, industrials, information technology, materials, real estate and utilities. The vertical axis ranges from 0% to 25%. Information technology displays the highest current exposure at approximately 22%, with a range spanning roughly 11% to 22%, followed by industrials at approximately 16% and financials at approximately 13%. Materials and communication services show moderate current exposures near 11% and 9%, respectively. Consumer discretionary is approximately 7%, while energy, healthcare and consumer staples are each near 4%. Historical ranges are widest for information technology, industrials, financials and healthcare, reflecting greater variation over time. Communication services and consumer discretionary exhibit moderately wide ranges, while energy and consumer staples show narrower spreads. Real estate has the lowest current exposure at approximately 0% and a minimal range near zero, while utilities also exhibit a relatively small range and a current exposure of approximately 3%.

Source: Capital Group based on data from FactSet. Data from fund inception date of 2/22/22 to 6/30/26.

 3

Seeks consistent growth
 

  • CGXU’s portfolio managers seek to identify companies positioned to benefit from innovation, global economic growth, increasing consumer demand or a turnaround in business conditions.
  • Along with investing in opportunities linked to artificial intelligence (AI) and its related impacts, the fund seeks durable areas of investment that may be less exposed to disruption.
  • CGXU is weighted toward hard asset businesses, as expressed through higher allocations to capital goods, materials and utilities than its benchmark.

Total exposure to capital goods, materials and utilities (%)
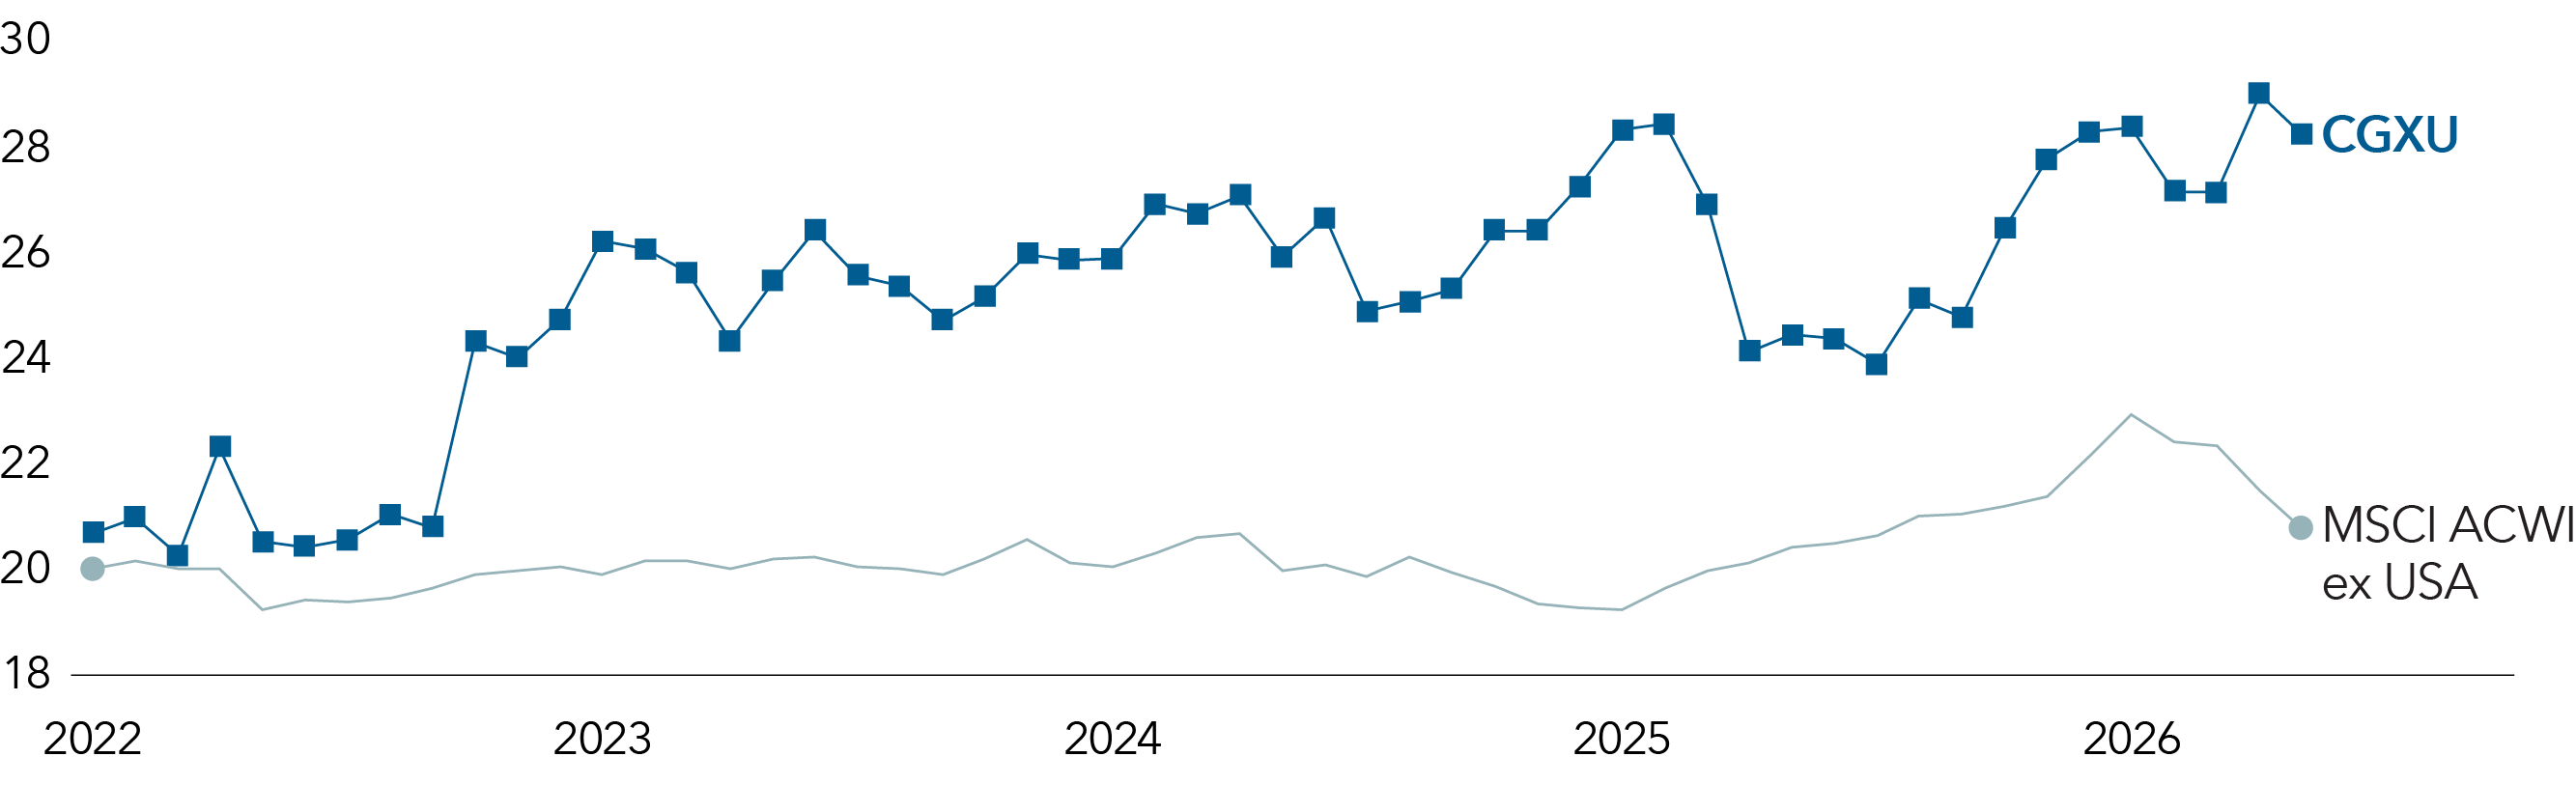
Line chart compares combined exposure to capital goods, materials and utilities for CGXU - Capital Group International Focus Equity ETF and the MSCI All Country World Index (ACWI) ex USA from 2022 through 2026. The vertical axis ranges from 18% to 30%. CGXU remains above the index throughout, rising from about 20% in 2022 to about 28% in 2026, with peaks near 29% in 2025 and 2026. The index stays near 20% through 2024, rises to roughly 23% in early 2026 and ends near 21%.

Sources: Capital Group, MSCI. As of 6/30/26.

 4

Access to global leaders beyond U.S. markets
 

  • CGXU's portfolio managers look beyond the U.S. for a broad range of opportunities, as global leaders have often been found in international markets.
  • While leadership has been concentrated within the U.S. in a historic way, new opportunities could be emerging in markets outside the U.S.
  • These opportunities include areas like AI, where the fund seeks to participate through the broader AI ecosystem, including semiconductor manufacturers, as well as utilities and electrification.

Market leadership by decade
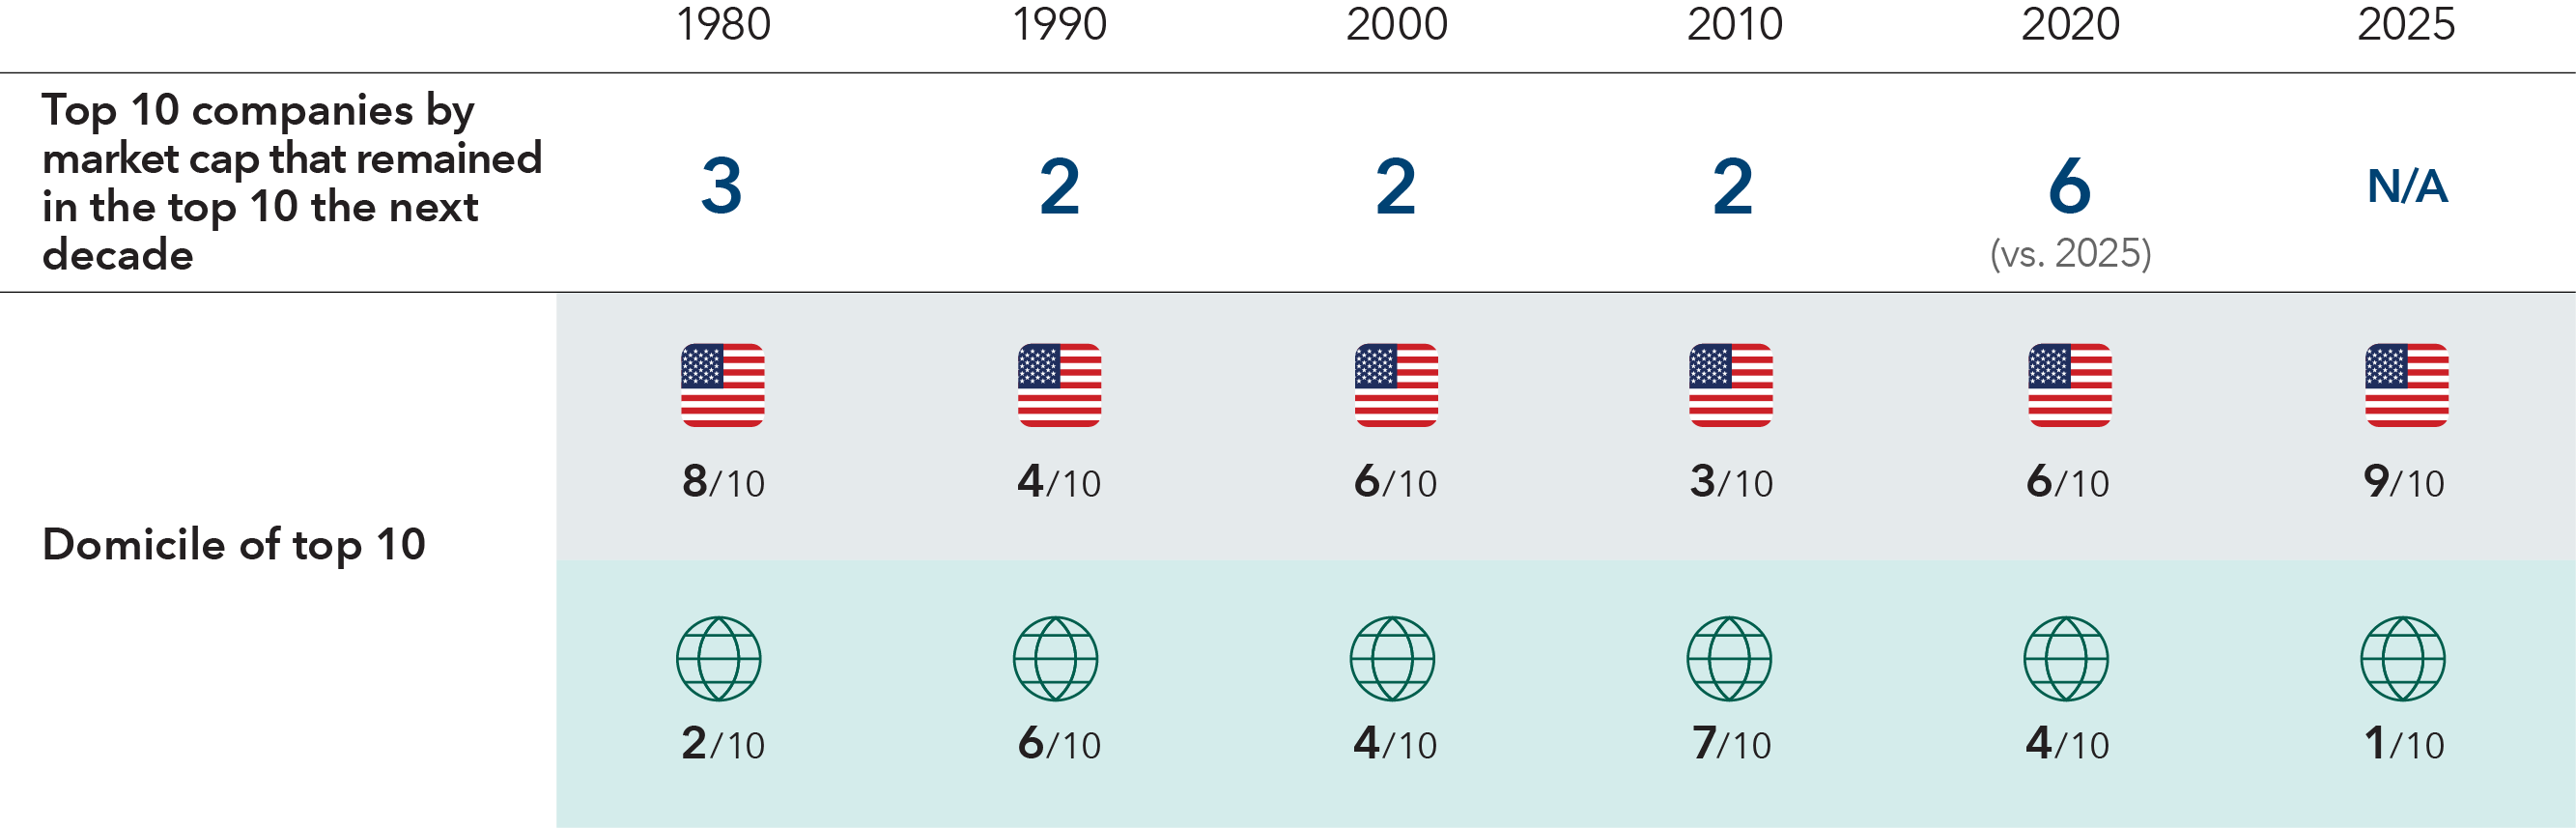
Table summarizes turnover and domicile among the world's 10 largest companies by market capitalization in 1980, 1990, 2000, 2010, 2020 and 2025. The number that remained in the top 10 in the next decade was 3 in 1980, 2 in 1990, 2 in 2000, 2 in 2010 and 6 in 2020; 2025 is not available. U.S.-domiciled companies accounted for 8 of 10 in 1980, 4 of 10 in 1990, 6 of 10 in 2000, 3 of 10 in 2010, 6 of 10 in 2020 and 9 of 10 in 2025. Non-U.S. companies accounted for the remaining 2, 6, 4, 7, 4 and 1, respectively.

Sources: Capital Group, MSCI, RIMES. As of 12/31/25.


Observation date for each set of top 10 companies in the MSCI World Index (1980-2010) and MSCI ACWI Index thereafter (2020 and current) is December 31 of the year. For example, for 1980, the observation date for the largest companies is 12/31/1980. The exception is for 2000, which uses the observation date of 2/28/2000, as it reflects the closest month-end peak of the tech bubble.

 5

A differentiated approach
 

  • Using a bottom‑up approach, CGXU’s sector exposures differ from the benchmark MSCI ACWI ex USA Index.
  • The fund is overweight industrials, materials and communication services, while underweight financials, consumer staples and healthcare.
  • This positioning is intended to help provide diversification away from extreme market concentration while maintaining global exposure.
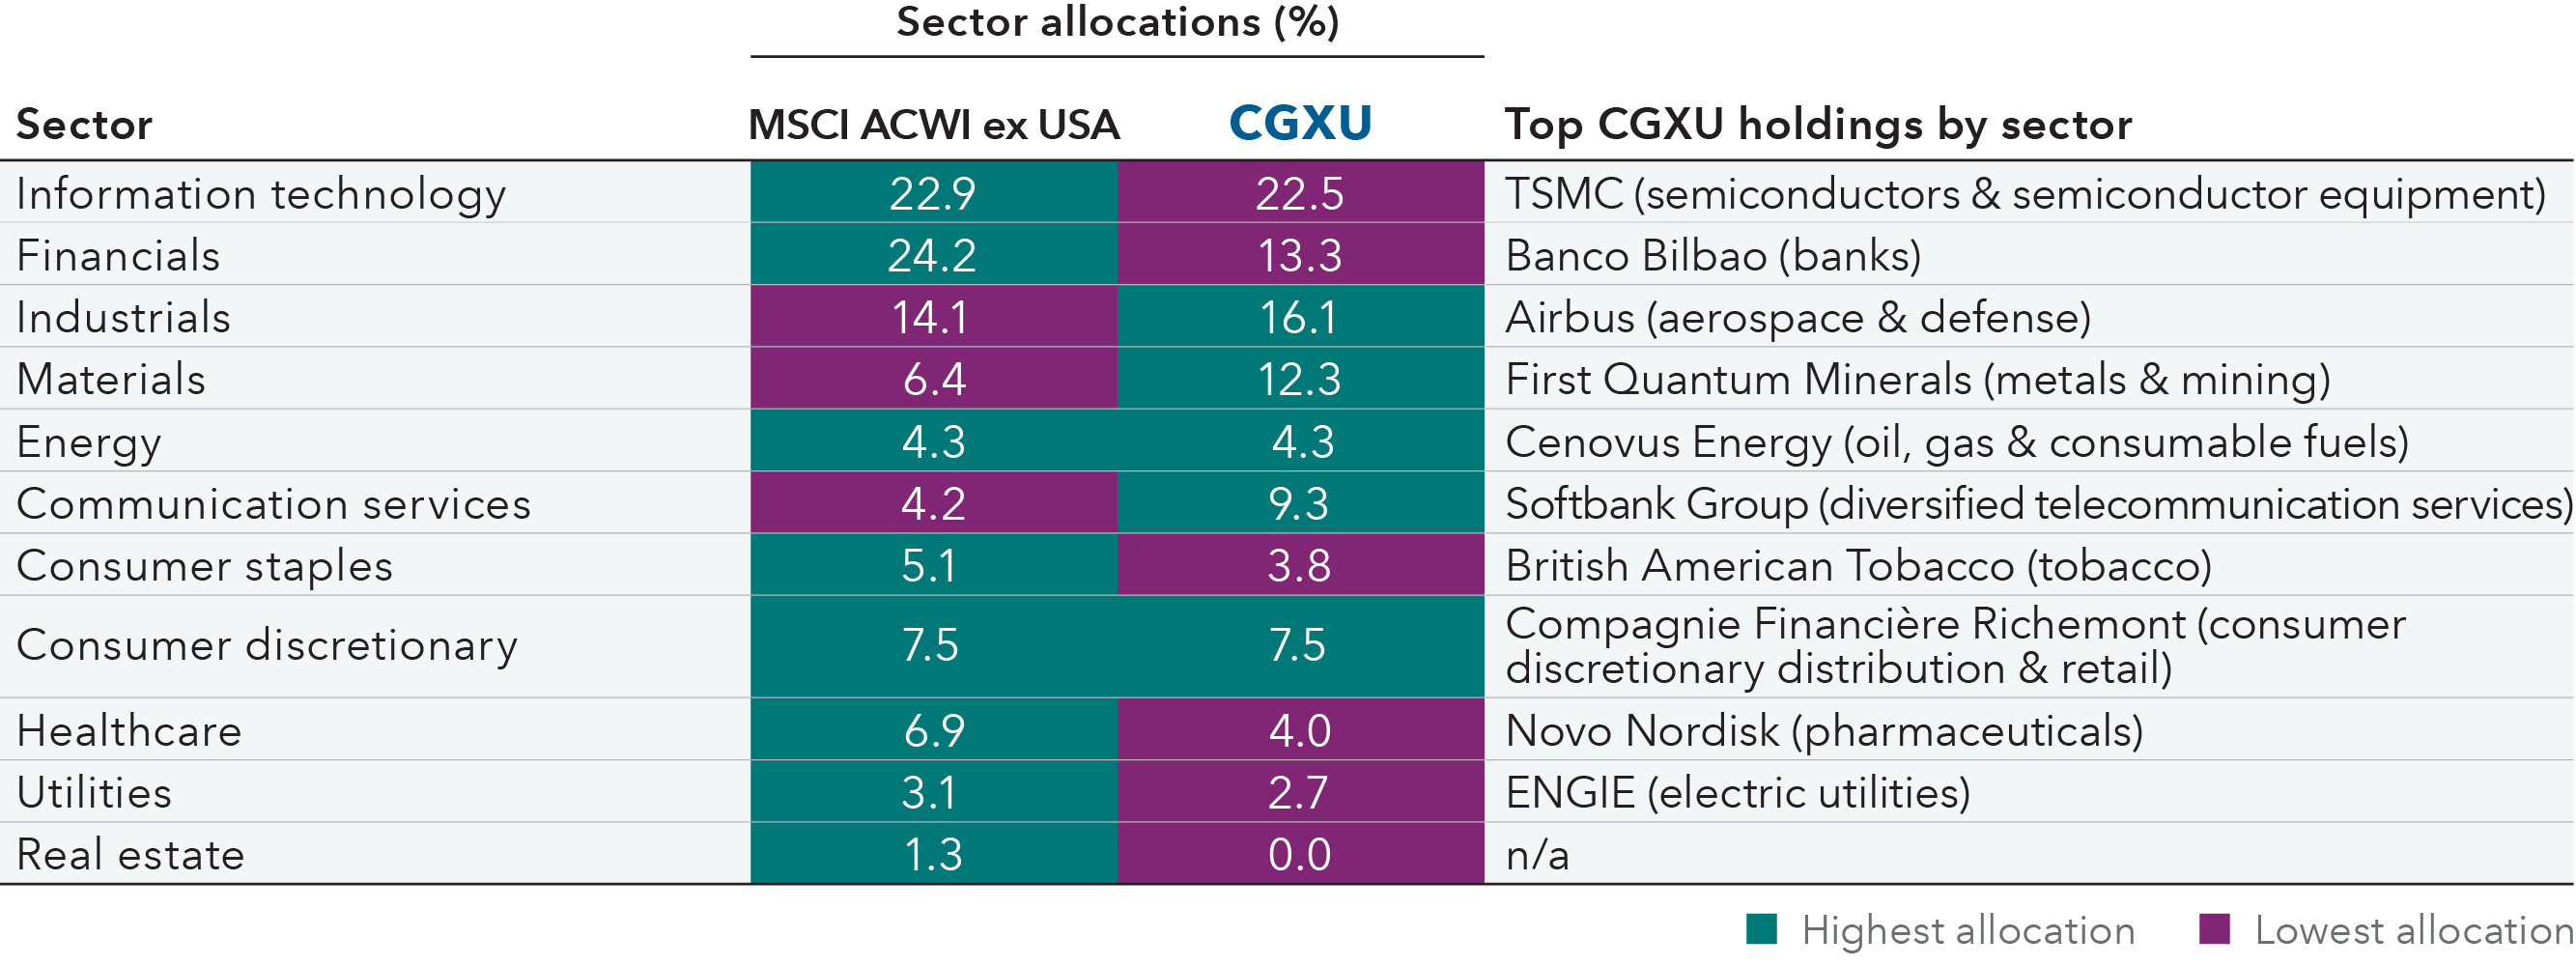
Table titled "Sector allocations (%)" compares sector weights for the MSCI ACWI ex USA Index and CGXU and lists the top CGXU holding for each sector. Information technology is 22.9% for the index and 22.5% for CGXU, with TSMC, in the semiconductors and semiconductor equipment industry, listed as the top holding. Financials are 24.2% for the index and 13.3% for CGXU, with Banco Bilbao, in the banks industry, listed as the top holding. Industrials are 14.1% for the index and 16.1% for CGXU, with Airbus, in the aerospace and defense industry, listed as the top holding. Materials are 6.4% for the index and 12.3% for CGXU, with First Quantum Minerals, in the metals and mining industry, listed as the top holding. Energy is 4.3% for the index and 4.3% for CGXU, with Cenovus Energy, in the oil, gas and consumable fuels industry, listed as the top holding. Communication services are 4.2% for the index and 9.3% for CGXU, with SoftBank Group, in the diversified telecommunication services industry, listed as the top holding. Consumer staples are 5.1% for the index and 3.8% for CGXU, with British American Tobacco, in the tobacco industry, listed as the top holding. Consumer discretionary is 7.5% for the index and 7.5% for CGXU, with Compagnie Financière Richemont, in the consumer discretionary distribution and retail industry, listed as the top holding. Healthcare is 6.9% for the index and 4.0% for CGXU, with Novo Nordisk, in the pharmaceuticals industry, listed as the top holding. Utilities are 3.1% for the index and 2.7% for CGXU, with ENGIE, in the electric utilities industry, listed as the top holding. Real estate is 1.3% for the index and 0.0% for CGXU; no top holding for CGXU is listed. Cells highlighted in teal indicate the higher allocation, while cells highlighted in purple indicate the lower allocation.

Sources: Capital Group, MSCI. As of 6/30/26. Numbers are rounded.

CGXU fund details

Read more perspectives on equity markets

Investments are not FDIC-insured, nor are they deposits of or guaranteed by a bank or any other entity, so they may lose value.
Investors should carefully consider investment objectives, risks, charges and expenses. This and other important information is contained in the ETF prospectuses and summary prospectuses, which can be obtained from a financial professional and should be read carefully before investing.
Capital Group exchange-traded funds (ETFs) are actively managed and do not seek to replicate a specific index. ETF shares are bought and sold through an exchange at the then current market price, not net asset value (NAV), and are not individually redeemed from the fund. Shares may trade at a premium or discount to their NAV when traded on an exchange. Brokerage commissions will reduce returns. There can be no guarantee that an active market for ETFs will develop or be maintained, or that the ETF's listing will continue or remain unchanged.
Investing outside the United States involves risks, such as currency fluctuations, periods of illiquidity and price volatility. These risks may be heightened in connection with investments in developing countries.
There have been periods when the results lagged the index(es) and/or average(s). The indexes are unmanaged and, therefore, have no expenses. Investors cannot invest directly in an index.
The MSCI information may only be used for your internal use, may not be reproduced or redisseminated in any form and may not be used as a basis for or a component of any financial instruments or products or indices. None of the MSCI information is intended to constitute investment advice or a recommendation to make (or refrain from making) any kind of investment decision and may not be relied on as such. Historical data and analysis should not be taken as an indication or guarantee of any future performance analysis, forecast or prediction. The MSCI information is provided on an “as is” basis and the user of this information assumes the entire risk of any use made of this information. MSCI, each of its affiliates and each other person involved in or related to compiling, computing or creating any MSCI information (collectively, the “MSCI Parties”) expressly disclaims all warranties (including, without limitation, any warranties of originality, accuracy, completeness, timeliness, non-infringement, merchantability and fitness for a particular purpose) with respect to this information. Without limiting any of the foregoing, in no event shall any MSCI Party have any liability for any direct, indirect, special, incidental, punitive, consequential (including, without limitation, lost profits) or any other damages. Please visit the data provider's website for more information.
All Capital Group trademarks mentioned are owned by The Capital Group Companies, Inc., an affiliated company or fund. All other company and product names mentioned are the property of their respective companies.
Use of this website is intended for U.S. residents only. Use of our website and materials is subject to approval by your home office.
Capital Client Group, Inc.
This content, developed by Capital Group, home of American Funds, should not be used as a primary basis for investment decisions and is not intended to serve as impartial investment or fiduciary advice.

MSCI All Country World Index ex USA is a free-float-adjusted market-capitalization-weighted index that is designed to measure equity market results in the global developed and emerging markets, excluding the United States. The index consists of more than 40 developed- and emerging-market country indexes.


FactSet is a registered trademark of FactSet Research Systems Inc. All FactSet data contained herein is provided "as is" and is for informational purposes only. FactSet makes no warranties as to the accuracy, completeness or timeliness of the data and shall not have any liability for any errors or omissions.


RIMES: RIMES data contained herein is the property of RIMES Technologies Corporation and/or its data providers, is provided “as is” and is for informational purposes only. RIMES makes no warranties as to the accuracy, completeness or timeliness of the data and shall not have any liability for any errors or omissions. The data may not be further redistributed or used as a basis for other indexes or any securities or financial products.


When applicable, results reflect fee waivers and/or expense reimbursements, without which they would have been lower. Please see capitalgroup.com for more information.