
5 things to know about Capital Group New Geography Equity ETF

CGNG
 1

A global approach to developing markets
 

  • CGNG invests globally, evaluating companies not only by domicile but also by where they generate a significant portion of their revenue.
  • This approach aims to provide more consistent emerging markets (EM) exposure through a combination of active security selection and thoughtful allocation.
  • Within this global mandate, the strategy is required to invest at least 30% of assets in securities of issuers based in qualified emerging markets.

Share of equity investments (%)
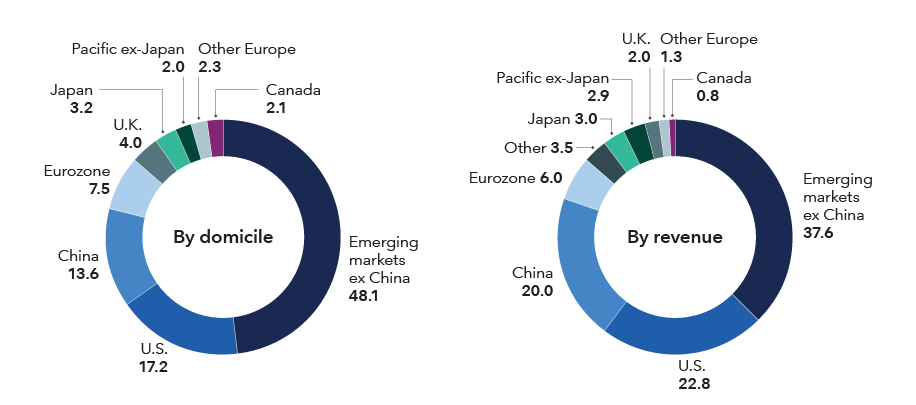
Two donut charts compare regional exposure by domicile and by revenue for Capital Group New Geography Equity ETF. The left chart shows the ETF’s investments by company domicile with the largest allocation of 48.1% to emerging markets ex China, followed by the U.S. at 17.2%, China at 13.6% and the eurozone at 7.5%. Smaller exposures include the U.K. at 4%, Japan at 3.2%, other Europe at 2.3%, Canada at 2.1% and Pacific ex-Japan at 2%. The right chart illustrates where companies generate the majority of their revenue. Emerging markets ex China again account for the largest share at 37.6%, followed by the U.S. at 22.8% and China at 20%. Smaller allocations include the eurozone at 6%, Japan at 3%, Pacific ex-Japan at 2.9%, the U.K. at 2%, other Europe at 1.3% and Canada at 0.8%. The category of Other, which consists of holdings that are not common stock, is at 3.5%.

Source: Capital Group. As of 3/31/26. Other represents holdings that are not common stock.

 2

Dynamic positioning
 

  • CGNG’s sector positioning reflects bottom‑up security selection rather than top‑down sector views or benchmark-driven weights.
  • As conviction in individual holdings changes, sector exposures naturally expand or contract based on where research identifies growth opportunities.
  • The result is dynamic sector positioning over time, rather than static alignment with index sector weights.

Sector exposures (%)
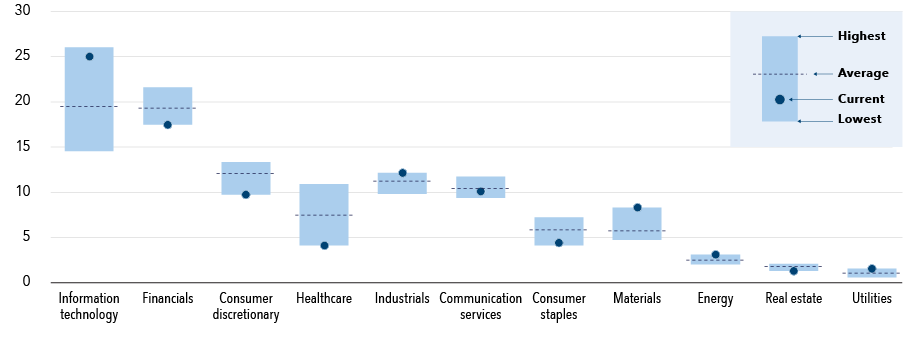
Bar chart for Capital Group New Geography Equity ETF shows the sector exposures as percentage ranges across all sectors, including information technology, financials, consumer discretionary, healthcare, industrials, communication services, consumer staples, materials, energy, real estate and utilities. The vertical axis ranges from roughly 0 to 30%. For each sector, a shaded vertical bar indicates the highest and lowest values, a dashed line marks the average, and a dot shows the current value. Information technology shows the highest overall range and current value, followed by financials. Industrials, communication services and consumer discretionary cluster in the mid-range, while healthcare shows a wider spread with a lower current value. Consumer staples and materials have lower ranges and current values. Energy, real estate and utilities display the smallest ranges and lowest overall values.

Sources: Capital Group based on data from FactSet. Data from fund inception date of 6/25/24 to 3/31/26.

 3

EM exposure with lower volatility
 

  • The fund seeks to capture EM growth by investing in companies based in developing countries and multinationals with significant exposure to those markets.
  • While investing in emerging markets, CGNG aims to moderate the volatility that is often associated with these less-developed economies.
  • This approach has contributed to a favorable upside and downside capture profile and markedly lower standard deviation than the index.

CGNG volatility metrics since inception
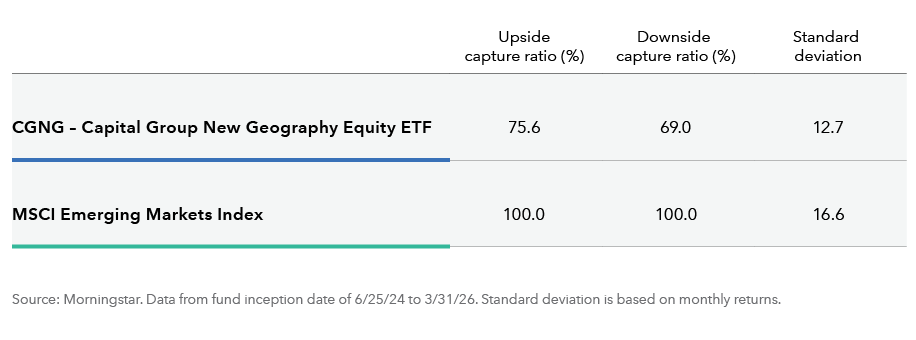
Table compares the risk metrics for CGNG – Capital Group New Geography Equity ETF versus the MSCI Emerging Markets Index. CGNG shows an upside capture ratio of 75.6, a downside capture ratio of 69.0, and a standard deviation of 12.7. The MSCI Emerging Markets Index shows an upside capture ratio of 100, a downside capture ratio of 100, and a standard deviation of 16.6.

Source: Morningstar. Data from fund inception date of 6/25/24 to 3/31/26. Standard deviation is based on monthly returns.

 4

Thoughtful EM exposure
 

  • The fund’s EM exposure is flexible and dynamic, with its share of total holdings shifting based on managers’ discretion and interest in equities across different domiciles.
  • By taking an active approach to EM investing, CGNG investors gain a more deliberate allocation rather than passive index exposure.
  • CGNG has struck a balance between the maximum EM exposure of the MSCI Emerging Markets Index and the lower exposure of the MSCI All Country World (ACWI) Index.

Emerging markets exposure (%)
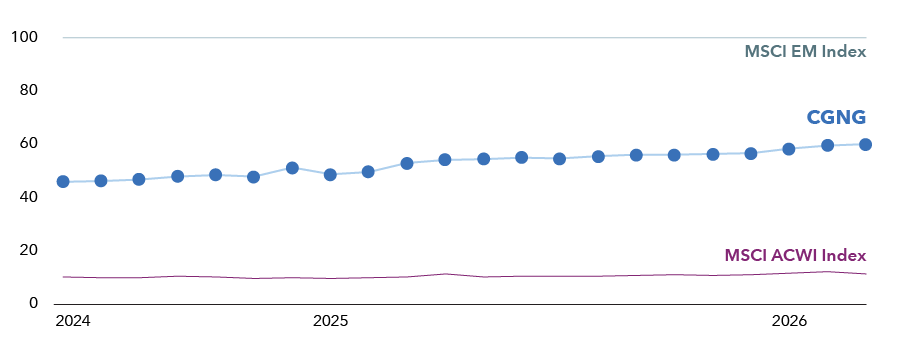
Line chart demonstrates CGNG – Capital Group New Geography Equity ETF’s emerging markets exposure trending upward from 2024 through 2026, compared with two indexes. CGNG’s exposure starts at approximately 45% in early 2024 and gradually rises to roughly 60% by 2026. An annotation highlights this upward trend as a “dynamic increase in CGNG’s emerging markets exposure.” For comparison, the MSCI Emerging Markets Index remains at a 100 percent emerging markets exposure, while the MSCI All Country World Index excluding USA fluctuates modestly around 30%.

Source: Capital Group. Data from fund inception date of 6/25/24 to 3/31/26.

 5

A differentiated approach
 

  • Using a bottom‑up approach, CGNG’s sector exposures differ from the benchmark MSCI EM Index.
  • The fund is overweight industrials, communication services and materials, while underweight information technology, financials and consumer discretionary.
  • This approach is designed to provide diversification away from extreme market concentration while maintaining global exposure.
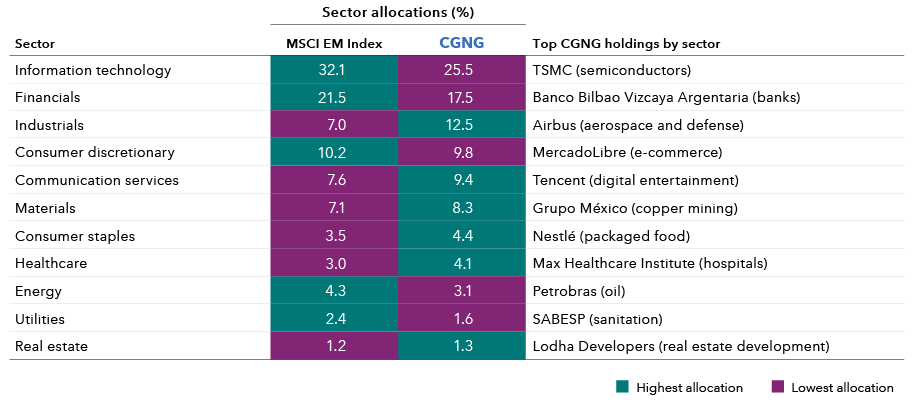
Table shows sector allocation comparisons for CGNG – Capital Group New Geography Equity ETF versus the MSCI Emerging Markets Index, along with representative top CGNG holdings by sector. Information technology represents 32.1 percent of the MSCI Emerging Markets Index and 25.5 percent of CGNG, with Taiwan Semiconductor Manufacturing Company (semiconductors) listed as a top holding. Financials account for 21.5 percent in the index and 17.5 percent in CGNG, with Banco Bilbao Vizcaya Argentaria (banks) as a top holding. Industrials is 7.0 percent in the index and 12.5 percent in CGNG, with Airbus (aerospace and defense) listed as a top holding. Consumer discretionary represents 10.2 percent in the index and 9.8 percent in CGNG, with MercadoLibre (e-commerce) noted as a top holding. Communication services is 7.6 percent in the index and 9.4 percent in CGNG, with Tencent (digital entertainment) listed as a top holding. Materials accounts for 7.1 percent in the index and 8.3 percent in CGNG, with Grupo México (copper mining) as a top holding. Consumer staples represents 3.5 percent in the index and 4.4 percent in CGNG, with Nestlé (packaged food) listed as a top holding. Health care is 3.0 percent in the index and 4.1 percent in CGNG, with Max Healthcare Institute (hospitals) included as a top holding. Energy represents 4.3 percent in the index and 3.1 percent in CGNG, with Petrobras (oil) listed as a top holding. Utilities is 2.4 percent in the index and 1.6 percent in CGNG, with SABESP (sanitation) noted as a top holding. Real estate accounts for 1.2 percent in the index and 1.3 percent in CGNG, with Lodha Developers (real estate development) listed as a top holding.

Source: Capital Group. As of 3/31/26. Numbers are rounded.

CGNG fund details

Read more perspectives on equity markets

Investments are not FDIC-insured, nor are they deposits of or guaranteed by a bank or any other entity, so they may lose value.
Investors should carefully consider investment objectives, risks, charges and expenses. This and other important information is contained in the ETF prospectuses and summary prospectuses, which can be obtained from a financial professional and should be read carefully before investing.
Capital Group exchange-traded funds (ETFs) are actively managed and do not seek to replicate a specific index. ETF shares are bought and sold through an exchange at the then current market price, not net asset value (NAV), and are not individually redeemed from the fund. Shares may trade at a premium or discount to their NAV when traded on an exchange. Brokerage commissions will reduce returns. There can be no guarantee that an active market for ETFs will develop or be maintained, or that the ETF's listing will continue or remain unchanged.
Investing outside the United States involves risks, such as currency fluctuations, periods of illiquidity and price volatility. These risks may be heightened in connection with investments in developing countries.
Nondiversified funds have the ability to invest a larger percentage of assets in the securities of a smaller number of issuers than a diversified fund. As a result, poor results by a single issuer could adversely affect fund results more than if the fund invested in a larger number of issuers. See the applicable prospectus for details.
There have been periods when the results lagged the index(es) and/or average(s). The indexes are unmanaged and, therefore, have no expenses. Investors cannot invest directly in an index.
The MSCI information may only be used for your internal use, may not be reproduced or redisseminated in any form and may not be used as a basis for or a component of any financial instruments or products or indices. None of the MSCI information is intended to constitute investment advice or a recommendation to make (or refrain from making) any kind of investment decision and may not be relied on as such. Historical data and analysis should not be taken as an indication or guarantee of any future performance analysis, forecast or prediction. The MSCI information is provided on an “as is” basis and the user of this information assumes the entire risk of any use made of this information. MSCI, each of its affiliates and each other person involved in or related to compiling, computing or creating any MSCI information (collectively, the “MSCI Parties”) expressly disclaims all warranties (including, without limitation, any warranties of originality, accuracy, completeness, timeliness, non-infringement, merchantability and fitness for a particular purpose) with respect to this information. Without limiting any of the foregoing, in no event shall any MSCI Party have any liability for any direct, indirect, special, incidental, punitive, consequential (including, without limitation, lost profits) or any other damages. Please visit the data provider's website for more information.
All Capital Group trademarks mentioned are owned by The Capital Group Companies, Inc., an affiliated company or fund. All other company and product names mentioned are the property of their respective companies.
Use of this website is intended for U.S. residents only. Use of our website and materials is subject to approval by your home office.
Capital Client Group, Inc.
This content, developed by Capital Group, home of American Funds, should not be used as a primary basis for investment decisions and is not intended to serve as impartial investment or fiduciary advice.
© 2026 Morningstar, Inc. All rights reserved. The information contained herein: (1) is proprietary to Morningstar and/or its content providers; (2) may not be copied or distributed; and (3) is not warranted to be accurate, complete or timely. Neither Morningstar, its content providers nor Capital Group are responsible for any damages or losses arising from any use of this information. Past performance is no guarantee of future results. Information is calculated by Morningstar. When applicable, due to differing calculation methods, the figures shown here may differ from those calculated by Capital Group.

Capture ratio: Up (down) capture ratio is the ratio of a portfolio's return during periods when the index was up (down), divided by the return of the index during those periods. For example, an up-capture ratio greater than 100 indicates the portfolio produced a higher return than the index during periods when the index was up. Conversely, during periods when the index was down, a down-capture ratio greater than 100 indicates the portfolio produced a lower return than the index.


Standard deviation measures how much an investment's returns fluctuate from its average, serving as the a benchmark for historical volatility and total risk.


MSCI Emerging Markets Index is a free float-adjusted market capitalization weighted index that is designed to measure equity market results in the global emerging markets, consisting of more than 20 emerging market country indexes.


MSCI All Country World Index is a free-float-adjusted market-capitalization-weighted index that is designed to measure equity market results in the global developed and emerging markets, consisting of more than 40 developed- and emerging-market country indexes.


New Geography/New World Historical Benchmarks Index returns reflect the results of the MSCI All Country World Index (ACWI) through December 31, 2025, and the MSCI Emerging Markets Index, the primary benchmark, thereafter.


FactSet is a registered trademark of FactSet Research Systems Inc. All FactSet data contained herein is provided "as is" and is for informational purposes only. FactSet makes no warranties as to the accuracy, completeness or timeliness of the data and shall not have any liability for any errors or omissions.


Passive funds are not striving to outpace their benchmarks; rather, they seek to replicate the benchmark’s return pattern.