On Good Friday, the New York Stock Exchange and Capital Group’s U.S. offices will be closed.

In observance of Good Friday, the New York Stock Exchange and Capital Group’s U.S. offices will be closed on Friday, April 3.

5 things to know about CGGR – Capital Group Growth ETF

KEY TAKEAWAYS

  • Pure growth strategies can increase valuation and concentration risk.
  • A flexible, research‑driven approach can adapt to changing markets.
  • CGGR seeks to deliver this flexibility through deep fundamental research and multiple independent portfolio managers working across a broad opportunity set, subject to fund guidelines, without the constraints of rigid style definitions.

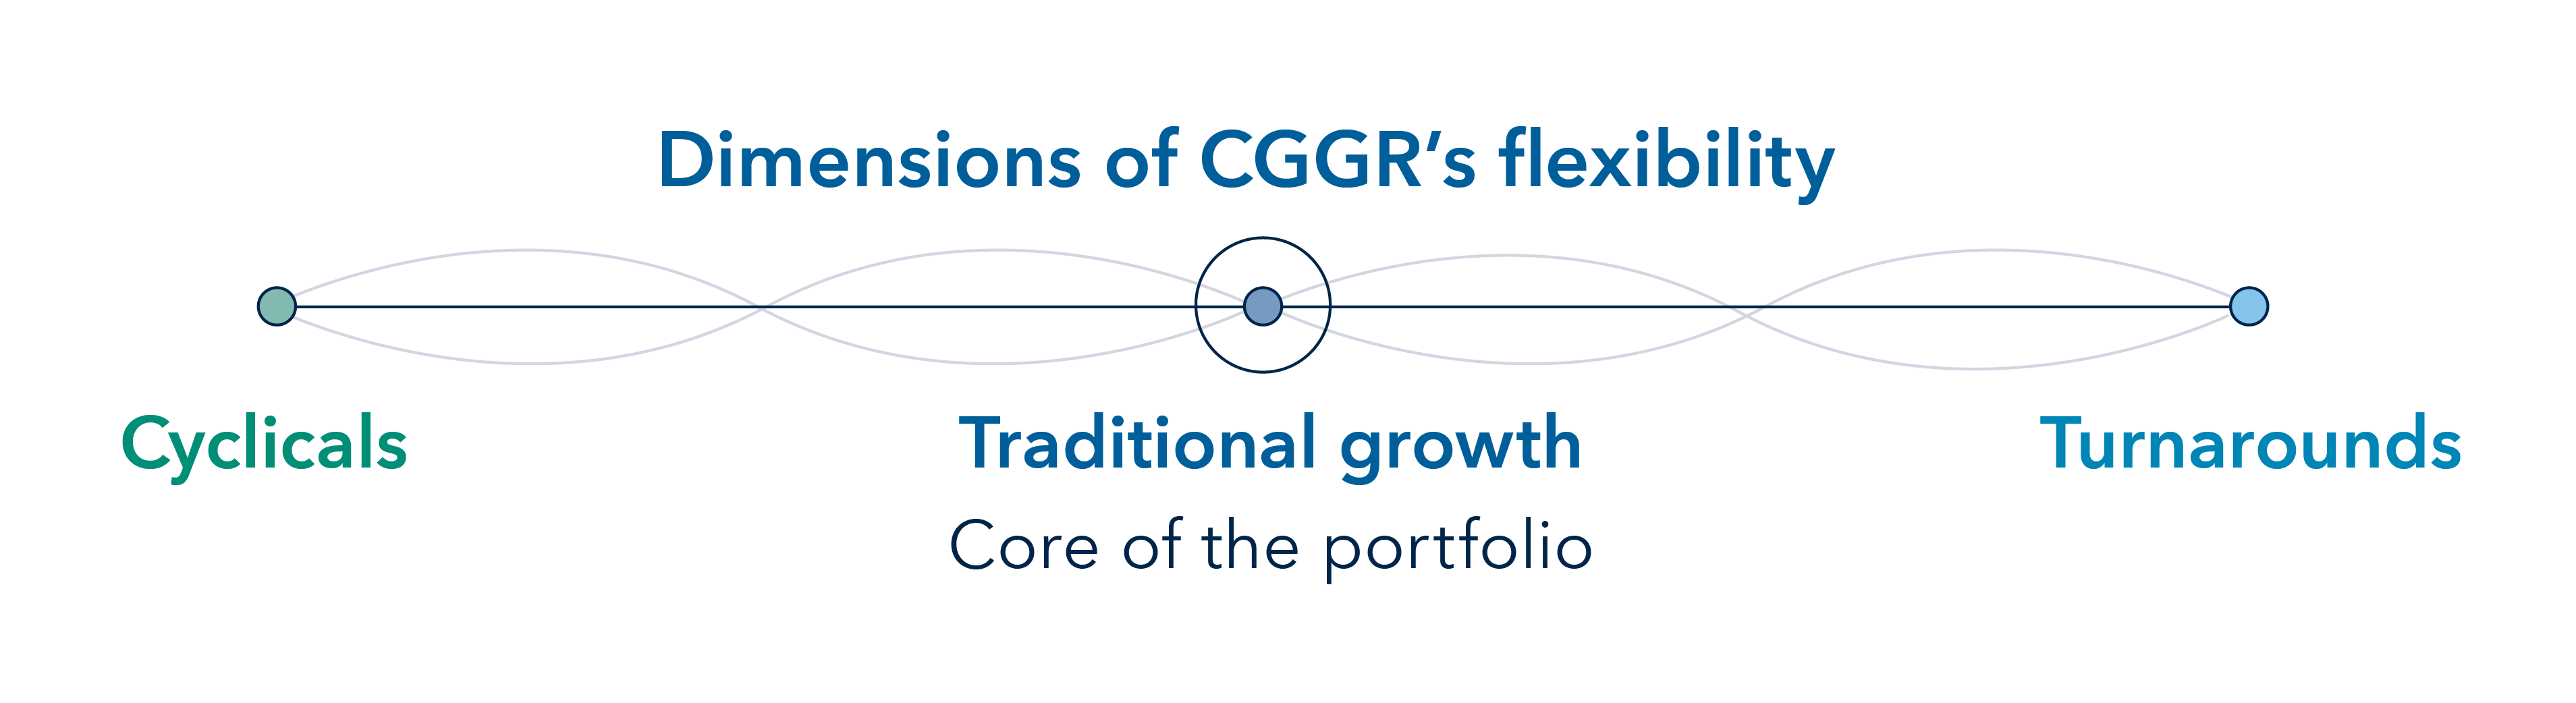
1.  Flexible approach to growth

  • CGGR is principally focused on U.S.-based companies but can also invest selectively in global leaders with a meaningful U.S. presence.
  • This approach has produced a differentiated growth fund that has delivered strong returns without the concentration risk and rigidity of passive approaches.
  • The fund’s flexible approach allows managers to invest across different types of growth opportunities including cyclicals and turnarounds.

2.  Dynamic positioning

  • CGGR’s sector positioning is an outcome of bottom-up security selection, not top-down sector calls or benchmark weights.
  • As individual holdings gain or lose conviction, sector exposures naturally expand or contract, reflecting where research is uncovering growth opportunities.
  • This results in dynamic sector positioning over time, rather than static alignment with index sector weights.

Range of relative sector exposure vs. S&P 500 Index (%)

Chart shows the range of relative sector exposure of CGGR – Capital Group Growth ETF versus the S&P 500 Index in all sectors including consumer discretionary, consumer staples, energy, financials, health care, industrials, information technology, materials, real estate, communication services and utilities. The vertical axis shows relative exposure ranging from roughly negative 10 to positive 15. For each sector, a shaded vertical bar indicates the highest and lowest relative exposure, a dashed line marks the average, and a dot shows the current exposure. Consumer discretionary and communication services show the largest positive relative exposure ranges, while information technology shows the largest negative average exposure. Other sectors display smaller positive or negative deviations around the S&P 500.

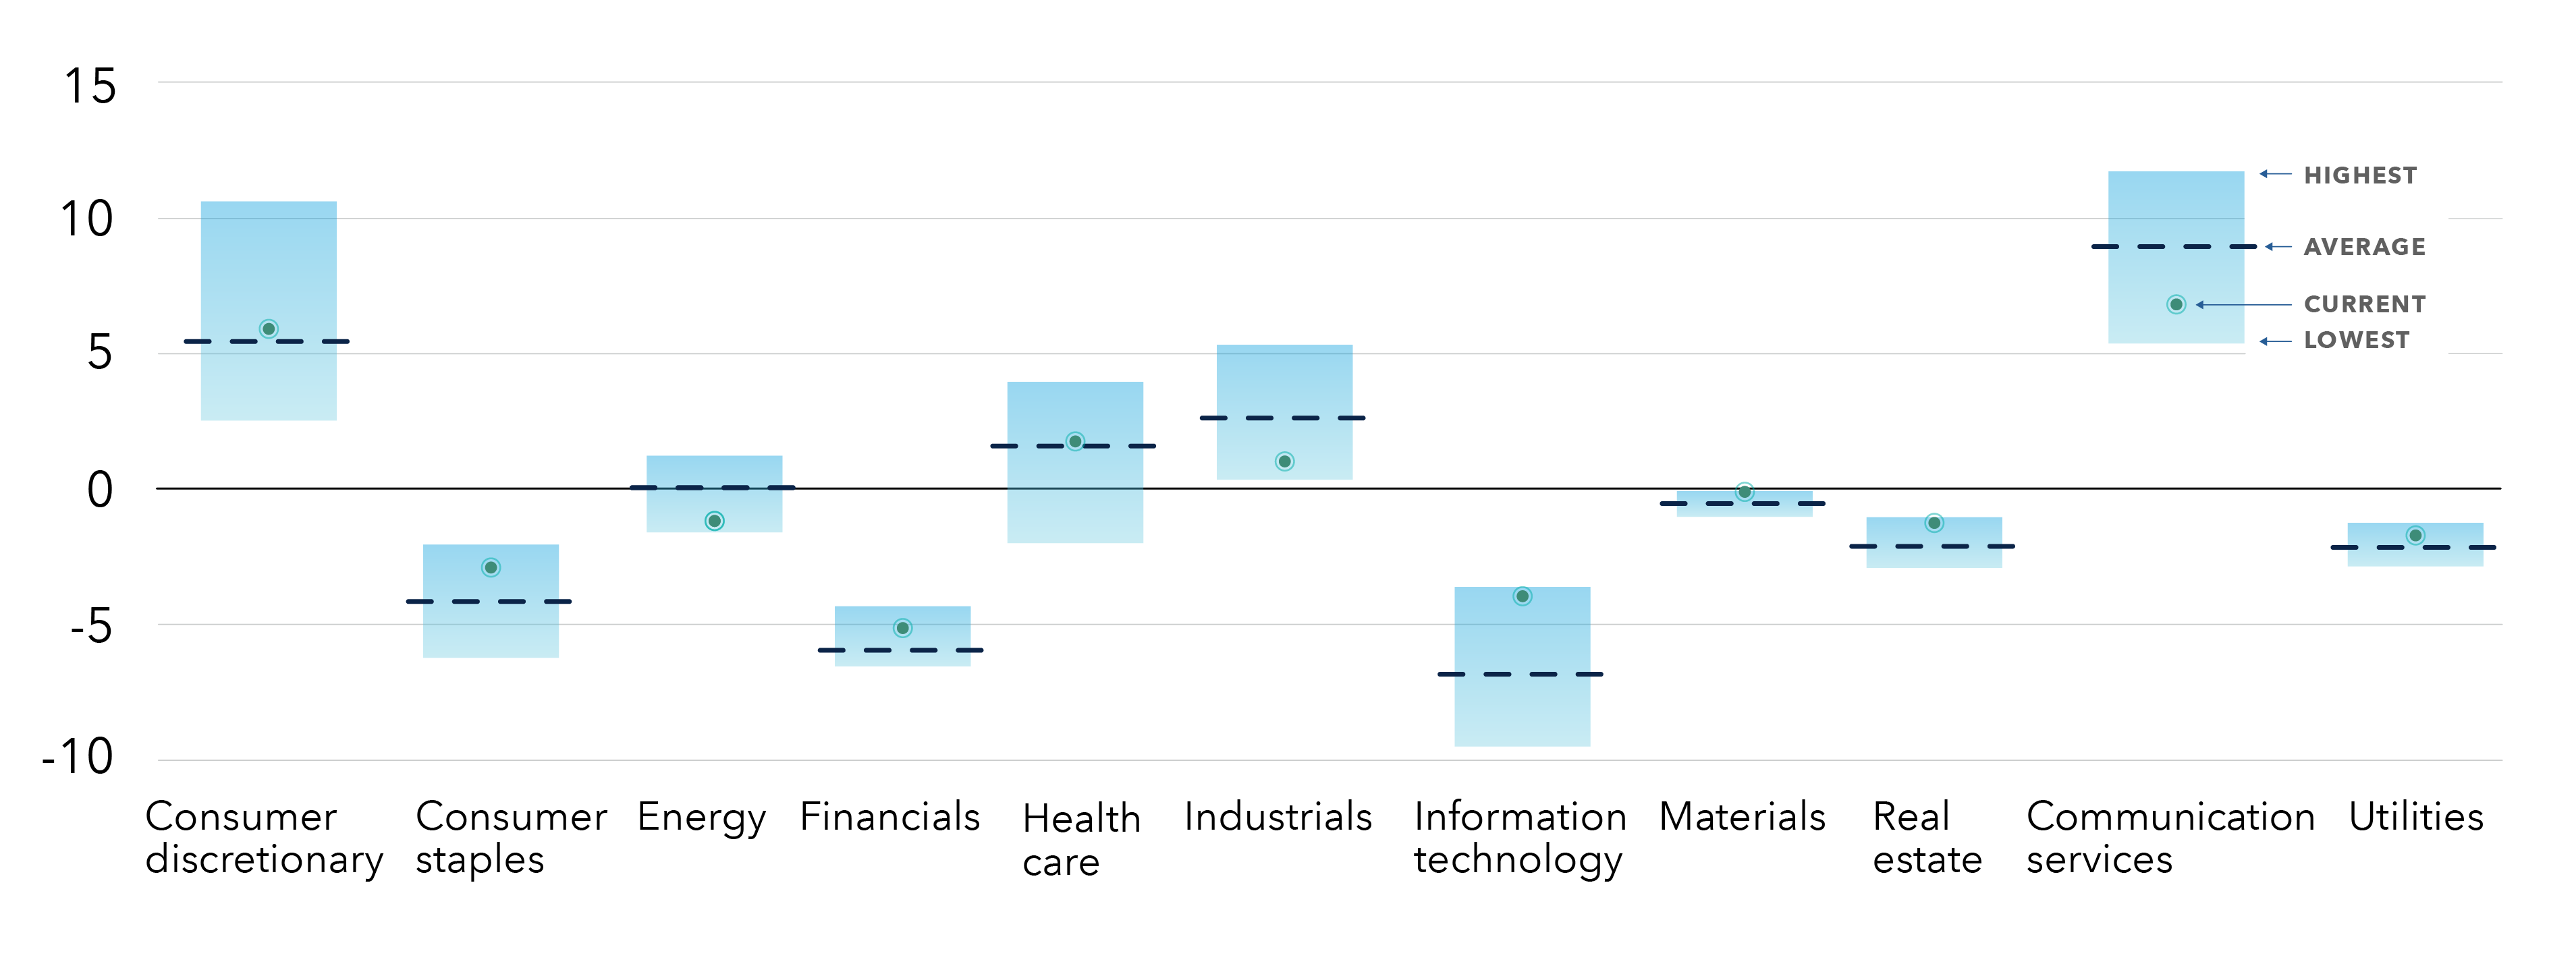
Sources: Capital Group, based on data from FactSet; S&P Dow Jones Indices. Data from fund inception date of 2/22/22 to 12/31/25.

3.  Diversified, not concentrated

  • CGGR seeks to avoid the single sector and megacap concentration that has increasingly defined style-based growth benchmarks and passive funds that track them.
  • This diversification spreads risk across the portfolio, reducing exposure to a narrow list of stocks.
  • As a result, returns have been driven by multiple contributors, rather than relying on one or two dominant megacap stocks.

Weight in top 5 holdings (%)

Horizontal bar chart shows the weight of the top five holdings for the Russell 1000 Growth Index, the S&P 500 Index and CGGR – Capital Group Growth ETF. The Russell 1000 Growth Index has the highest concentration, with 44.5% of assets in its top five holdings. The S&P 500 Index and CGGR have similar, lower concentrations, at 30.2% and 30.1% respectively.

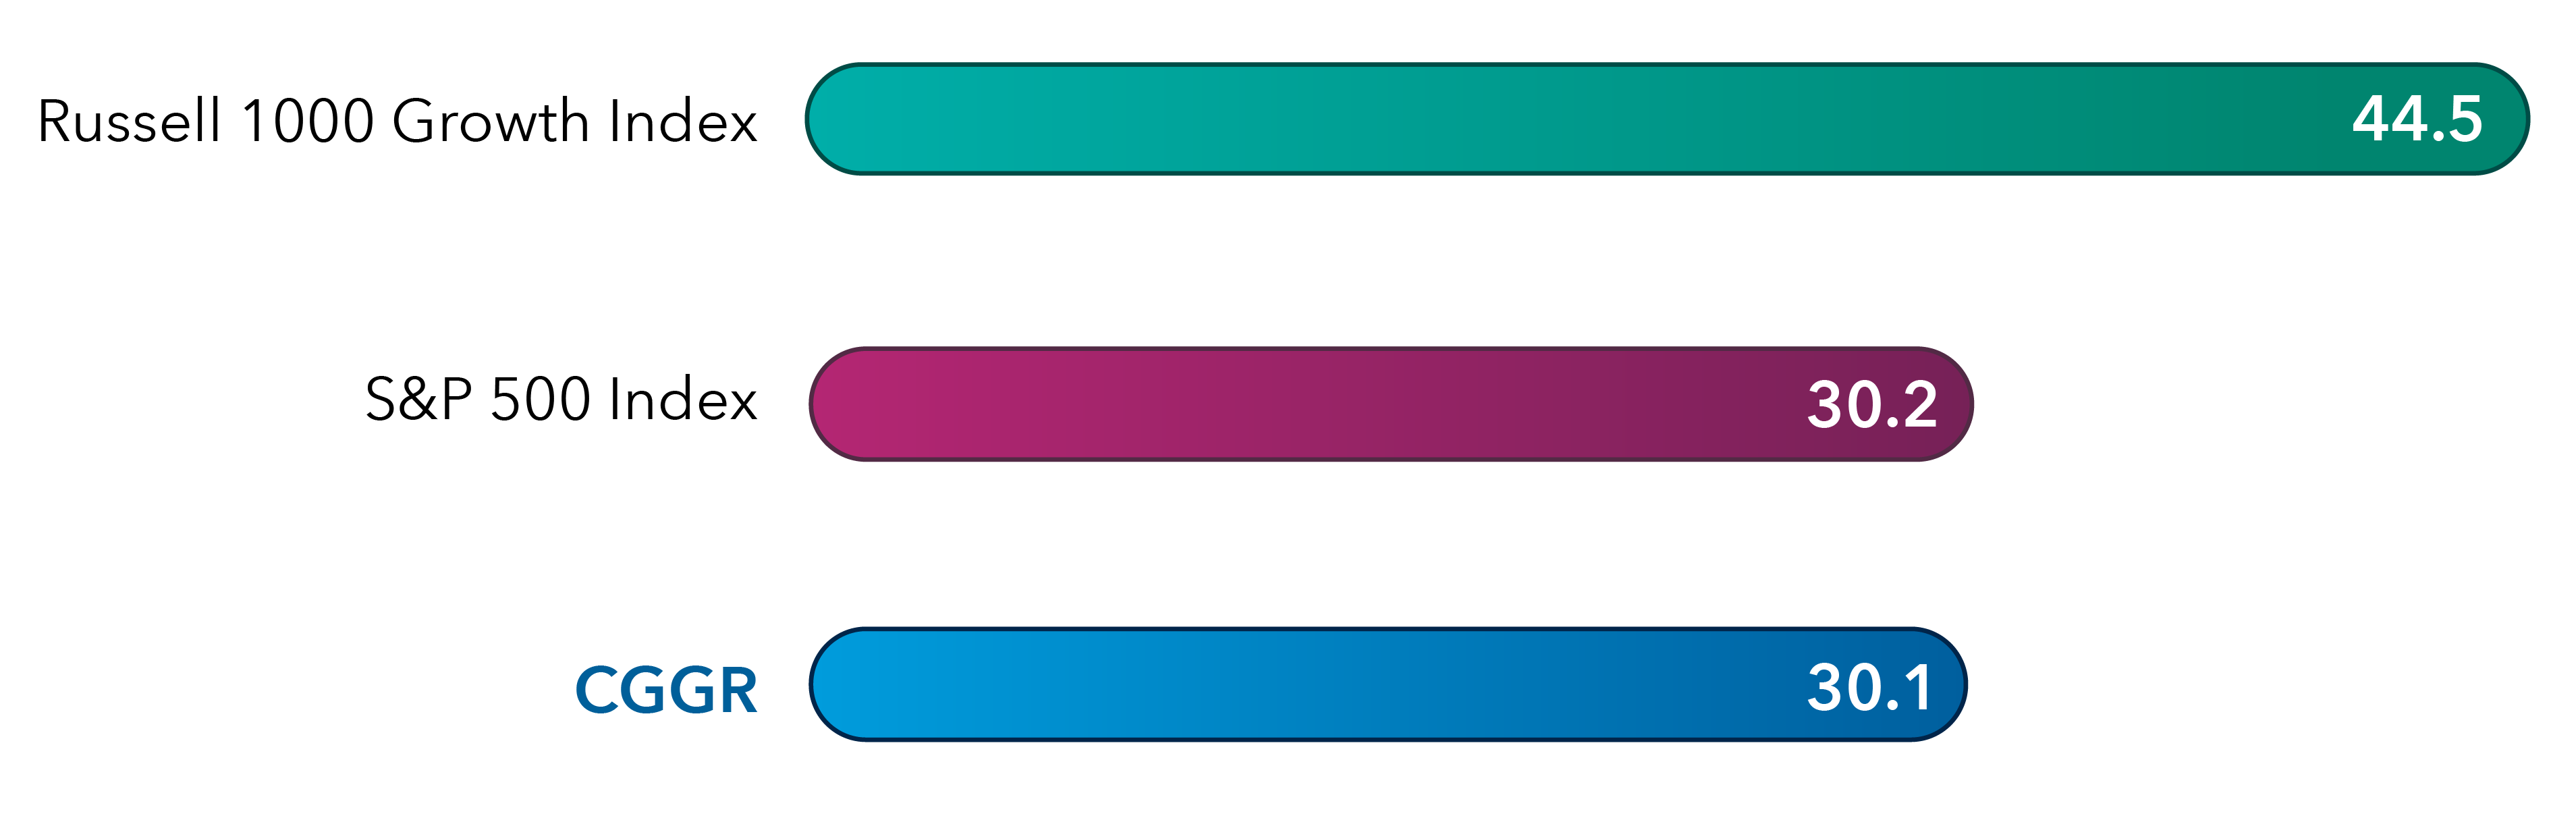
Source: Capital Group. As of 12/31/25.

4.  Seeking growth, but not at any cost

  • CGGR invests in companies with higher growth potential than the S&P 500 Index, based on estimated earnings per share growth, but at meaningfully lower valuations than the Russell 1000 Growth Index based on price-to-earnings (P/E) ratio.
  • These conditions suggest a tradeoff for investors — paying less for earnings than in the Russell 1000 Growth with potentially better growth than the S&P 500.
  • Growth is pursued with valuation awareness — not index indifference.

Valuation metrics

Table shows the price-to-earnings ratio and estimated earnings per share for the CGGR – Capital Group Growth ETF, the S&P 500 Index and the Russell 1000 Growth Index. CGGR has a price-to-earnings ratio of 29.3 times and estimated 3- to 5-year earnings per share growth of 14.9%. The S&P 500 Index shows a lower price-to-earnings ratio of 24.7 times and estimated earnings per share growth of 12.8%. The Russell 1000 Growth Index has the highest price-to-earnings ratio at 33 times and estimated earnings per share growth of 20.2%.

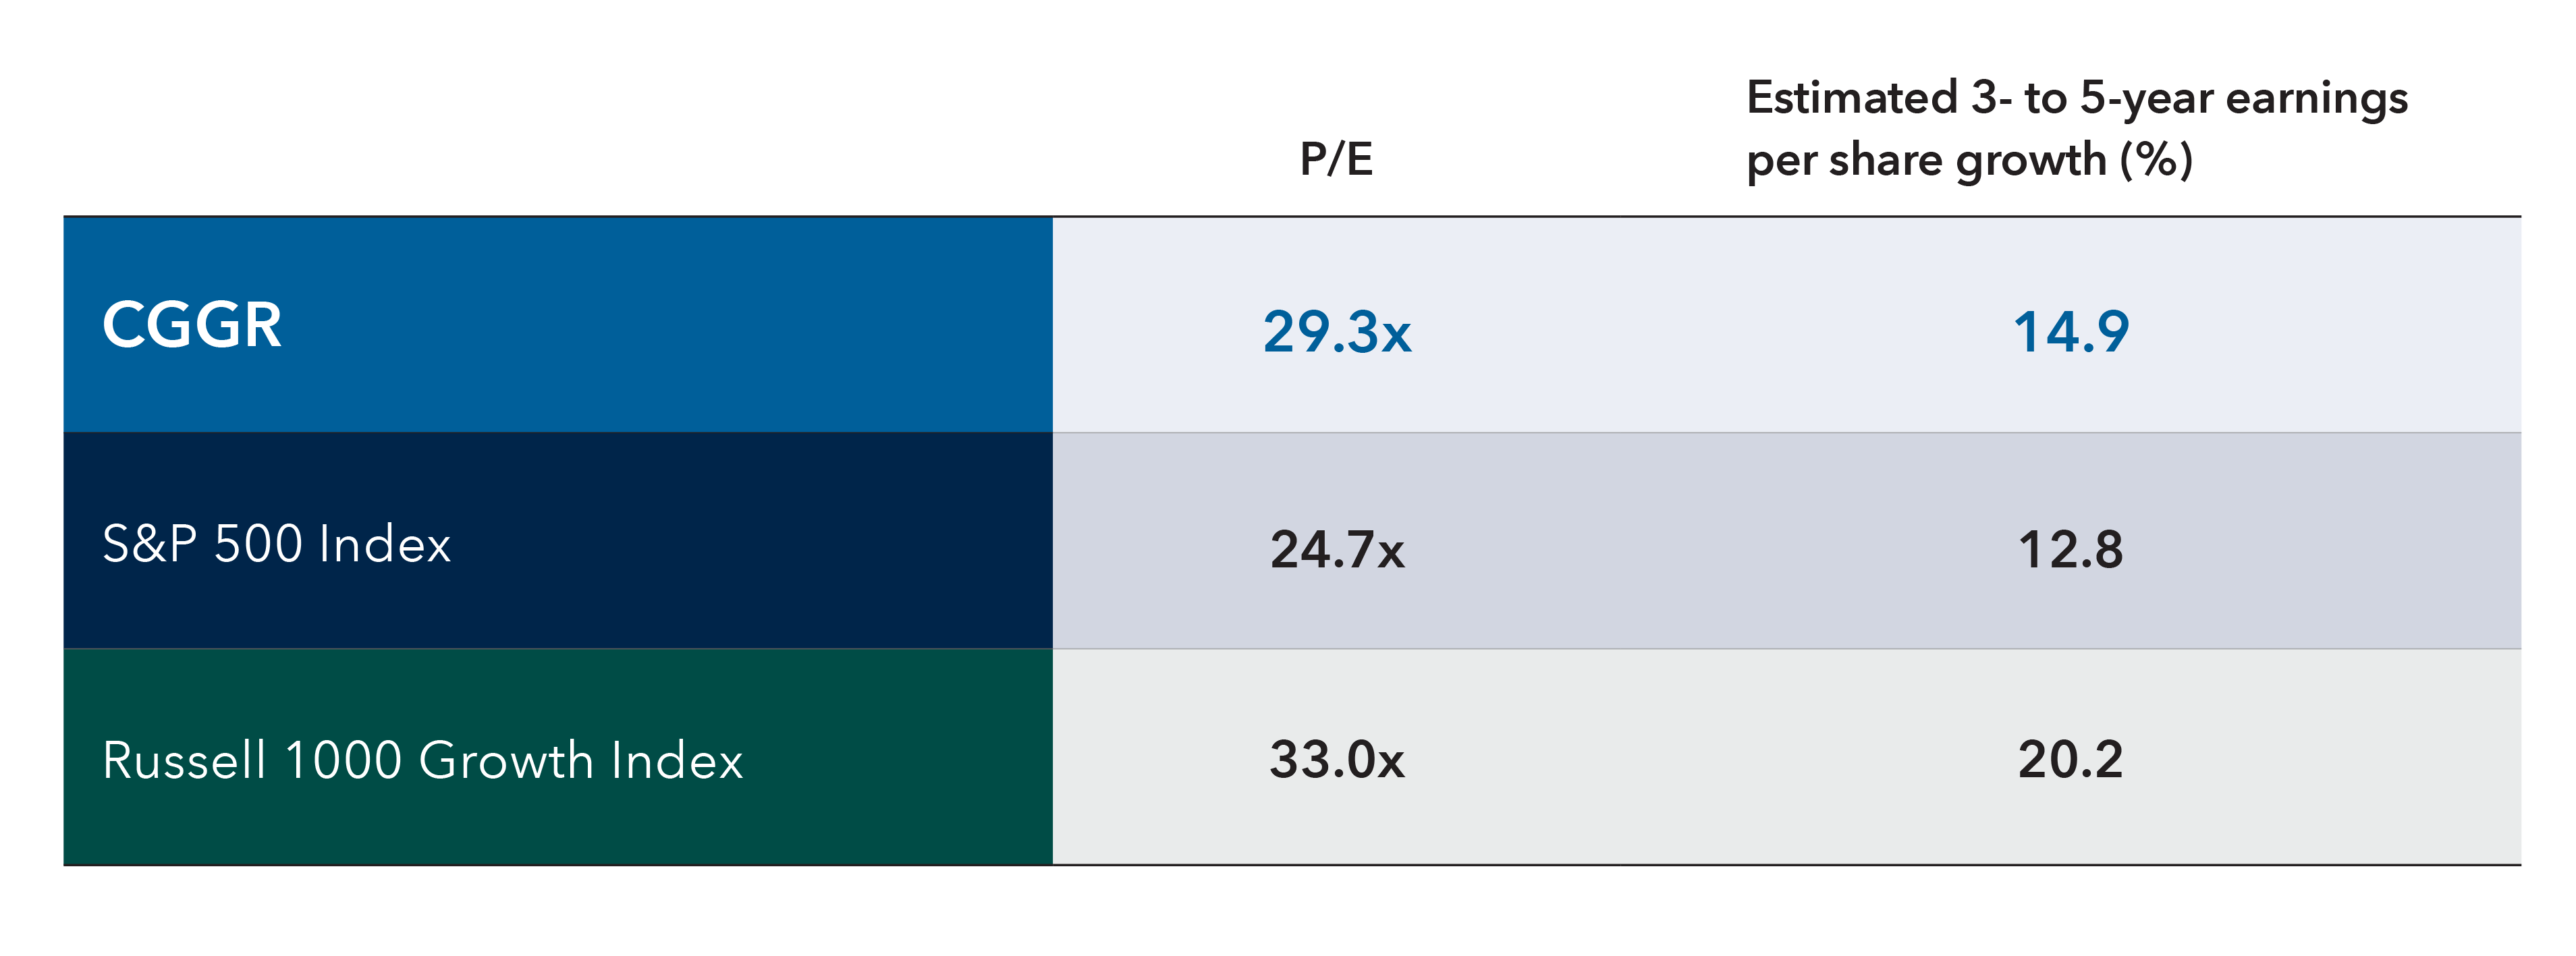
Source: FactSet. As of 12/31/25.

5.  A differentiated approach

  • Using a bottom-up approach, CGGR has differentiated sector exposures compared to the S&P 500 and the Russell 1000 Growth indexes.
  • The fund has been significantly underweight technology relative to the Russell 1000 Growth (nearly one-half of the sector allocation) and underweight relative to the S&P 500.
  • This positioning is designed to deliver diversification from extreme market concentration, while breaking from conventional growth allocations.
Table shows allocation comparisons for the CGGR – Capital Group Growth ETF holdings by sector versus the S&P 500 Index and the Russell 1000 Growth Index. Information technology represents 34.4% of the allocation in the S&P 500 Index, 30.8% in the CGGR, and 50.3% in the Russell 1000 Growth Index. Communication services is 10.6% in the S&P 500 Index, 17.4% in CGGR, and 12.1% in the Russell 1000 Growth Index. Consumer discretionary accounts for 10.4% in the S&P 500 Index, 16.3% in CGGR, and 13.3% in the Russell 1000 Growth Index. Health care represents 9.6% of the S&P 500 Index, 11.4% in CGGR, and 8.1% in the Russell 1000 Growth Index. Industrials is 8.2% in the S&P 500 Index, 8.9% in CGGR, and 6.0% in the Russell 1000 Growth Index. Financials accounts for 13.4% in the S&P 500 Index, 8.1% in CGGR, and 6.4% in the Russell 1000 Growth Index. Consumer staples represents 4.7% of the S&P 500 Index, 1.9% in CGGR, and 2.4% in the Russell 1000 Growth Index. Energy is 2.8% in the S&P 500 Index, 1.4% in CGGR, and 0.3% in the Russell 1000 Growth Index. Materials accounts for 1.8% in the S&P 500 Index, 1.8% in CGGR, and 0.3% in the Russell 1000 Growth Index. Utilities represents 2.2% in the S&P 500 Index, 0.4% in CGGR, and 0.3% in the Russell 1000 Growth Index. Real estate is 1.8% in the S&P 500 Index, 0.6% in CGGR, and 0.4% in the Russell 1000 Growth Index.

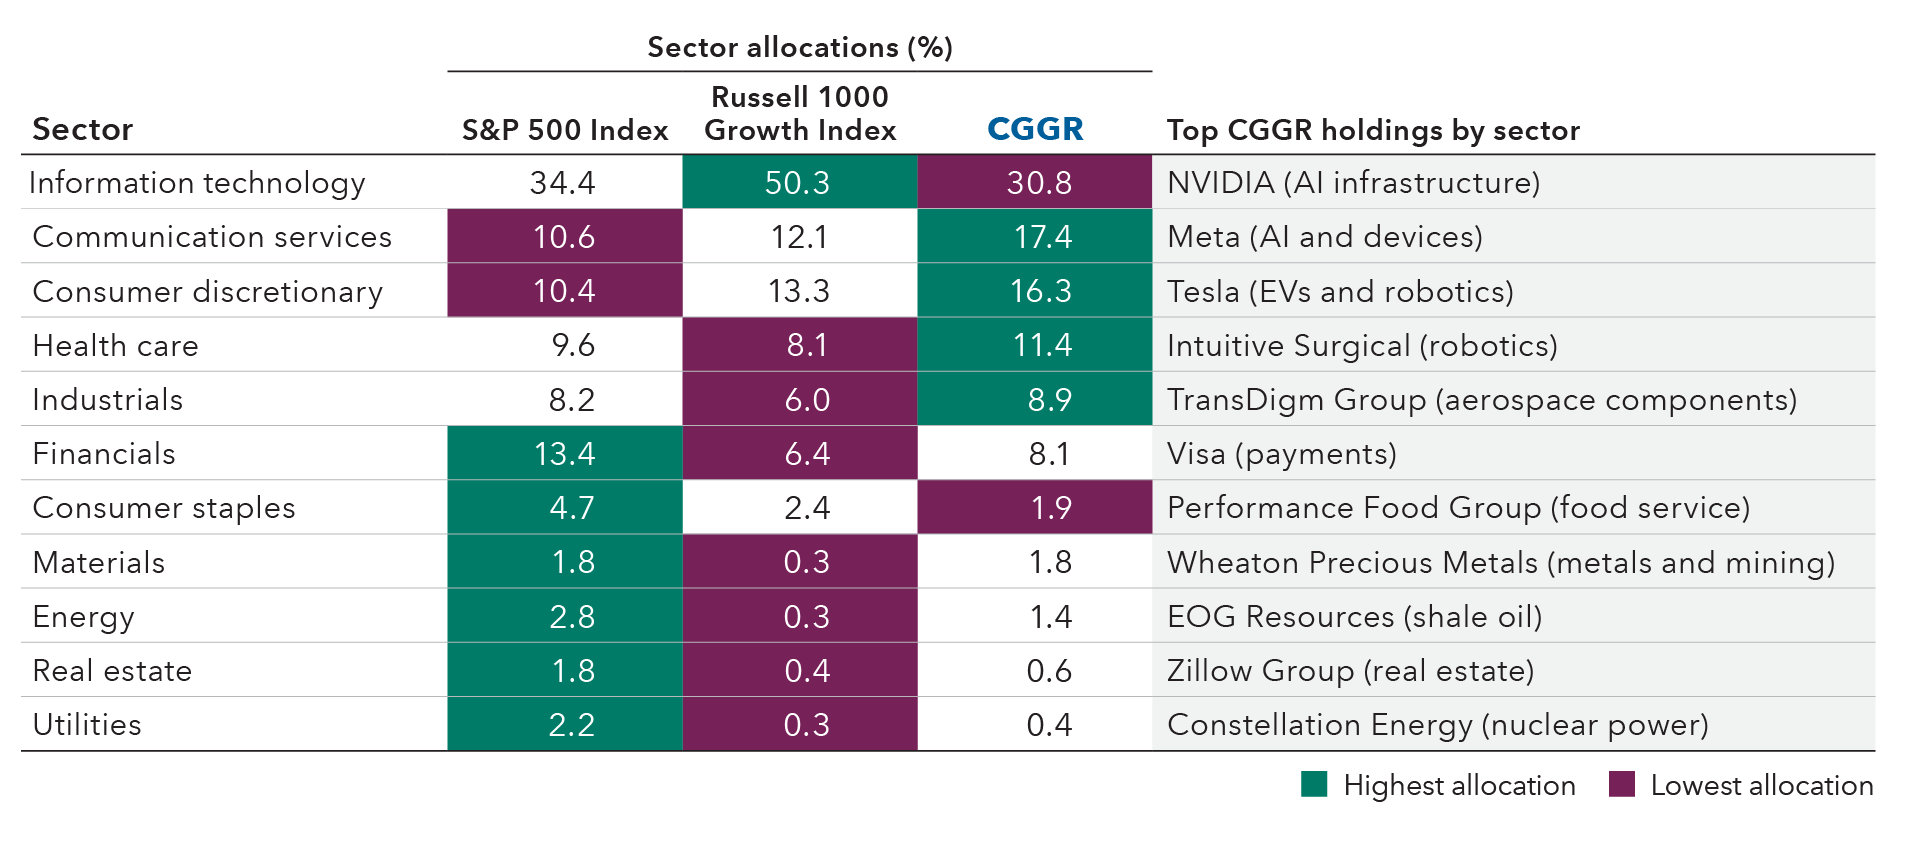
Source: Capital Group, FactSet. As of 12/31/25. Numbers are rounded.

Maria Karahalis is an equity investment director and portfolio strategy manager with 39 years of experience (as of 12/31/25). She holds a master’s degree in management from MIT Sloan School of Management and a bachelor’s degree in economics from Wellesley College.

Brad Olalde is an senior investment product manager with 13 years of industry experience (as of 12/31/2025). He holds a bachelor's degree in finance and international business from Villanova University.

Read all perspectives on equity markets

Figures shown are past results and are not predictive of results in future periods. Current and future results may be lower or higher than those shown. Investing for short periods makes losses more likely. Prices and returns will vary, so investors may lose money. View ETF expense ratios and returns.
For Capital Group ETFs, market price returns are determined using the official closing price of the fund's shares and do not represent the returns you would receive if you traded shares at other times.
Investments are not FDIC-insured, nor are they deposits of or guaranteed by a bank or any other entity, so they may lose value.
Investors should carefully consider investment objectives, risks, charges and expenses. This and other important information is contained in the ETF prospectuses and summary prospectuses, which can be obtained from a financial professional and should be read carefully before investing.
Capital Group exchange-traded funds (ETFs) are actively managed and do not seek to replicate a specific index. ETF shares are bought and sold through an exchange at the then current market price, not net asset value (NAV), and are not individually redeemed from the fund. Shares may trade at a premium or discount to their NAV when traded on an exchange. Brokerage commissions will reduce returns. There can be no guarantee that an active market for ETFs will develop or be maintained, or that the ETF's listing will continue or remain unchanged.
Bond ratings, which typically range from AAA/Aaa (highest) to D (lowest), are assigned by credit rating agencies such as Standard & Poor's, Moody's and/or Fitch, as an indication of an issuer's creditworthiness.
Investing outside the United States involves risks, such as currency fluctuations, periods of illiquidity and price volatility. These risks may be heightened in connection with investments in developing countries.
Nondiversified funds have the ability to invest a larger percentage of assets in the securities of a smaller number of issuers than a diversified fund. As a result, poor results by a single issuer could adversely affect fund results more than if the fund invested in a larger number of issuers. See the applicable prospectus for details.
There have been periods when the results lagged the index(es) and/or average(s). The indexes are unmanaged and, therefore, have no expenses. Investors cannot invest directly in an index.
FTSE/Russell indexes: London Stock Exchange Group plc and its group undertakings (collectively, the “LSE Group”). © LSE Group 2026. FTSE Russell is a trading name of certain of the LSE Group companies. FTSE indexes are trademarks of the relevant LSE Group companies and are used by any other LSE Group company under license. All rights in the FTSE Russell indexes or data vest in the relevant LSE Group company which owns the index or the data. Neither LSE Group nor its licensors accept any liability for any errors or omissions in the indexes or data and no party may rely on any indexes or data contained in this communication. No further distribution of data from the LSE Group is permitted without the relevant LSE Group company's express written consent. The LSE Group does not promote, sponsor or endorse the content of this communication.
Each S&P Index ("Index") shown is a product of S&P Dow Jones Indices LLC and/or its affiliates and has been licensed for use by Capital Group. Copyright © 2026 S&P Dow Jones Indices LLC, a division of S&P Global, and/or its affiliates. All rights reserved. Redistribution or reproduction in whole or in part is prohibited without written permission of S&P Dow Jones Indices LLC.
All Capital Group trademarks mentioned are owned by The Capital Group Companies, Inc., an affiliated company or fund. All other company and product names mentioned are the property of their respective companies.
Use of this website is intended for U.S. residents only. Use of this website and materials is also subject to approval by your home office.
Capital Client Group, Inc.
This content, developed by Capital Group, home of American Funds, should not be used as a primary basis for investment decisions and is not intended to serve as impartial investment or fiduciary advice.
© 2026 Morningstar, Inc. All rights reserved. The information contained herein: (1) is proprietary to Morningstar and/or its content providers; (2) may not be copied or distributed; and (3) is not warranted to be accurate, complete or timely. Neither Morningstar, its content providers nor Capital Group are responsible for any damages or losses arising from any use of this information. Past performance is no guarantee of future results. Information is calculated by Morningstar. When applicable, due to differing calculation methods, the figures shown here may differ from those calculated by Capital Group.

Price-to-earnings (P/E) ratio is a valuation metric that measures a company’s current share price relative to its earnings per share (EPS).
 

Russell 1000 Growth Index: Tracks large-cap U.S. growth stocks by market capitalization.
 

S&P 500 Index: A market-capitalization-weighted index of about 500 major U.S. stocks. Includes reinvested dividends but excludes fees and taxes.
 

ETF market price returns since inception are calculated using NAV for the period until market price became available (generally a few days after inception).
 

When applicable, results reflect fee waivers and/or expense reimbursements, without which they would have been lower. Please see capitalgroup.com for more information.