
March 18, 2026

It’s delivered both growth and income
- CGDV seeks gross income that outpaces the S&P 500 Index, along with greater capital appreciation.
- The fund emphasizes dividend payers, with flexibility to own select nonpayers while maintaining quality discipline.
- This approach has translated into higher yields, stronger returns and less downside than the S&P 500.
3-year range of dividend yields (%)
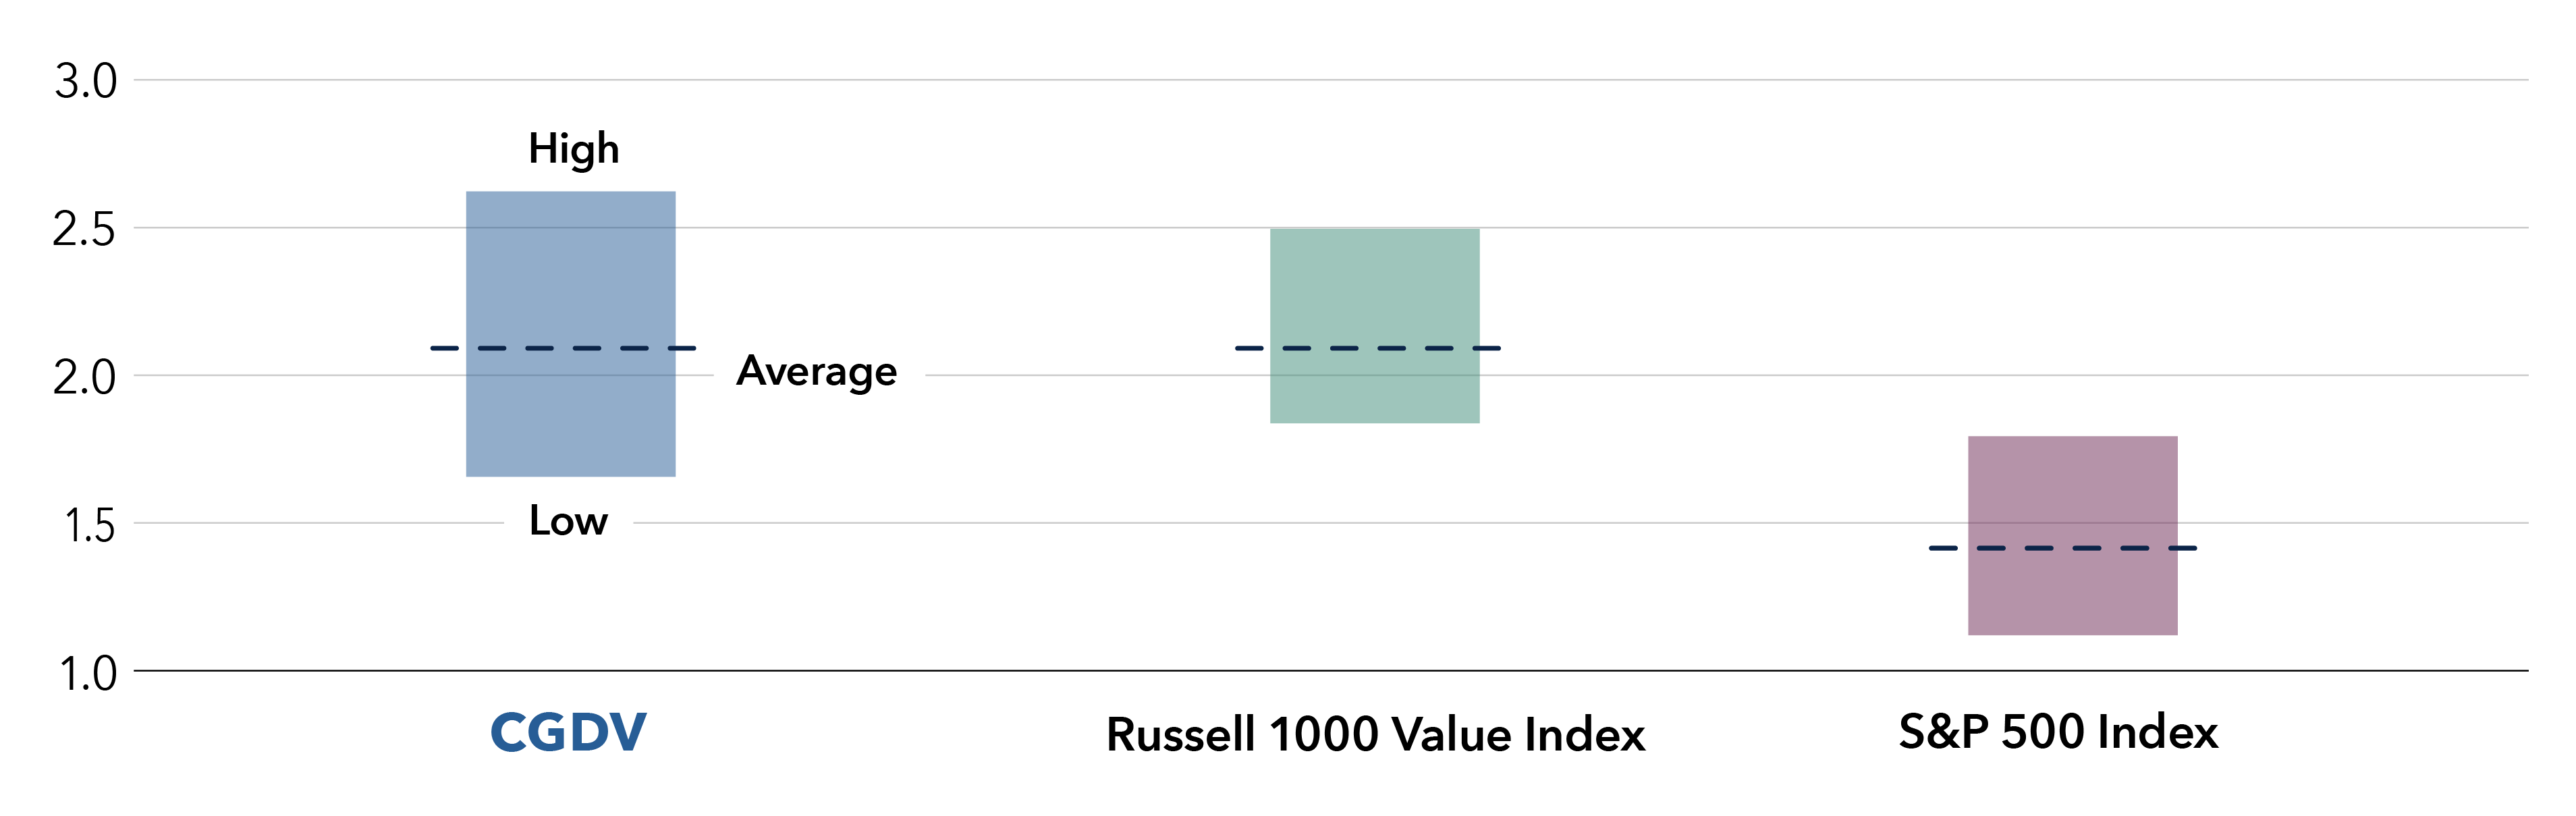
Source: Morningstar. As of 12/31/25.

Focused on high quality
- The fund stands apart from the S&P 500 and the Russell 1000 Value indexes through its focus on high-quality companies.
- The fund maintained 88% of its holdings in high-quality companies, well above the S&P 500 and Russell 1000 Value.
- In our view, quality dividend-paying companies can help consistently mitigate downside risk in a way traditional value stocks cannot.
Holdings breakdown by security quality (equal weighted)
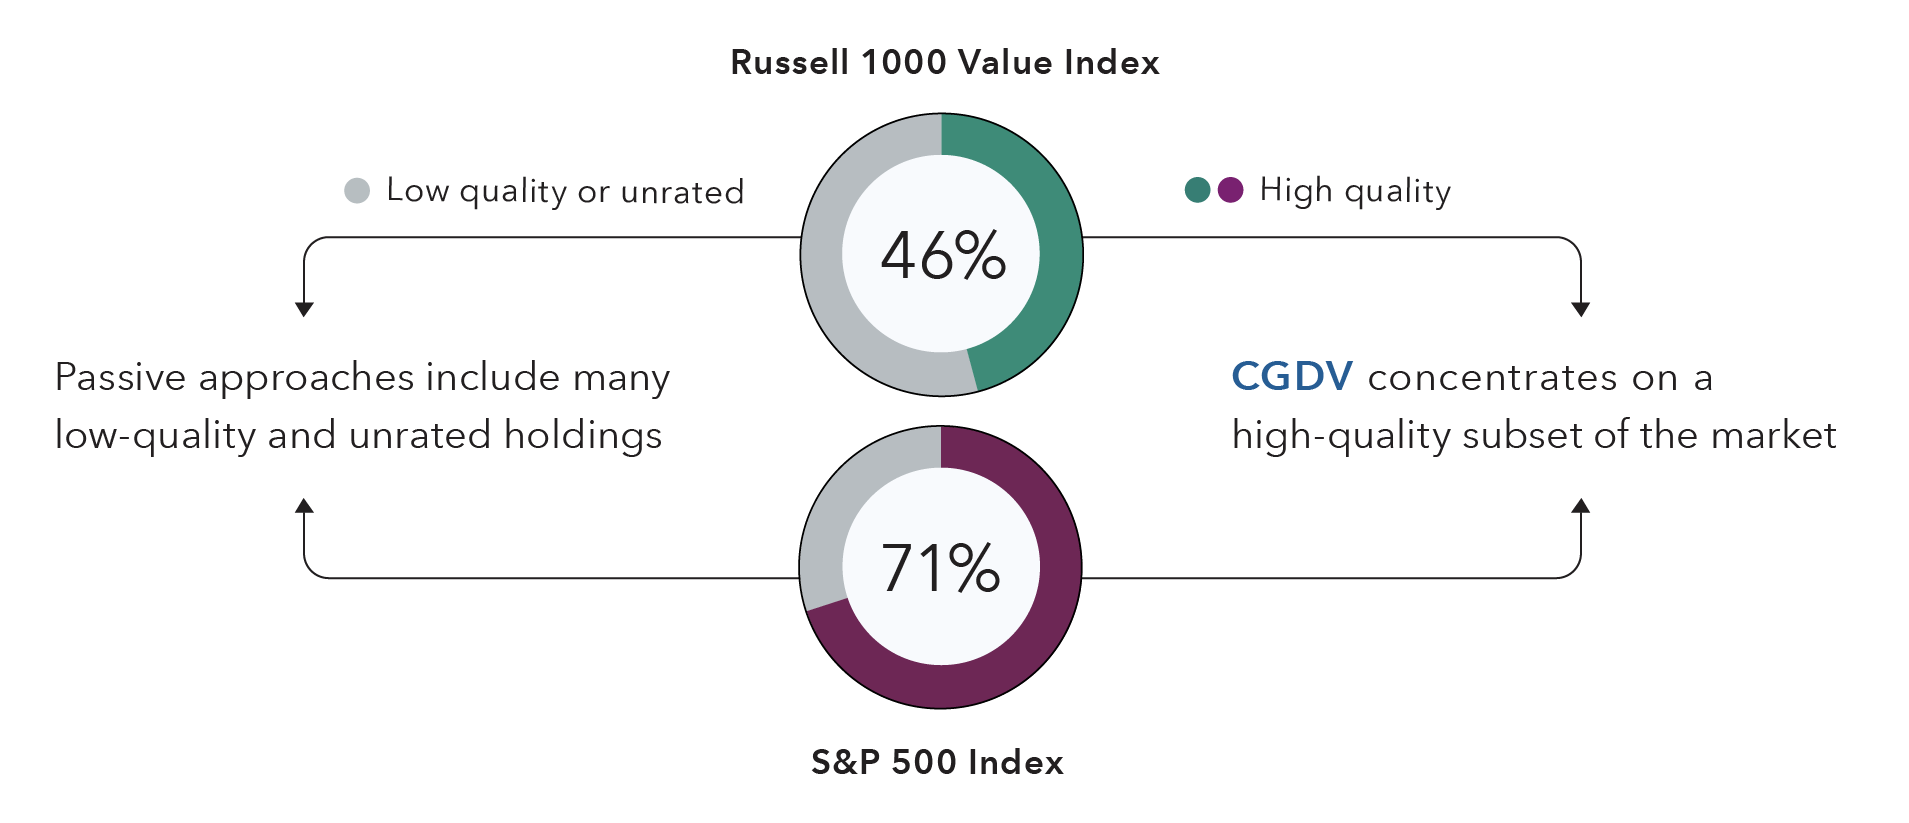
Source: FactSet, with credit ratings by S&P Global Ratings. As of 12/31/25. High quality: BBB- and above.

A disciplined framework
- CGDV has invested in higher quality companies, more dividend payers and provided more international diversification than the S&P 500 and Russell 1000 Value indexes.
- This differentiated positioning is enabled by continuous research, a global presence and active management.
- Three guidelines provide focus: CGDV holdings are at least 90% investment grade (BBB/Baa and above), primarily U.S.-domiciled (10% max non-U.S.) and at least 80% dividend payers.
Allocations to investment grade, U.S.-domiciled and dividend-paying companies (%)
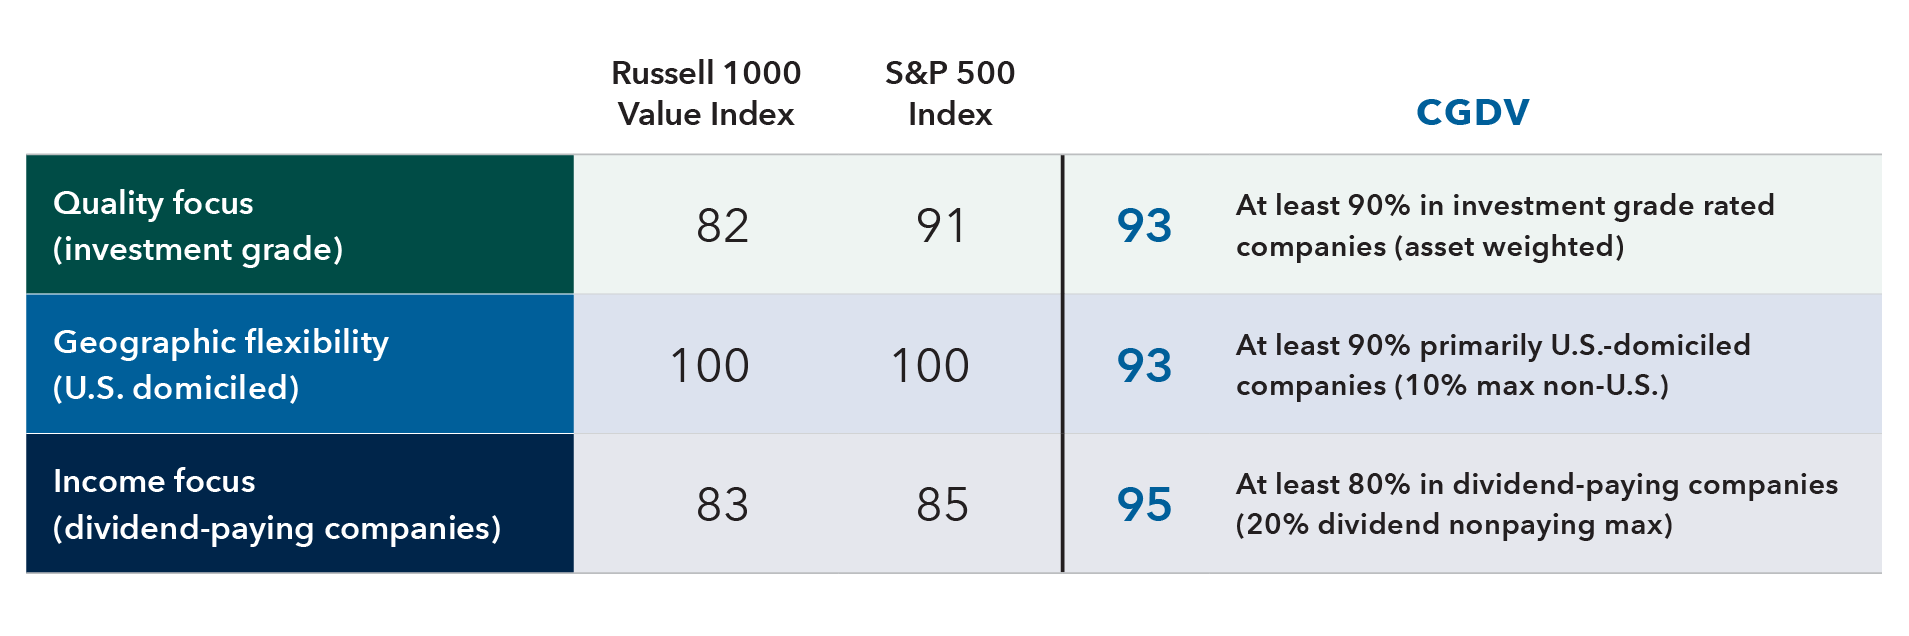
Source: FactSet, with credit ratings by S&P Global Ratings. As of 12/31/25.

A history of more upside, with less downside
- Beyond strong results in rising markets, CGDV demonstrated resilience when markets fell.
- Notably, over the last three years, the fund delivered strong upside (participating in rising prices), with less downside (falling less than the market).
- A distinctive approach, active flexibility and an emphasis on quality dividend payers have helped when markets were at their worst.
CGDV 3-year capture ratios (%)
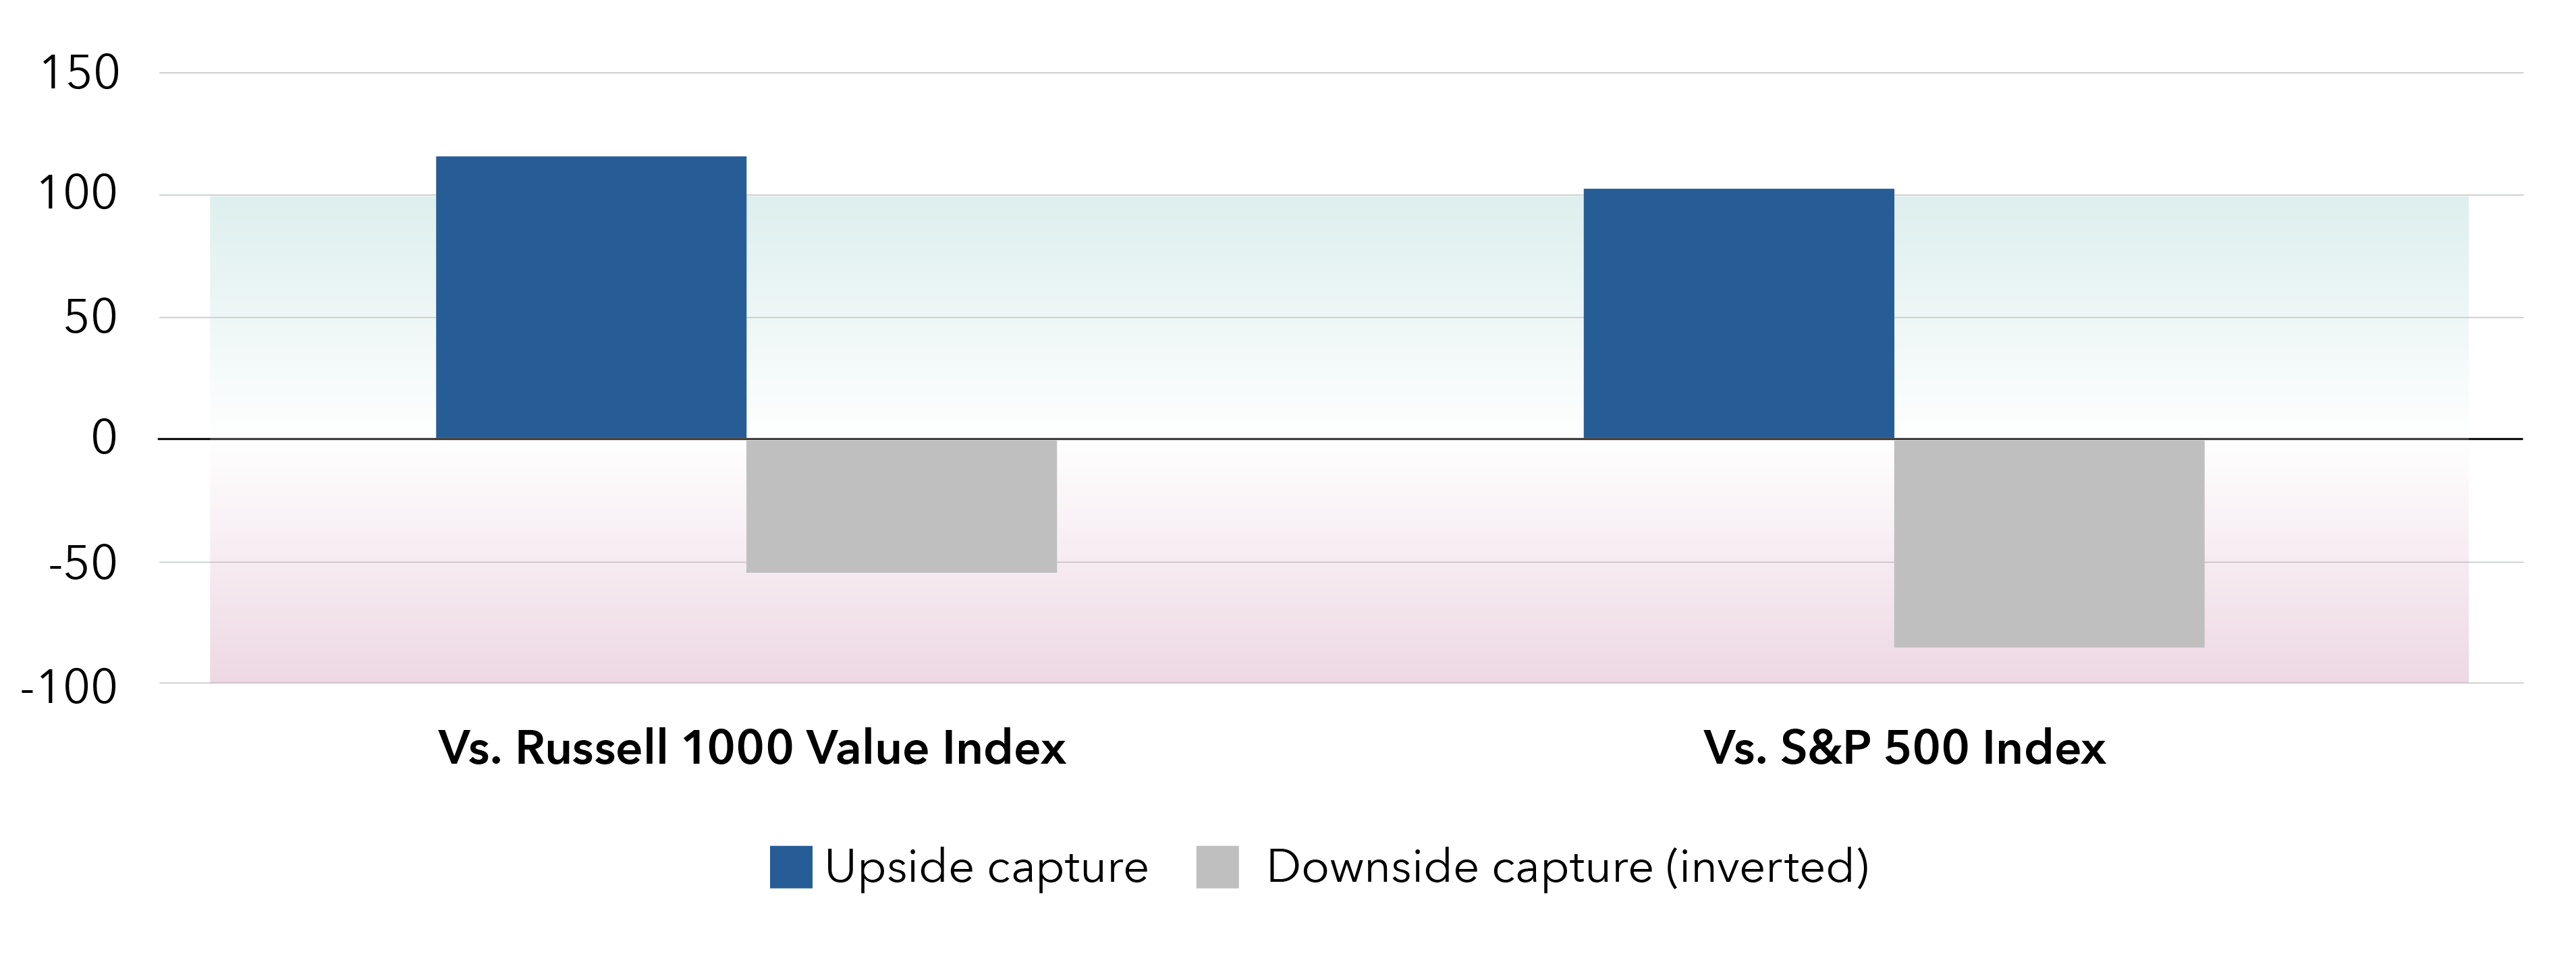
Source: Morningstar. As of 12/31/25.

A differentiated approach
- Using a bottom‑up approach, CGDV has unique sector exposures compared to the S&P 500 and Russell 1000 Value indexes.
- The fund has been materially overweight technology versus the Russell 1000 Value — while remaining below the S&P 500’s concentration — and meaningfully underweight financials.
- This positioning seeks to deliver diversification from extreme market concentration while breaking from conventional value allocations.
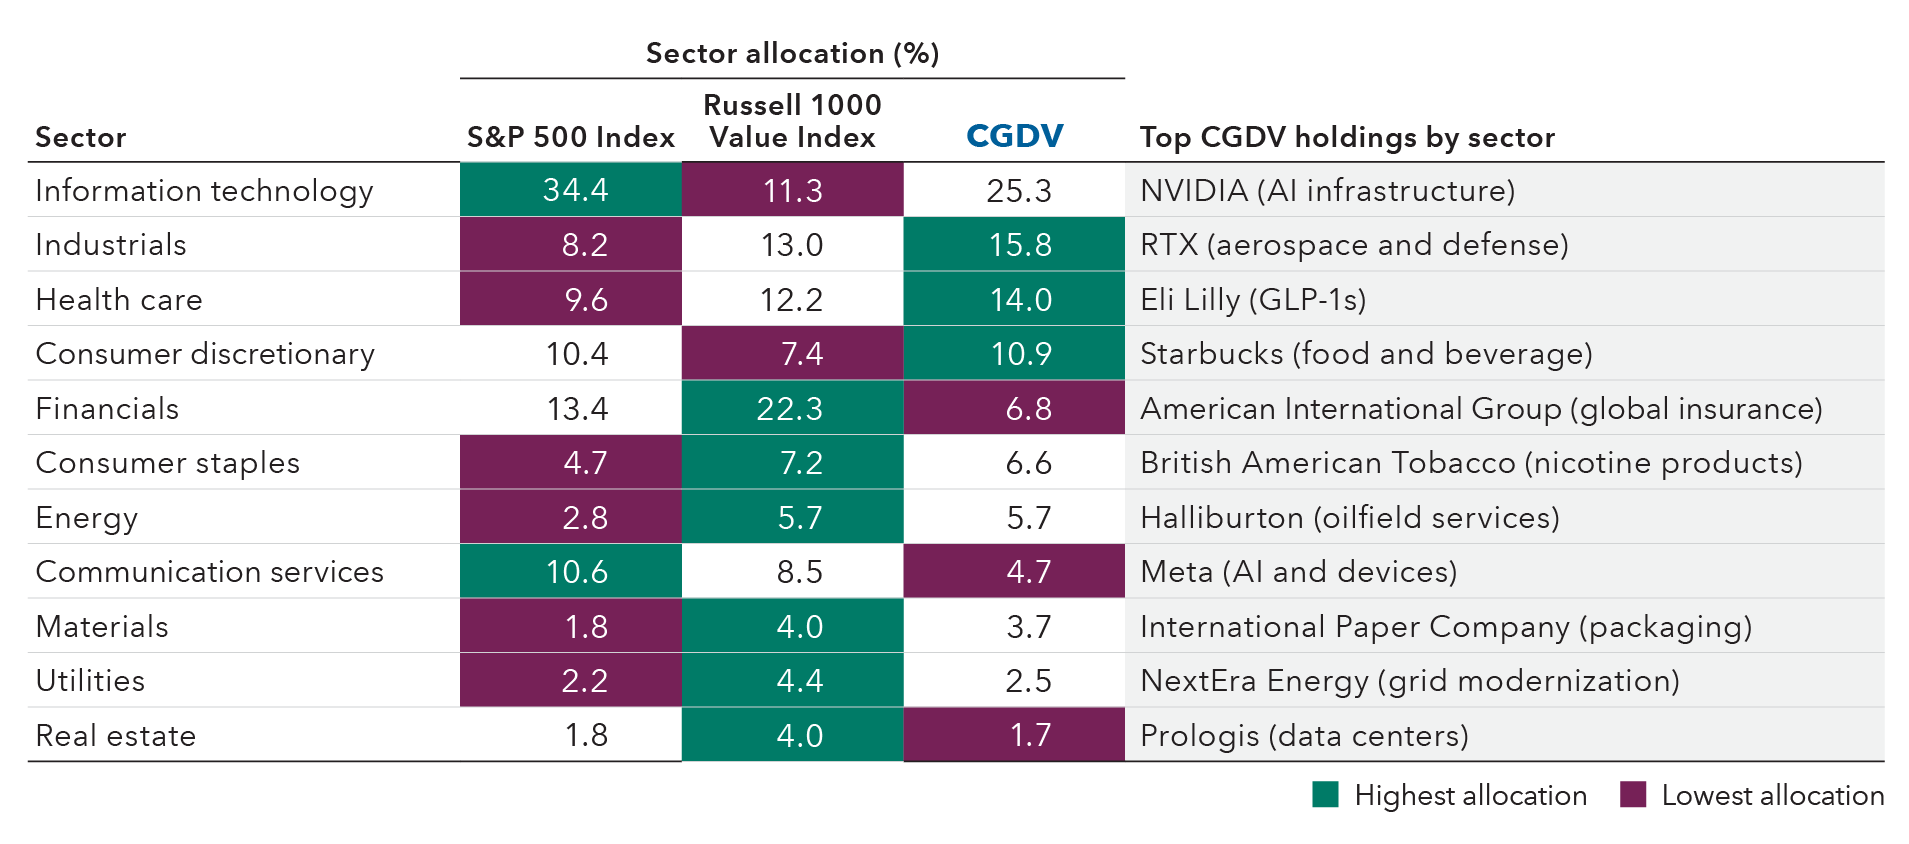
Source: FactSet. As of 12/31/25. Numbers are rounded.