Returns matter more than you think

Our 70/30 hypothetical illustration shows how returns grow

By the time participants retire, as much as 70% of their account value could come from returns, not contributions.

A graph shows the manner in which returns start to outpace contributions over time. In a hypothetical example, a participant earning a 6% return contributes 94% toward total account value. Fifteen years later, returns will have increased to the point where they are greater than the participant's annual contributions. After 40 years, retirement returns may far outpace contributions, accounting for 70% of the participant's retirement account value. See footnote: The demographic assumptions, returns and ending balances are hypothetical and provided for illustrative purposes only, and are not intended to provide any assurance or promise of actual returns and outcomes. Returns will be affected by the management of the investments and any adjustments to the assumed contribution rates, salary or other participant demographic information. Actual results may be higher or lower than those shown. Past results are not predictors of results in future periods. Based on an exhibit by CBS Moneywatch.

The demographic assumptions, returns and ending balances are hypothetical and provided for illustrative purposes only, and are not intended to provide any assurance or promise of actual returns and outcomes. Returns will be affected by the management of the investments and any adjustments to the assumed contribution rates, salary or other participant demographic information. Actual results may be higher or lower than those shown. Past results are not predictive of results in future periods. Based on an exhibit by CBS Moneywatch.

It’s why investment selection matters

Share our 70/30 returns story with clients

Download and share a PDF of this hypothetical illustration

Contributions should work as hard as participants

The following hypothetical example assumes a $40,000 starting salary with a 3% increase each year, and a 6% annual investment return.
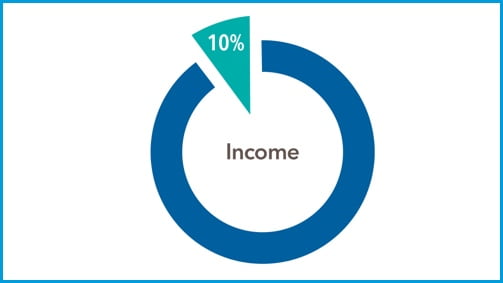
The starting point

The participant contributes 10% of their income throughout their career starting at age 26

A simple pie chart shows 10% of a participant's income being invested in their retirement savings account.

The turning point

The participant could earn an annual return of $7,500 in year 15, more than the $6,000 contribution that year

A bar graph shows that in year 10 of this example, the participant contributes $5,000 of their income and could earn $4,000 in returns. In year 15, they contribute $6,000 and could earn $7,500 in returns. In year 20, they contribute $7,000 and could earn $12,000 in returns. See footnote: Hypothetical results are for illustrative purposes only and in no way represent the actual results of a specific investment. Your investment experience will differ.

The retirement point

By age 65, the participant earning 6% could accrue about $1 million, with 70% of the account derived from returns

Earning 8%, returns could make up 81%, accruing $602,479 more — double the overall contribution

A bar graph shows how – at a 6% annual rate of return – a hypothetical $1 million accrual is divided between a $300,000 investment and a $700,000 return on investment. A second data point shows how – at an 8% annual rate of return – a hypothetical $1.6 million accrual is divided between a $300,000 investment and a $1.3 million return on investment.

Hypothetical results are for illustrative purposes only and in no way represent the actual results of a specific investment. Your investment experience will differ.

Put choice of manager top of mind

The quality of the investments starts with who is managing them. Active managers that have a history
of beating market indexes may give participant contributions the biggest boost.

Reach Capital Group at

(800) 421-9900

See the impact

Learn how even a 1% increase in annual returns can significantly impact retirement outcomes

Evaluate target date series

Compare up to four target date funds using our Target Date ProView tool

Find a solution

See which of our funds beat the index over the long term, and by how much

Investments are not FDIC-insured, nor are they deposits of or guaranteed by a bank or any other entity, so they may lose value.
Investors should carefully consider investment objectives, risks, charges and expenses. This and other important information is contained in the fund prospectuses and summary prospectuses, which can be obtained from a financial professional and should be read carefully before investing.
All Capital Group trademarks mentioned are owned by The Capital Group Companies, Inc., an affiliated company or fund. All other company and product names mentioned are the property of their respective companies.
Use of this website is intended for U.S. residents only. Use of this website and materials is also subject to approval by your home office.
American Funds Distributors, Inc.
This content, developed by Capital Group, home of American Funds, should not be used as a primary basis for investment decisions and is not intended to serve as impartial investment or fiduciary advice.