
PORTFOLIO CONSTRUCTION
Value isn't always defensive
Test your portfolio’s resilience
Get a personalized portfolio consultation.
Value indexes have experienced more downside than other broader market indexes
In fact, the Russell 1000 Value Index underperformed Standard & Poor's 500 Composite Index in five of the last seven market declines by an average of 221 bps.
Last seven market declines*

*A bear market, like the one we saw during the Great Recession, is defined as a cumulative decline of S&P 500 Price Return Index of 20% or more from peak to trough, and a correction, like the ones shown in the six periods following the Great Recession, is defined as a cumulative decline of S&P 500 Price Return Index of 10% to 20% from peak to trough. The returns shown are based on total returns.
Source: Morningstar as of 4/30/19. Market decline definitions: Global selloff (9/20/18–12/24/18); Rates scare (1/26/18–2/8/18); Oil price shock (11/3/15–2/11/16); China slowdown (5/21/15–8/25/15); U.S. debt downgrade (4/29/11–10/3/11); Flash crash (4/23/10–7/2/10); Great Recession (10/9/07–3/9/09)
WHAT THIS MEANS
Although tilting toward value may expose a portfolio to “defensive” characteristics such as higher dividend yields, those higher yields may be from lower quality stocks.
Around 26% of the stocks in the top third (highest yielding) in the Russell 1000 Index were paid by companies rated BBB– or lower, as of 6/30/19. These high-yielding, BBB– and lower stocks had an average 10-year S&P 500 down capture ratio of 124%.
Source: Morningstar as of 6/30/19.
A true defensive equity solution
For investors looking to reduce equity volatility, consider more rigorous fund criteria and don’t assume that any product with a “value” label will help reduce equity risk. Consider funds that exhibit the following characteristics:

A true commitment to dividends
% of stock portfolio in dividend payers
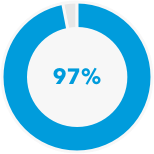

Russell 1000 Value Index

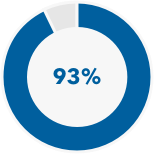
Low exposure to lower credit quality companies
% of rated companies with BBB- or lower credit quality

American Funds American Mutual Fund

American Funds Washington Mutual Investors Fund
Russell 1000 Value Index
Rating percentages and other statistics based on only those companies with debt rated by Standard & Poor’s credit rating agency, as of June 30, 2019.
Source: Bloomberg

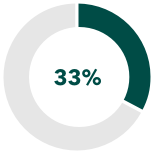
Lower standard deviation and down capture ratio than the index
10-year standard deviation
For the 10 years ending June 30, 2019

Down capture ratio
For the 10 years ending June 30, 2019

Although we compare American Funds American Mutual Fund and American Funds Washington Mutual Investors Fund to the Russell 1000 Value Index above, the benchmark used to measure the performance of these funds is the S&P 500.
Sources: Morningstar, Capital Group
© 2020 Morningstar, Inc. All rights reserved.
Standard & Poor’s 500 Composite Index is a market capitalization-weighted index based on the results of approximately 500 widely held common stocks. The S&P 500 is a product of S&P Dow Jones Indices LLC and/or its affiliates and has been licensed for use by Capital Group. Copyright © 2020 S&P Dow Jones Indices LLC, a division of S&P Global, and/or its affiliates. All rights reserved. Redistribution or reproduction in whole or in part is prohibited without written permission of S&P Dow Jones Indices LLC.
Russell 1000 Value Index refers to a composite of large- and mid-cap companies located in the United States that also exhibit a value probability. The Russell 1000 Value is published and maintained by FTSE Russell. Russell Investment Group is the source and owner of the trademarks, service marks and copyrights related to the Russell Indexes. Russell® is a trademark of Russell Investment group.
The Russell 1000 Index is an index of approximately 1,000 of the largest companies in the U.S. equity market. The Russell 1000 is a subset of the Russell 3000 Index. It represents the top companies by market capitalization. The Russell 1000 typically comprises approximately 90% of the total market capitalization of all listed U.S. stocks.
The Morningstar Large Value Index measures the performance of large-cap stocks with relatively low prices given anticipated per-share earnings, book value, cash flow, sales and dividends.
The market indexes are unmanaged and, therefore, have no expenses. Investors cannot invest directly in an index.
Annualized standard deviation (based on monthly returns) is a common measure of absolute volatility that tells how returns over time have varied from the mean. A lower number signifies lower volatility.
The down capture ratio is a statistical measure of a fund's overall performance in down markets. It is used to evaluate how well a fund performed relative to an index during periods when that index has dropped. The ratio is calculated by dividing the fund's returns by the returns of the index during the down market and multiplying that factor by 100.
Figures shown are past results and are not predictive of results in future periods. Current and future results may be lower or higher than those shown. Share prices and returns will vary, so investors may lose money. Investing for short periods makes losses more likely.
Investments are not FDIC-insured, nor are they deposits of or guaranteed by a bank or any other entity, so they may lose value.
Investors should carefully consider investment objectives, risks, charges and expenses. This and other important information is contained in the fund prospectuses and summary prospectuses, which can be obtained from a financial professional and should be read carefully before investing.
Statements attributed to an individual represent the opinions of that individual as of the date published and do not necessarily reflect the opinions of Capital Group or its affiliates. This information is intended to highlight issues and should not be considered advice, an endorsement or a recommendation.
Bond ratings, which typically range from AAA/Aaa (highest) to D (lowest), are assigned by credit rating agencies such as Standard & Poor's, Moody's and/or Fitch, as an indication of an issuer's creditworthiness. If agency ratings differ, the security will be considered to have received the highest of those ratings, consistent with the fund's investment policies.
This content, developed by Capital Group, home of American Funds, should not be used as a primary basis for investment decisions and is not intended to serve as impartial investment or fiduciary advice.
All Capital Group trademarks mentioned are owned by The Capital Group Companies, Inc., an affiliated company or fund. All other company and product names mentioned are the property of their respective companies.
American Funds Distributors, Inc., member FINRA.
Investment results assume all distributions are reinvested and reflect applicable fees and expenses. When applicable, investment results reflect expense reimbursements, without which results would have been lower. Please see capitalgroup.com for more information.