Categories
Bonds
Bond outlook: A robust market underscores nimble investing
Chitrang Purani
Fixed Income Portfolio Manager
Damien McCann
Fixed Income Portfolio Manager
Xavier Goss
Portfolio Manager

The bond market is riding into 2026 on powerful tailwinds: a resilient economy, strong investments in AI and rate cuts from the Federal Reserve. Yields that remain elevated relative to levels seen in the decade following the global financial crisis also point to solid return potential.


The Bloomberg U.S. Aggregate Index has posted a gain of 7.0% for the year through December 11, its strongest showing since 2020 and a sharp turnaround from losses inflicted by the Fed’s hiking cycle in 2022. 


History shows a correlation between starting yields and forward returns

A scatterplot shows the relationship between monthly starting yield-to-worst (shown on the x-axis) and historical five-year forward returns (shown on the y-axis) for the Bloomberg U.S. Aggregate Index. Each dot represents a month between January 2000 and October 2025. A dotted trend line cuts up and to the right, based on the broader history of yields and forward returns between 1980 through 2025, illustrating that as starting yields increased, forward returns tended to rise. A larger dot is highlighted near the middle of the range showing the current starting yield as of November 2025.

Sources: Capital Group, Bloomberg. Historical 5-year forward returns between 2007 and 2020. Dates for periods shown: Pre-GFC: 1/1/00-4/30/07; GFC: 4/30/07-4/30/09; Post-GFC: 4/30/09-2/28/20; COVID-19 pandemic: 2/28/20-10/31/20. Current yield as of November 30, 2025.

Although headlines may cite tight corporate spreads, we see factors that may help sustain those levels in the coming year. We anticipate global growth will moderate but remain positive in 2026 and potentially reaccelerate in the second half of 2026. Corporate fundamentals appear solid, with profits expected to increase, while AI is promising transformative gains. We remain in the very early stages of AI adoption but the potential boost to U.S. productivity is significant. 


Global growth is expected to moderate but stay positive 

Bar chart comparing annual GDP growth estimates for 2025 and 2026 across four regions: U.S., Eurozone, China, and Japan. For the U.S., both years are at 1.8%. Eurozone sits at 1.3% in 2025 and 1.1% in 2026. China has the highest growth, with 4.9% in 2025 and 4.3% in 2026. Japan is lowest, at 1.1% in 2025 and 0.7% in 2026.

Sources: Capital Group, LSEG. As of 12/4/25. 

Still, U.S. growth could be challenged by political and economic uncertainty. U.S. tariff increases and the reordering of international trade continue to reverberate across the global economy. To date, companies appear to have largely avoided passing on costs to consumers through measures ranging from rerouting trade to drawing down inventories. But we anticipate the stagflationary impacts of these measures will become more evident as tariff policy crystalizes and firms increasingly look to pass a greater degree of costs through to consumers — weighing on corporate investment, labor markets and consumer spending.


A weaker labor market and uneven drivers for growth also pose risks for the U.S. economy. Job growth has slowed, and the economy remains vulnerable if layoffs accelerate. Consumer spending, which is increasingly driven by the high-income cohort, could falter amid rising unemployment or an equity market correction. Meanwhile, uncertainties persist around the sustainability of major drivers like AI-related spending.


The Fed faces a difficult balancing act as it enters 2026 amid these competing economic forces as well as the divisions between hawkish and dovish members of its policy-setting committee. After delivering a 25-basis-point (bps) cut in December’s meeting, the Fed has suggested that a series of rate cuts is not guaranteed as they monitor inflation pressures. Markets anticipate the fed funds rate will end 2026 around the 3.1% mark, down from its current range of 3.5% to 3.75%. While we see a case for that outcome, we’re watchful for factors like further deterioration in the labor market, political pressures or a reemergence of inflationary pressures that could knock that trajectory off course. 


Both the Fed and the market are projecting modest rate cuts in 2026

Chart showing the federal funds rate, with the actual figures listed from March 2022 to December 2025 and the market-implied effective rates from December 2025 to December 2027. The federal funds rate starts near 0 in March 2022 and increases in increments sized between 25 and 75 basis points until mid-2023, where it plateaus around 5.3% until late 2024, after which it begins reducing by 25 or 50 basis point increments until reaching about 3.6% in December 2025. The market implied effective rates show a gradual sloping reduction to about 3.1% in December 2026 and 3.15% in December 2027. The chart also shows the median Fed projections, as of 12/10/25, at 3.4% for December 2026 and 3.1% for December 2027.

Sources: Capital Group, Bloomberg, U.S. Federal Reserve. The fed funds target rate shown is the midpoint of the 50 basis point range the Federal Reserve aims for in setting its policy interest rate. Market-implied effective rates are a measure of what the fed funds rate could be in the future and are calculated using fed funds rate futures market data. Median Fed projections are based on the Summary of Economic Projections released by the Federal Open Market Committee on 12/10/25. 

Looking across the globe, economic growth may converge while monetary policy diverges. The Eurozone is expected to maintain modest growth though inflation pressures may rise, China is showing signs of stabilizing, Japan remains on the cusp of sustained reflation and emerging markets are providing a potential engine for global growth. There are potential rate hikes on the table for the European Union and Japan, while continued easing appears more likely in the U.K. and across select emerging markets.


Against this backdrop, portfolio managers remain cautious while taking advantage of sectors and issuers with relatively attractive valuations on a risk-adjusted basis. A steepening of the Treasury yield curve (an increase in the difference between long-term and short-term interest rates) remains a high conviction from a rates perspective. On the credit front, corporate fundamentals are solid and technicals are supportive, which may help sustain valuations. At the same time, spread compression across sectors and ratings cohorts present opportunities to move up in quality and reduce risk without sacrificing yield. 


A core conviction: Positioning for curve steepening


Fiscal policies, favorable risk-reward probabilities and attractive valuations suggest that the U.S. Treasury yield curve is more likely to steepen further rather than flatten. Convictions on this view are grounded in forces impacting each end of the curve. For shorter term bonds, yields may decline as labor markets soften further and the Fed adopts a more dovish stance, either in response to higher unemployment or due to a more dovish composition starting in 2026. For longer term bonds, yields may move higher amid fiscal deficit concerns and policy uncertainty that’s challenging the narrative of U.S. exceptionalism. Positioning portfolios in the event the yield curve should steepen may serve as a hedge if recessionary risks rise and the Fed needs to cut more aggressively than currently anticipated. 


In terms of implementation, we tend to favor higher exposure to short and intermediate maturities (2–5 years) and lower exposure to the long end (10+ years) relative to benchmarks. Although the curve has steepened in 2025, there is ample room for further steepening given current valuations compared to curve levels typically experienced over a cycle. The belly of the curve (5–10 years) appears particularly expensive. Investors have gravitated to this part of the curve’s higher yields and relatively more carry-friendly profile relative to the shorter end. 


The yield curve has room to steepen based on historical levels

Line chart showing the 2s10s yield curve from 2005 to 2025. The vertical axis represents percentage values ranging from negative 1.5% to 3.5%, and the horizontal axis shows years from 2005 to 2025. The yield curve starts near 1% in 2005, dips slightly negative, then rises sharply around 2008–2009 during a shaded recession period, peaking above 2.5%. After 2010, the curve gradually declines, crossing below 1% by 2018 and approaching zero by 2019. Another shaded recession period appears around 2020–2021, after which the curve falls steeply into negative territory near negative 1% in 2023 before recovering to around 0.5% by 2025. A dashed horizontal line labeled “Average” runs near the 1% level across the chart.

Source: Federal Reserve Bank of St. Louis via FRED. Data as of 12/3/25. The 2s10s yield curve represents the 10-year U.S. Treasury yield minus the 2-year U.S. Treasury yield. 

The key risk to this curve position is if inflation surprises significantly to the upside and stays elevated, especially if the labor market does not deteriorate further. In that scenario, Fed conversations would likely intensify around the margin for rate cuts relative to the neutral rate of interest, a theoretical rate at which the economy is neither stimulated nor restricted. The more hawkish Fed contingent, which argues that current policy rates are not far above the neutral rate, may be resistant to further cuts.


We expect 10-year Treasuries will trade in a range of about 3.75% to 4.50%, guided by factors including sustained economic growth, elevated fiscal deficits and a cautious Fed. While a sharp economic slowdown or a dramatic inflation spike could push rates outside their current range, neither scenario is our base case. Amid range bound rates, managers will continue to opportunistically add or reduce duration should it reach the outer bounds of the range while positioning for a steeper yield curve is more of a structural position intended to be held over the Fed cutting cycle. 


Opportunities in credit despite tight spreads 


The coming year may offer broad opportunity across spread sectors as potential rate cuts and sustained growth maintain a supportive backdrop. 


Yields are relatively attractive and dispersion reveals a breadth of opportunity across credit sectors

Bar chart comparing current yield, 15-year average yield and yield range across five bond categories: U.S. investment-grade corporates, U.S. high-yield corporates, commercial mortgage-backed securities, asset-backed securities and emerging markets debt. Current yields range from just around 4.1% to nearly 6.6%, with high-yield corporates offering the highest yield. In most cases, current yields are slightly higher than their long-term averages and sit within a broader band of yields as measured by the yield range.

Sources: Capital Group, Bloomberg, J.P. Morgan. Data as of 11/25/25. Yields shown are yield-to-worst. U.S. investment-grade corporates (BBB/Baa and above) is the Bloomberg U.S. Corporate Investment Grade Index. U.S. high-yield corporates is the Bloomberg U.S. Corporate High Yield 2% Issuer Capped Index. Commercial mortgage-backed securities is the Bloomberg CMBS ERISA-Eligible Index. ABS is the Bloomberg ABS Index. Emerging markets debt is the J.P. Morgan GBI-EM Global Diversified Index. Yield range represents the 5th to 95th percentile of yields in each sector, as of 11/25/25. 

Within U.S. corporate credit, resilient fundamentals and strong technicals have sent spreads over Treasuries to their lowest levels in decades. That backdrop may help spreads sustain their tight levels. That said, spreads have relatively limited room to tighten, but much more room to widen in a risk-off environment.


From a fundamental perspective, U.S. investment-grade corporates remain on solid footing. Annual earnings growth for the S&P 500 Index is estimated to rise to 14.2% next year from 11.4% in 2025, according to data from FactSet as of November 30, boding well for corporate health and profitability. From a technical lens, modest supply paired with strong investor demand has underpinned the market. Investment-grade corporate bond spreads have tightened to reach the lowest fifth percentile within the past two decades, even as average credit quality has drifted downward. Premiums to hold riskier debt within the universe have compressed as well, opening the door to a shift into higher quality debt without giving up much yield. Managers are finding opportunities in higher quality issuers within pharmaceuticals, utilities, tobacco, insurance and financials, including European banks.


The spread premium for holding riskier IG bonds has dropped

Line chart showing the difference in spreads between BBB-rated and A-rated corporate bonds from January 2010 to November 2025, measured in basis points. A solid line represents the spread difference, while a dashed line indicates the average difference of about 60 basis points. The spread fluctuates over time, with notable peaks around 2016, near 120 basis points, and early 2020 during the recession, above 140 basis points, followed by a sharp decline. After 2021, the difference trends downward, reaching roughly 40 basis points by mid-2024.

Source: Bloomberg. Data as of 11/28/25. Figures based on the BBB and A subsets of the Bloomberg U.S. Corporate Investment Grade Index. 

U.S. high-yield corporate fundamentals look relatively attractive as average credit quality has continued to improve over the last decade and default rates have remained relatively low at 3.3% as of October 2025. Balance sheet management and leverage levels remain generally in check. While spreads have tightened to the lowest decile over the past two decades, much of that historic data reflects a market that was less liquid and lower quality than today’s relatively liquid, BB-rated-heavy composition. Also, wider yield dispersion in high-yield corporates versus investment-grade corporates enhances security selection potential. Managers are maintaining a selective approach, favoring issuers within industries like media, cable, and satellite, where mergers and acquisitions are creating opportunities. 


High-yield credit quality has trended higher over the past decade

A line chart showing the percentage of the high-yield market that was rated BB/Ba from December 2015 through November 2025. The line begins around 45% in December 2015 and follows a jagged path that trends upward, peaking at 54% in November 2025.

Source: Bloomberg. As of 11/28/25. U.S. high yield represented by the Bloomberg U.S. Corporate High Yield 2% Issuer Capped Index.

Securitized credit remains an attractive area of the market, offering compelling relative value and diversification benefits. Agency mortgage-backed securities (agency MBS) remain somewhat attractive following recent tightening, particularly considering the carry profile and our view that a rangebound rate environment continues. Senior positions in credit risk transfer deals, a type of agency-issued MBS that carry some credit risk, and hybrid adjustable-rate mortgages are attractive. In areas such as commercial mortgage-backed securities, we prefer senior risk, primarily AAA-rated bonds where lower rates are aiding refinancing activity.


High-yielding investments can be found in other pockets of the securitized universe. Within asset-backed securities, seasoned subprime auto exposure — particularly older vintages that are more de-levered — offer incremental yield. Collateralized loan obligations, which are typically backed by pools of corporate loans, also stand out. Our analysts favor the higher rated A- to AA-rated tranches, which appear to offer compelling yields and sufficient protection.


Looking outside the U.S., emerging markets (EM) debt is benefiting from robust economies and central banks with flexibility to further ease policy. The most compelling opportunities lie in local currency bond markets, where attractive real yields, contained inflation and steep yield curves are creating opportunity. Duration exposure is particularly appealing in Latin American markets — especially Brazil, Colombia and Mexico — and select Asian economies, including India, Malaysia and the Philippines. In contrast, hard currency sovereigns offer limited protection against U.S. policy uncertainty or growth concerns. EM corporate credit appears expensive, warranting a highly selective approach.


Spread premiums for holding riskier debt have compressed, creating opportunity to move up in quality without sacrificing much yield. In core and core-plus portfolios, managers are generally favoring agency MBS and other high-quality securitized sectors over corporates on a relative value basis. Spread compression further reinforces the need for careful security selection and a conservative stance, maintaining flexibility to add risk opportunistically should spreads widen.


Within multisector and other credit-driven mandates, security selection is anticipated to be a major driver of alpha across corporate credit, securitized debt and emerging markets debt with a focus on avoiding issuers that could underperform should spreads widen. Yield dispersion within sectors provides opportunity to capture additional upside, particularly in high-yield and EM debt. 


Adaptability remains key


As we step into a new year, the bond market remains attractive as a source of returns with strong fundamentals. Sticky inflation, labor market weakness and evolving Fed policy will keep curve dynamics in sharp focus, with steepeners a core conviction. Elevated starting yields offer a strong foundation for returns, while credit markets demand a disciplined, selective approach amid tight spreads. Against this backdrop, adaptability will be key — positioning portfolios with a balanced approach to seeking carry and downside protection as monetary policy and global growth trends unfold.


Chitrang Purani is a fixed income portfolio manager with 21 years of investment industry experience (as of 12/31/2024). He holds an MBA from the University of Chicago and a bachelor's degree in finance from Northern Illinois University. He also holds the Chartered Financial Analyst® designation.

Damien McCann is a fixed income portfolio manager with 25 years of investment industry experience (as of 12/31/2024). He holds a bachelor’s degree in business administration with an emphasis on finance from California State University, Northridge. He also holds the Chartered Financial Analyst® designation.

Xavier Goss is a portfolio manager with 21 years of investment industry experience (as of 12/31/2024). He holds a bachelor's degree from Harvard. He also holds the Chartered Financial Analyst® designation.


Past results are not predictive of results in future periods.


There have been periods when the results lagged the index(es) and/or average(s). The indexes are unmanaged and, therefore, have no expenses. Investors cannot invest directly in an index.


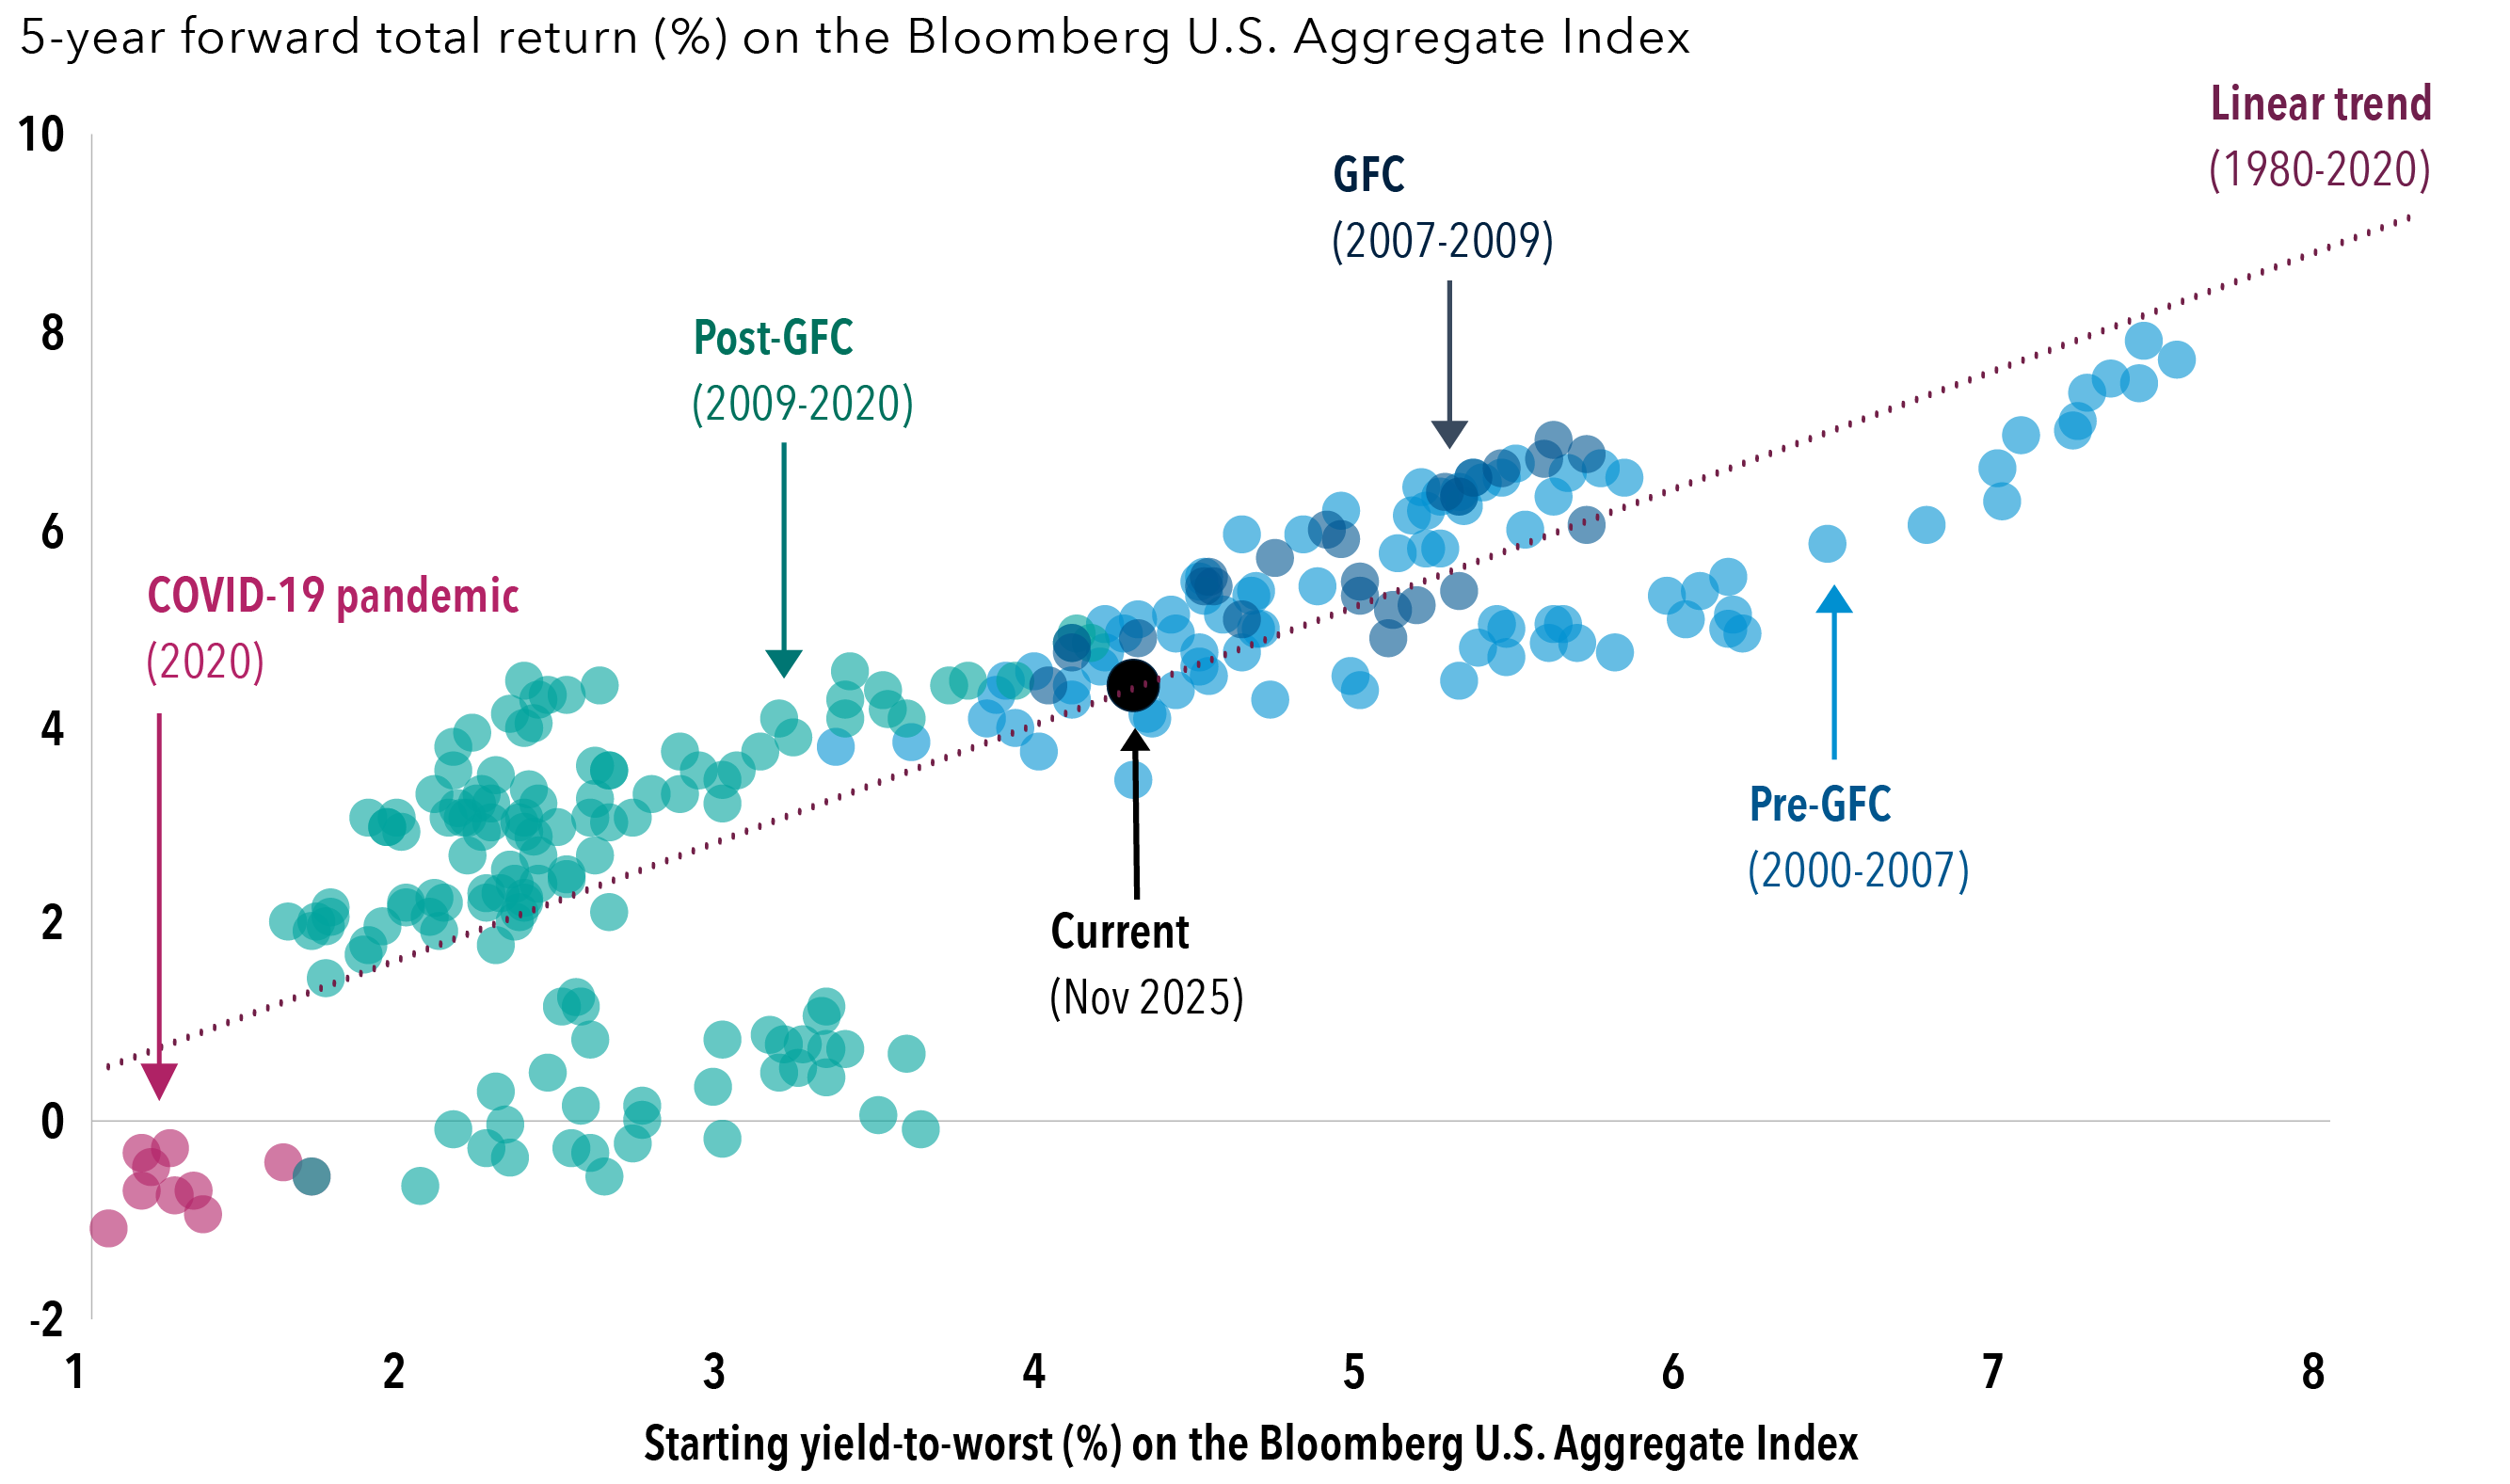
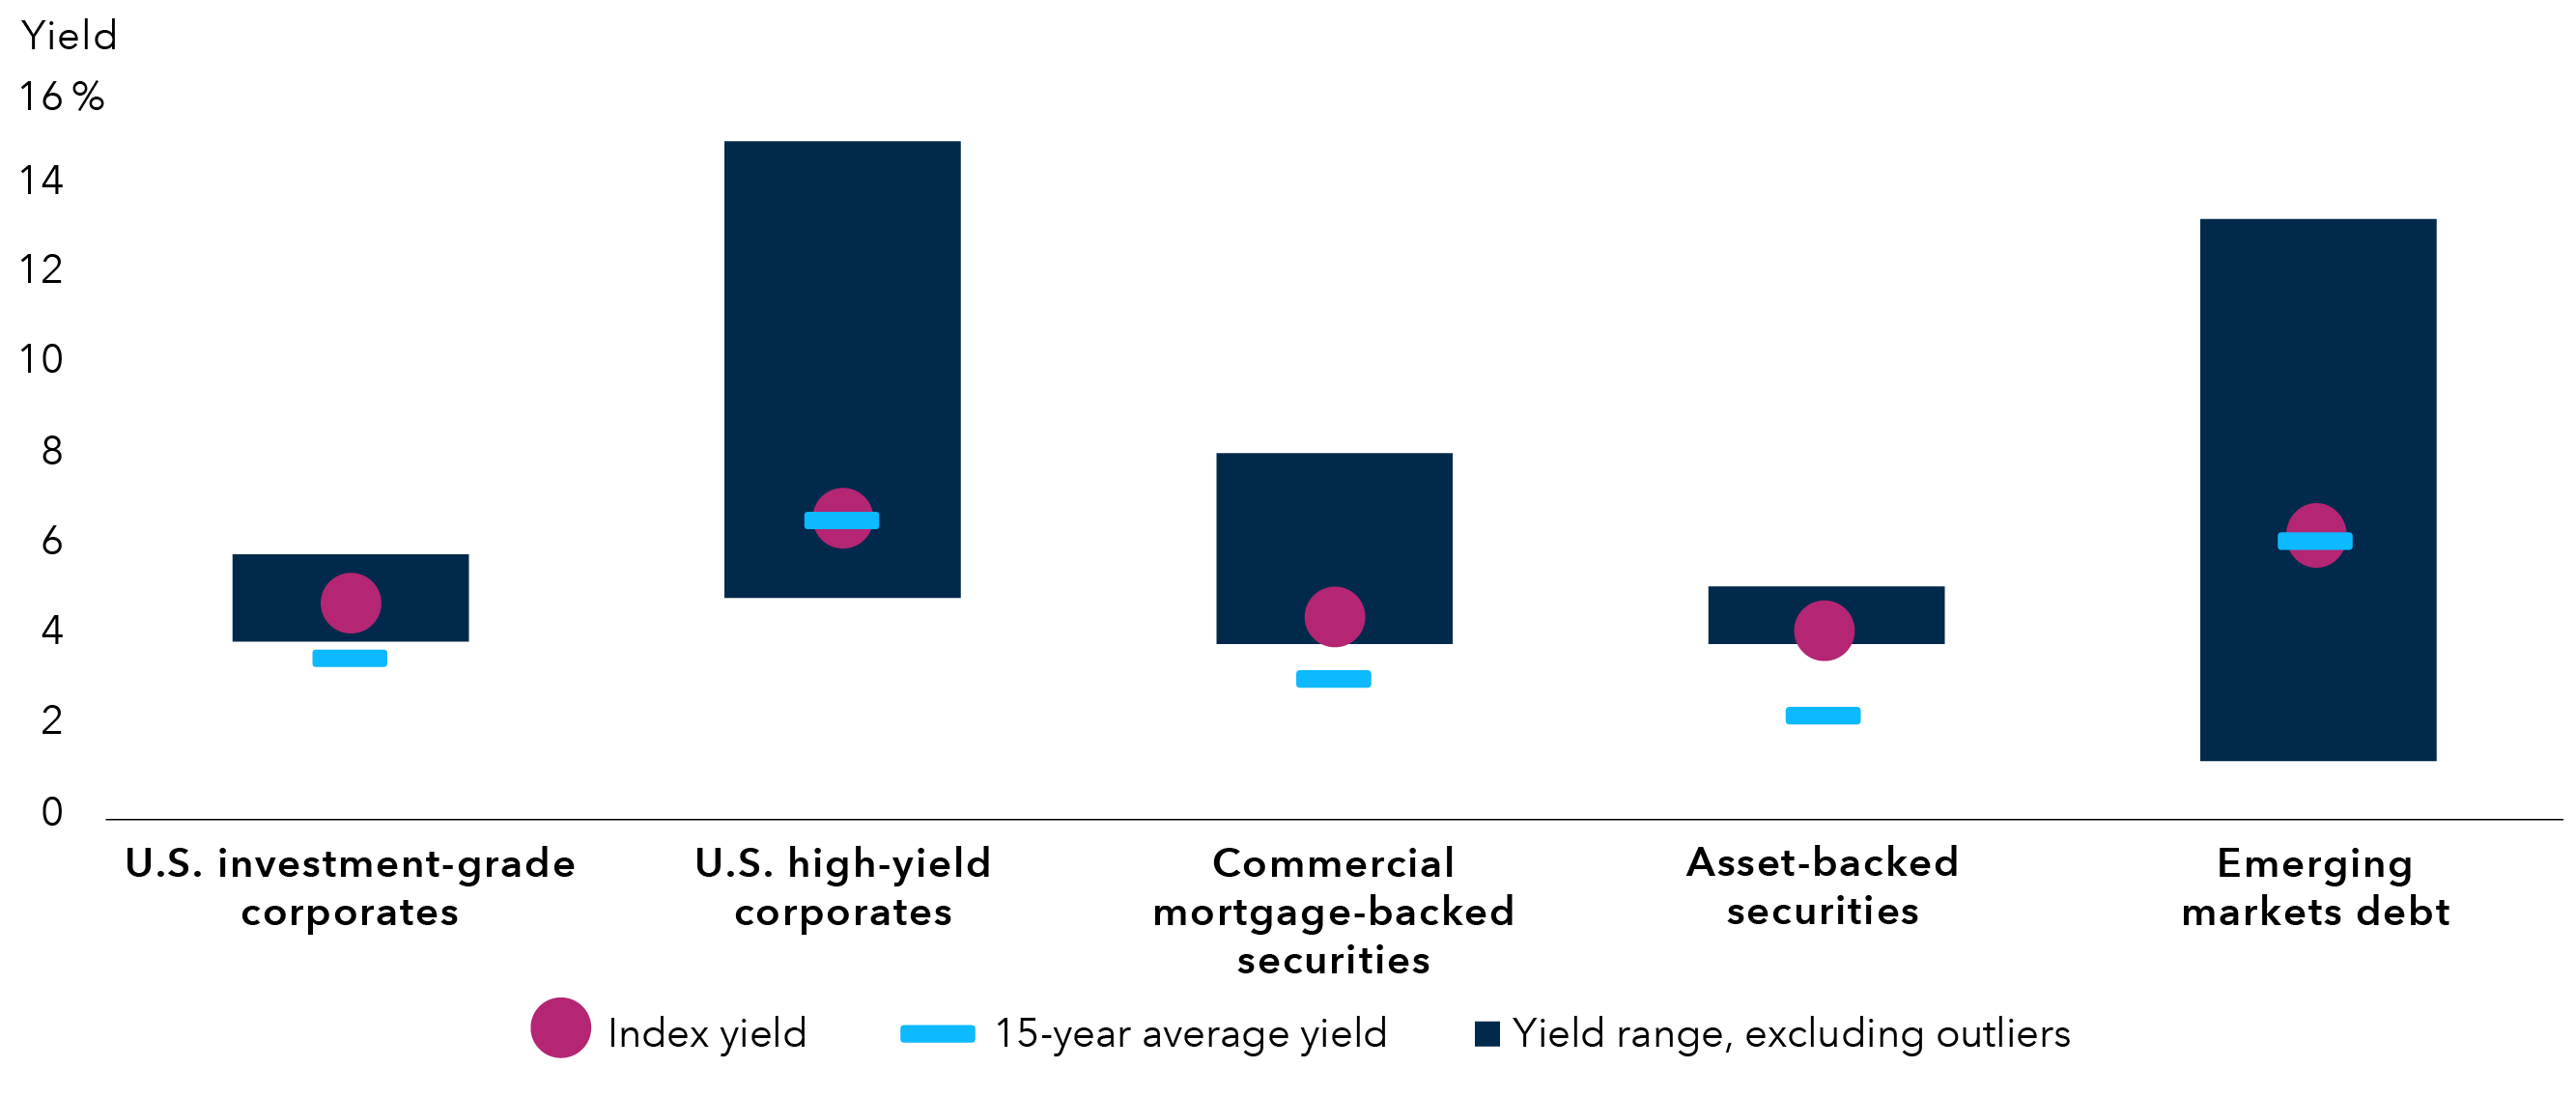
Bloomberg U.S. Aggregate Index represents the U.S. investment-grade fixed-rate bond market.


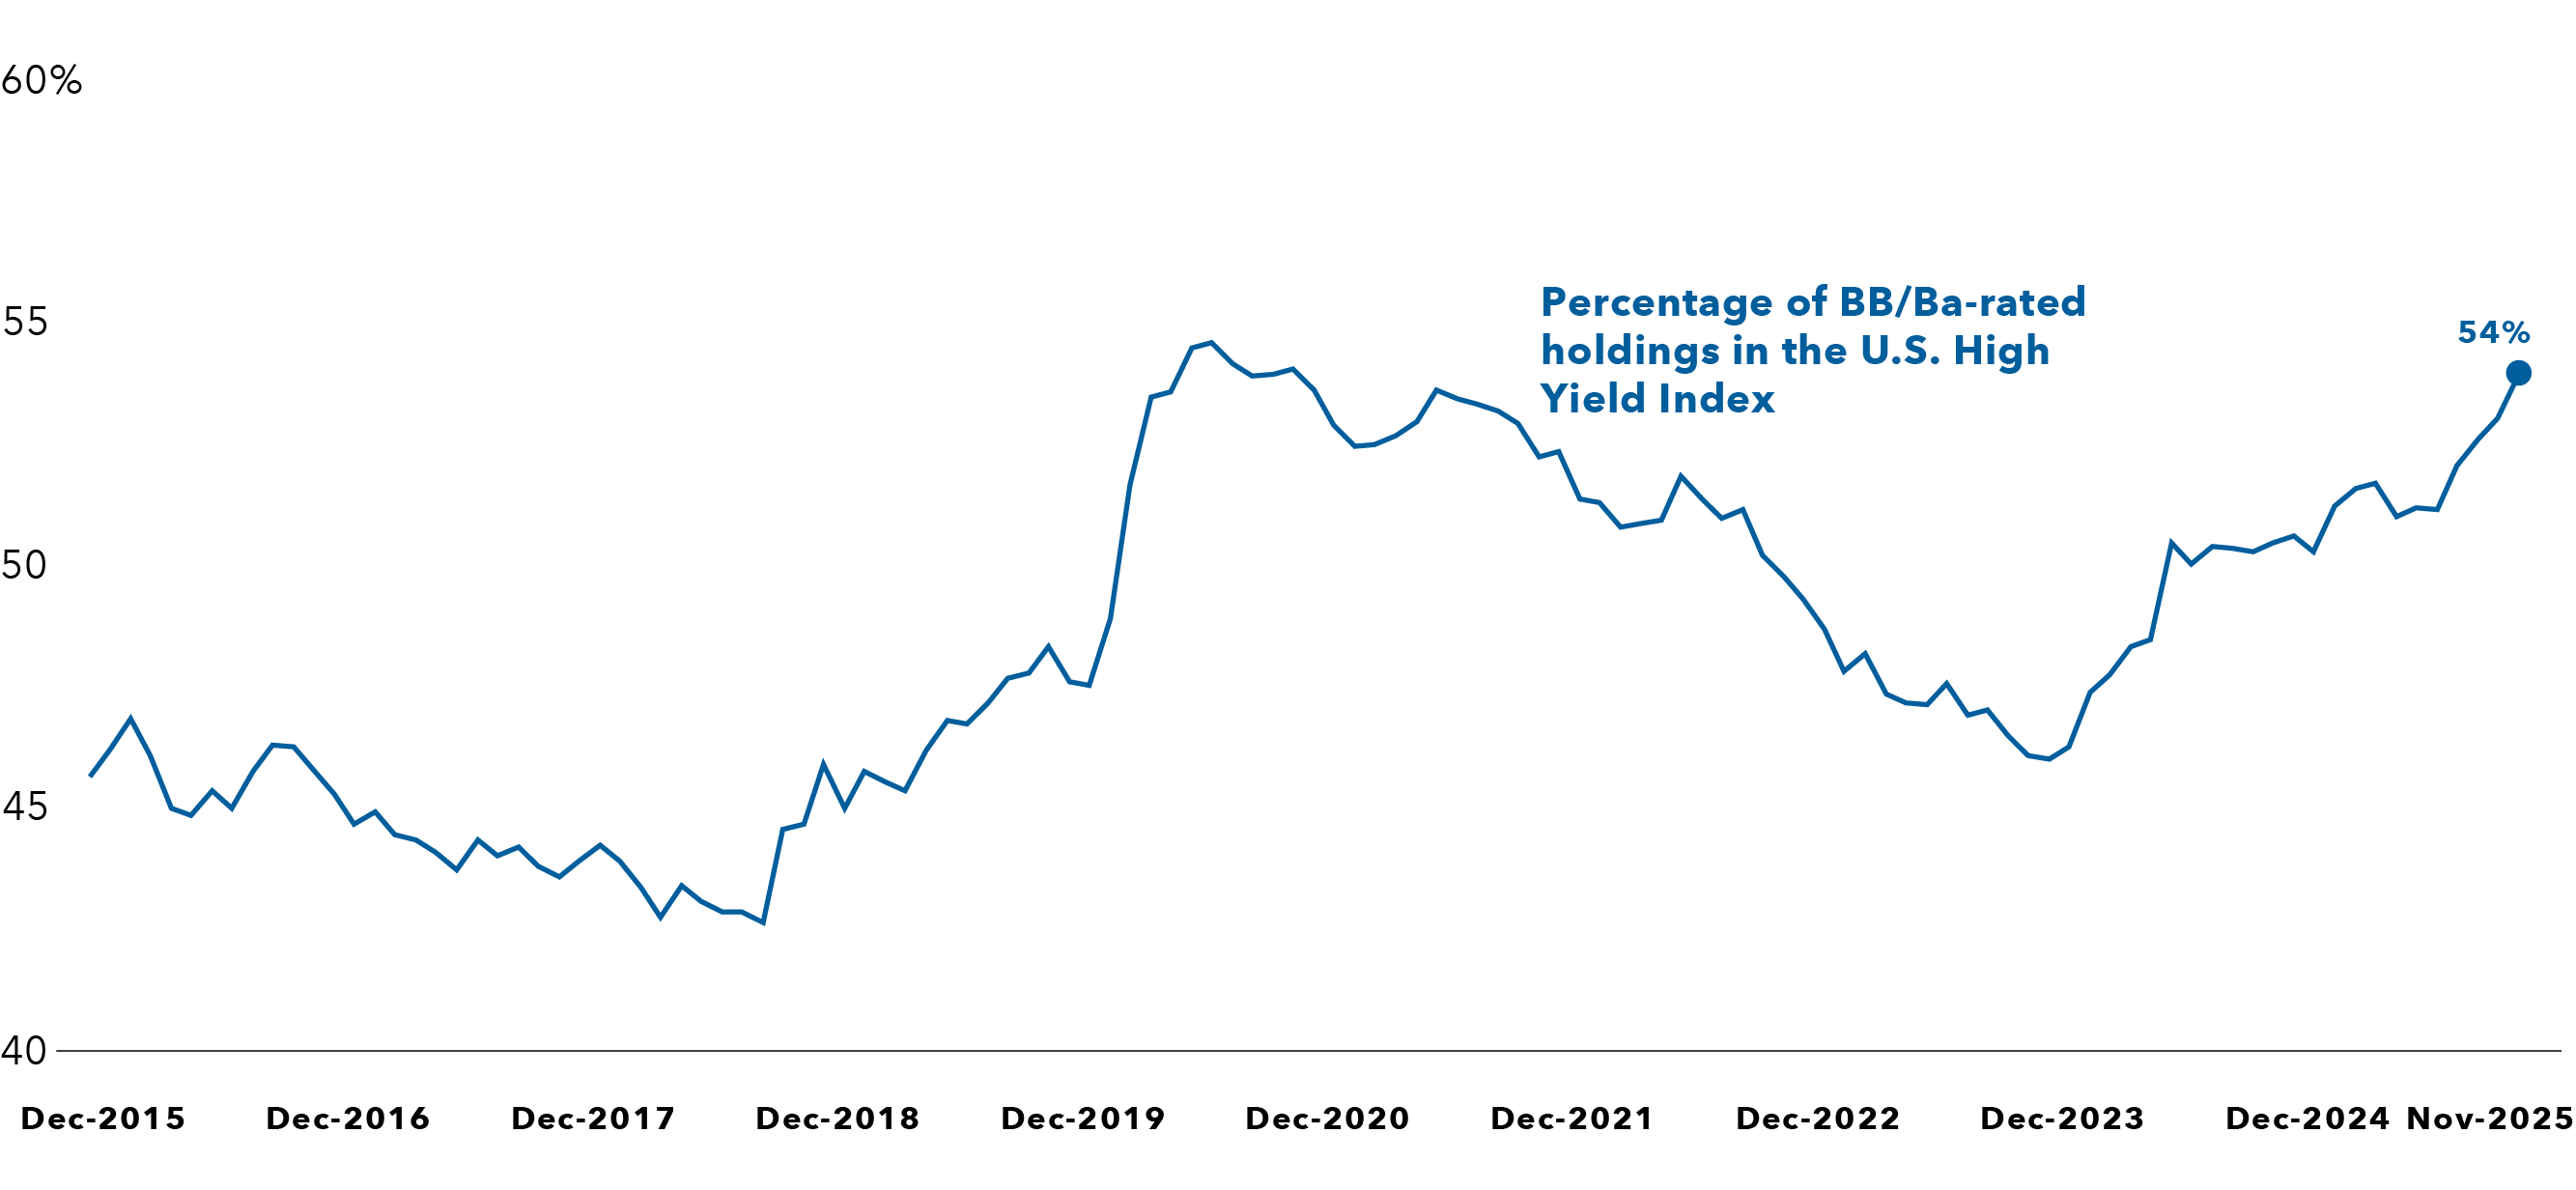
Bloomberg U.S. Corporate High Yield 2% Issuer Capped Index covers the universe of fixed-rate, non-investment-grade debt. The index limits the maximum exposure of any one issuer to 2%.


Bloomberg U.S. Corporate Investment Grade Index represents the universe of investment grade, publicly issued U.S. corporate and specified foreign debentures and secured notes that meet the specified maturity, liquidity and quality requirements.


Bloomberg CMBS Index represents the universe of U.S. commercial mortgage-backed securities. 


Bloomberg ABS Index represents the universe of U.S. asset-backed securities.  


JP Morgan Government Bond Index – Emerging Markets (GBI-EM) Global Diversified covers the universe of regularly traded, liquid fixed-rate, domestic currency emerging market government bonds to which international investors can gain exposure. 


S&P 500 Index is a market capitalization-weighted index based on the results of approximately 500 widely held common stocks.


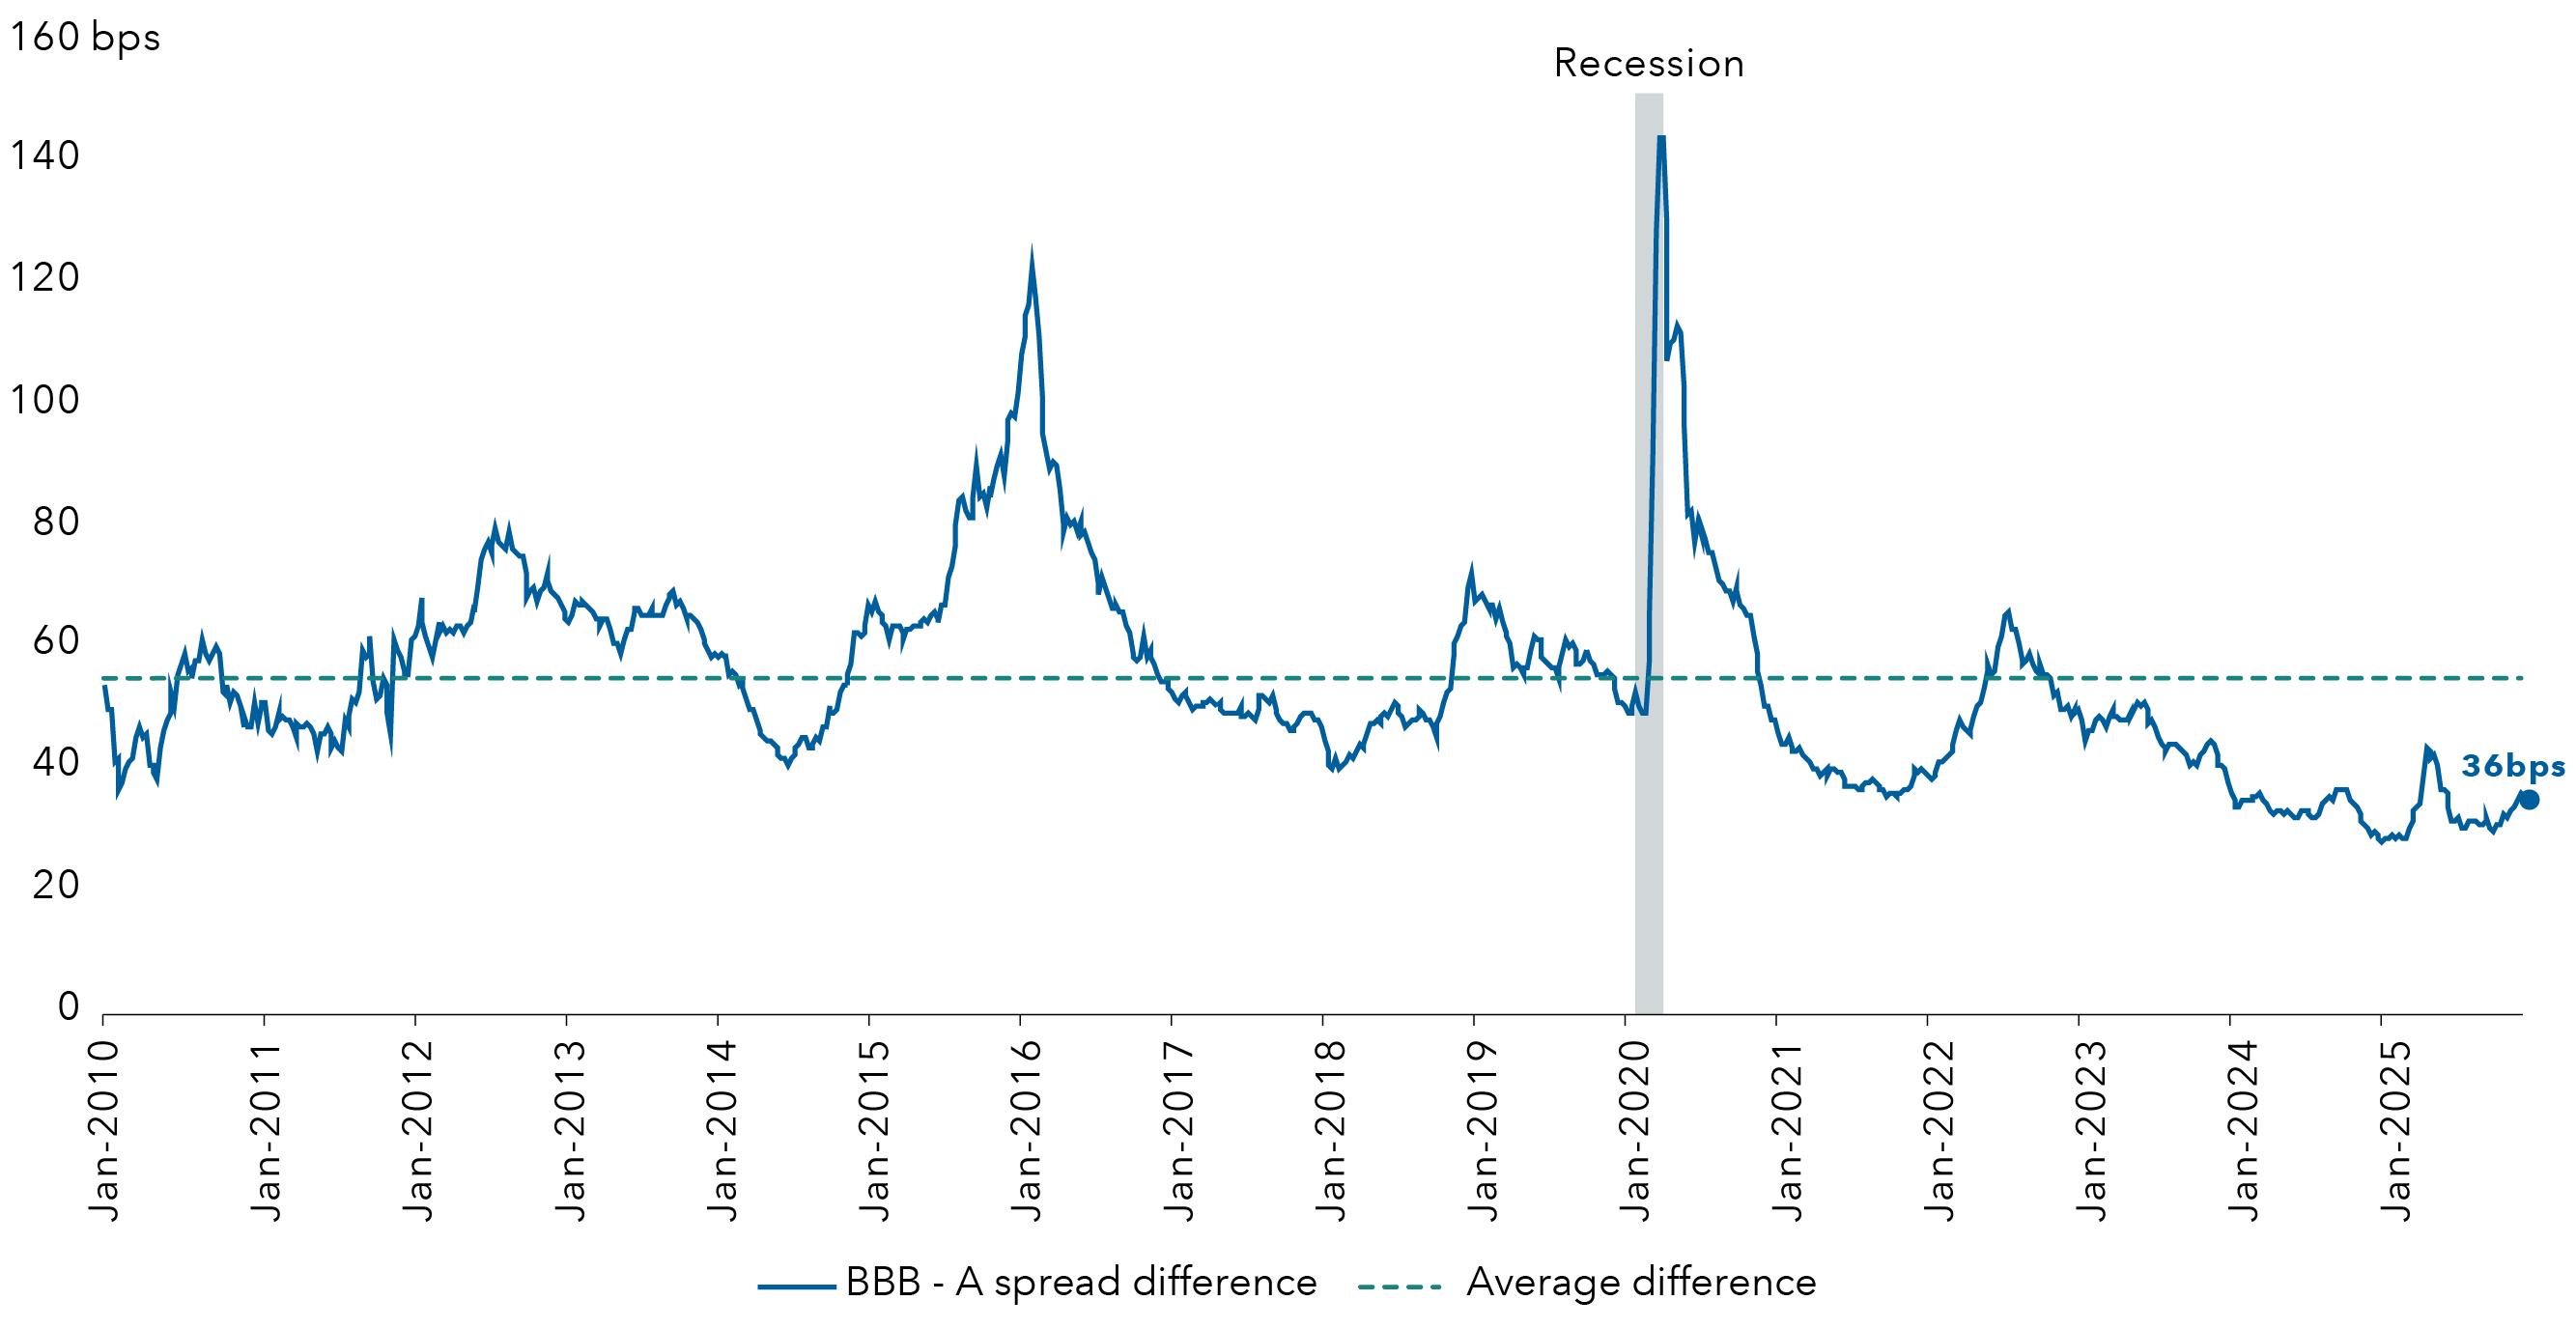
Bond ratings, which typically range from AAA/Aaa (highest) to D (lowest), are assigned by credit rating agencies such as Standard & Poor's, Moody's and/or Fitch, as an indication of an issuer's creditworthiness.


A spread over Treasuries is the difference between the yield of a bond and the yield of a similar maturity Treasury bond.


Duration measures a bond’s sensitivity to changes in interest rates. Generally speaking, a bond's price will go up 1% for every year of duration if interest rates fall by 1% or down 1% for every year of duration if interest rates rise by 1%.


Stagflation is an economic condition characterized by slowing economic growth, high unemployment and rising prices that occur simultaneously.


Carry refers to the income or cost from holding an investment.


Risk-off environment refers to a market environment where investors prioritize the preservation of capital over seeking higher returns, usually due to heightened economic concerns or uncertainty.


Alpha is a measure of an investment's performance that indicates its ability to generate returns in excess of its benchmark.

Never miss an insight

The Capital Ideas newsletter delivers weekly insights straight to your inbox.

Investments are not FDIC-insured, nor are they deposits of or guaranteed by a bank or any other entity, so they may lose value.
Investors should carefully consider investment objectives, risks, charges and expenses. This and other important information is contained in the prospectuses and summary prospectuses, which can be obtained from a financial professional and should be read carefully before investing.
There have been periods when the results lagged the index(es) and/or average(s). The indexes are unmanaged and, therefore, have no expenses. Investors cannot invest directly in an index.
This report, and any product, index or fund referred to herein, is not sponsored, endorsed or promoted in any way by J.P. Morgan or any of its affiliates who provide no warranties whatsoever, express or implied, and shall have no liability to any prospective investor, in connection with this report. J.P. Morgan disclaimer: https://www.jpmm.com/research/disclosures
Source: Bloomberg Index Services Limited. BLOOMBERG® is a trademark and service mark of Bloomberg Finance L.P. and its affiliates (collectively "Bloomberg"). Bloomberg or Bloomberg's licensors own all proprietary rights in the Bloomberg Indices. Neither Bloomberg nor Bloomberg's licensors approves or endorses this material, or guarantees the accuracy or completeness of any information herein, or makes any warranty, express or implied, as to the results to be obtained therefrom and, to the maximum extent allowed by law, neither shall have any liability or responsibility for injury or damages arising in connection therewith.
Each S&P Index ("Index") shown is a product of S&P Dow Jones Indices LLC and/or its affiliates and has been licensed for use by Capital Group. Copyright © 2025 S&P Dow Jones Indices LLC, a division of S&P Global, and/or its affiliates. All rights reserved. Redistribution or reproduction in whole or in part is prohibited without written permission of S&P Dow Jones Indices LLC.
Statements attributed to an individual represent the opinions of that individual as of the date published and do not necessarily reflect the opinions of Capital Group or its affiliates. This information is intended to highlight issues and should not be considered advice, an endorsement or a recommendation.
All Capital Group trademarks mentioned are owned by The Capital Group Companies, Inc., an affiliated company or fund. All other company and product names mentioned are the property of their respective companies.
Use of this website is intended for U.S. residents only.
Capital Client Group, Inc.
This content, developed by Capital Group, home of American Funds, should not be used as a primary basis for investment decisions and is not intended to serve as impartial investment or fiduciary advice.