Purchase Restrictions: Class R-6 shares are available in certain employer-sponsored retirement plans. See the prospectus for details.
Summary
Internal Prompt
A differentiated approach to core plus investing.
This fund seeks higher returns than core bond funds with generally low equity correlation. It aims to drive returns primarily through interest rate, yield curve and inflation positioning, generally resulting in liquid investments with high credit quality. Flexibility to invest in extended bond sectors on an opportunistic basis.
Price at NAV
$9.36
as of 12/26/2025 (updated daily)
Fund Assets (millions)
$20,820.1
Portfolio Managers
4
Expense Ratio
(Gross/Net %)
0.31 / 0.31%
(Gross/Net %)
Asset Mix
| U.S. Equities0.0% | |
| Non-U.S. Equities0.0% | |
| U.S. Bonds74.1% | |
| Non-U.S. Bonds12.3% | |
| Cash & Equivalents |
As of 11/30/2025
(updated monthly)
Returns
Internal Prompt
Growth of 10K
Read important investment disclosures
RANGX
Bloomberg U.S. Aggregate Index
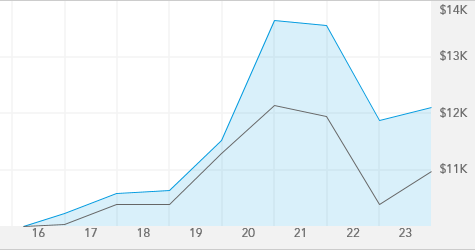
For Class R-6 Shares, this chart tracks a hypothetical investment with dividends reinvested, over the last 20 years, or since inception date if the fund has been in existence under 20 years, through 12/31/2024.
High & Low Prices
Ratings & Risk
Morningstar Rating TM
|
Overall Morningstar RatingTM
Funds rated(490)
|


|
|
3-yr. Morningstar RatingTM
(490 funds rated)
|
|
|
5-yr. Morningstar RatingTM
(450 funds rated)
|
|
|
10-yr. Morningstar RatingTM
(-- funds rated)
|
-- |
| Overall Morningstar Risk |
Above Average
HIGH
LOW
|
| Category | Intermediate Core-Plus Bond |
Ratings are based on risk-adjusted returns as of 11/30/2025 (updated monthly).
Lipper Leader Scorecard
| Overall Over-all | 3 yr. | 5 yr. | 10 yr. | |
|
Consistent Return Within Category Funds Rated |

|
|
|

|
|
Expense Within Category Funds Rated |

|
|
|
|
|
Preservation Within Category Funds Rated |
|
|
|
|
|
Tax Efficiency Within Category Funds Rated |
|
|

|
|
|
Total Return Within Category Funds Rated |
|
|
|
|
Category | Core Plus Bond Funds |
 KEY
KEY
HIGHEST

 LOWEST
LOWEST
As of 11/30/2025
(updated monthly)
%
of net assets as of 11/30/2025
(updated monthly)
Holdings
Bonds Breakdown
Bond Details
Total bond holdings
| Corporate bonds, notes & loans 31.5% | |
| Mortgage-backed obligations 31.0% | |
| U.S. Treasury bonds & notes 13.2% | |
| Non-U.S. government/agency securities 6.0% | |
| Asset-backed obligations 5.1% | |
| Revenue bonds 1.1% | |
| General obligation bonds 0.4% |
% of net assets as of 9/30/2025 (updated quarterly)
Top Fixed-Income Issuers
% of net assets as of 10/31/2025 (updated monthly)
Geographic Breakdown
%
of net assets as of 11/30/2025
(updated monthly)