CLIENT ACCOUNTS

Recently Viewed Accounts

You have no recently viewed accounts.

Select your location

  • Japan
  • International - other
  • Asia - other

Who are you ?

Select another location

Wer bist du ?

Wählen Sie einen anderen Ort

Qui êtes vous ?

Sélectionnez un autre emplacement

Qui êtes vous ?

Sélectionnez un autre emplacement

Who are you ?

Select another location

Qui êtes vous ?

Sélectionnez un autre emplacement

Wer bist du ?

Wählen Sie einen anderen Ort

Who are you ?

Select another location

Who are you ?

中國香港特別行政區

Who are you ?

Select another location

Wer bist du ?

Wählen Sie einen anderen Ort

Wer bist du ?

Wählen Sie einen anderen Ort

Qui êtes vous ?

Sélectionnez un autre emplacement

Who are you ?

Select another location

Wer bist du ?

Wählen Sie einen anderen Ort

Qui êtes vous ?

Sélectionnez un autre emplacement

Who are you ?

Select another location

Who are you ?

RETIREMENT PLAN INVESTOR

Use your plan ID (available on your account statement) to determine which employer-sponsored retirement plan website to use:

IF YOUR PLAN ID BEGINS WITH IRK, BRK, 754, 1 OR 2

Visit americanfunds.com/retire

IF YOUR PLAN ID BEGINS WITH 34 OR 135

Visit myretirement.americanfunds.com

Who are you ?

Select another location

Who are you ?

Select another location

Categories
Market Volatility
Guide to recessions: 9 things you need to know
Jared Franz
Economist
Darrell Spence
Economist

When is the next recession?


That's one of the questions we hear most often, especially following more than a year of aggressive interest rate hikes aimed at reining in inflation. Although a recession has seemed imminent for a while, the economic picture has become muddied as industries have weakened and recovered at different times. If we do see a broad contraction, our expectation is that it will be less severe than the 2008 global financial crisis and other more typical recessions, followed by a strong recovery.


To help you prepare for these uncertain times, we researched more than 70 years of data including the last 11 economic downturns to distill our top insights and answer key questions about recessions:


1. What is a recession?
2. What causes recessions?
3. How long do recessions last?
4. What happens to the stock market during a recession?
5. What economic indicators can warn of a recession?
6. Are we in a recession?
7. How can you position a stock portfolio for a recession?
8. How can you position a bond portfolio for a recession?
9. What are ways to prepare for a recession?
 

1. What is a recession?


A recession is commonly defined as at least two consecutive quarters of declining GDP (gross domestic product) after a period of growth, although that isn’t enough on its own. The National Bureau of Economic Research (NBER), which is responsible for business cycle dating, defines recessions as a “significant decline in economic activity spread across the economy, lasting more than a few months, normally visible in real GDP, real income, employment, industrial production and wholesale-retail sales.” In this guide, we will use NBER’s official dates.
 

2. What causes recessions?


Past recessions have occurred for many reasons, but typically are the result of economic imbalances that ultimately need to be corrected. For example, the 2008 recession was caused by excess debt in the housing market, while the 2001 contraction was caused by an asset bubble in technology stocks. An unexpected shock such as the COVID-19 pandemic, widespread enough to damage corporate profits and trigger job cuts, also can be responsible.


When unemployment rises, consumers typically reduce spending, which further pressures economic growth, company earnings and stock prices. These factors can fuel a vicious cycle that topples an economy. Although they can be painful to live through, recessions are a natural and necessary means of clearing out excesses before the next economic expansion. As Capital Group equity portfolio manager Rob Lovelace has noted, “You can’t have such a sustained period of growth without an occasional downturn to balance things out. It’s normal. It’s expected. It’s healthy.”


Go deeper:


Get the Guide to recessions


3. How long do recessions last?


The good news is that recessions generally haven’t lasted very long. Our analysis of 11 cycles since 1950 shows that recessions have persisted between two and 18 months, with the average spanning about 10 months. For those directly affected by job loss or business closures, that can feel like an eternity. But investors with a long-term investment horizon would be better served looking at the full picture.


Recessions are painful, but expansions have been powerful

The area chart shows cumulative GDP growth of all 12 expansions and 11 recessions since 1950. The expansions shown have a much higher magnitude and length compared to the recessions. Expansions ranged in duration from 12 months to 106 months. GDP growth during expansions ranged from 3% to 52%. The largest expansion lasted from 1961 to 1969 and had a 52% cumulative GDP growth. Recessions ranged from two months to 18 months. The steepest recession was in 2020 when GDP fell 10%. All other recessions had a GDP loss of less than 4%. A table shows that the average expansion lasts 69 months, has 24.6% GDP growth and adds 12 million net jobs. The average recession lasts 10 months, has 2.5% negative GDP growth and eliminates 3.9 million net jobs.

Sources: Capital Group, National Bureau of Economic Research (NBER), Refinitiv Datastream. Chart data is latest available as of 8/31/23 and shown on a logarithmic scale. The expansion that began in 2020 is still considered current as of 8/31/23 and is not included in the average expansion summary statistics. Since NBER announces recession start and end months, rather than exact dates, we have used month-end dates as a proxy for calculations of jobs added. Nearest quarter-end values used for GDP growth rates. Past results are not predictive of results in future periods.

Recessions have been relatively small blips in economic history. Over the last 70 years, the U.S. has been in an official recession less than 15% of all months. Moreover, their net economic impact has been relatively small. The average expansion increased economic output by almost 25%, whereas the average recession reduced GDP by 2.5%. Equity returns can even be positive over the full length of a contraction since some of the strongest stock rallies have occurred during the late stages of a recession.


Go deeper:


4. What happens to the stock market during a recession?


The exact timing of a recession is hard to predict, but it’s still wise to think about how one could affect your portfolio. Bear markets (market declines of 20% or more) and recessions have often overlapped — with equities leading the economic cycle by six to seven months on the way down and again on the way up.


Equities have typically peaked months before a recession, but can bounce back quickly

The chart shows two lines comparing the average S&P 500 Index market cycle and the average economic cycle (using industrial production as a proxy). The S&P 500 market cycle has peaked several months before the economic cycle, and it also has accelerated from its bottom several months before the economic cycle. The S&P 500 line moved from around 87 to 105 prior to a cycle peak. After a cycle peak it moved from a low of around 93 to a high of around 115. The industrial production line increased from a low of around 93 to a high of 100 at its peak. After its peak it declined to around 94 before increasing to around 99.

Sources: Capital Group, Federal Reserve Board, Haver Analytics, National Bureau of Economic Research, Standard & Poor's. Data reflects the average change in the S&P 500 Index and economic activity (using industrial production as a proxy) of all completed economic cycles from 1950 to 2022. The “cycle peak” refers to the highest level of economic activity in each cycle before the economy begins to contract. Both lines are indexed to 100 at each economic cycle peak and indexed to 0 “months before/after cycle peak” on the x-axis. A negative number (left of the cycle peak) reflects the average change in each line in the months leading up to the cycle peak. The positive numbers (right of the cycle peak) indicate the average changes after the cycle peak. Past results are not predictive of results in future periods.

Still, aggressive market-timing moves, such as shifting an entire portfolio into cash, can backfire. Some of the strongest returns may occur during the late stages of an economic cycle or immediately after a market bottom. A dollar cost averaging strategy, in which investors systematically invest equal amounts at regular intervals, may be beneficial in down markets. This approach allows investors to purchase more shares at lower prices while remaining positioned for when the market eventually rebounds.


Go deeper:


Webinar: Recession and recovery watch

CE credit available


5. What economic indicators can warn of a recession?


Wouldn’t it be great to know ahead of time when a recession is coming? Despite the impossibility of pinpointing the exact start, there are some generally reliable signals worth watching closely in a late-cycle economy.


The table shows five economic indicators that can warn of a recession, the average number of months between the signal and the start of a recession, and the current status of the indicator. Indicator 1 — An inverted yield curve, which occurs when 10-year U.S. Treasury yields fall below two-year U.S. Treasury yields. The average time between this signal and recession is 14.5 months. The threshold has been met. Indicator 2 — Unemployment rate rising from cycle trough. The average time between this signal and recession is 5.6 months. The threshold has not been met. Indicator 3 — Consumer confidence declining from the previous year. The average time between this signal and recession is 2.9 months. The threshold has not been met. Indicator 4 — Housing starts declining at least 10% from the previous year. The average time between this signal and a recession is 5.3 months. The threshold has been met. Indicator 5 — The Leading Economic Index (LEI) declining at least 1% from the previous year. The average time between this signal and a recession is 3.6 months. The threshold has been met.

Sources: Capital Group, Refinitiv Datastream. Reflects latest data available as of 8/31/22.

Many factors can contribute to a recession, and the main causes often change. Therefore, it’s helpful to look at different aspects of the economy to assess where imbalances may be building. Keep in mind that any indicator should be viewed more as a mile marker than a distance-to-destination sign.


Four examples of economic indicators that can warn of a recession include the yield curve, unemployment rate, consumer confidence and housing starts. Aggregated metrics, such as The Conference Board Leading Economic Index® (LEI), which combines 10 different economic and financial signals into a single analytic system to predict peaks and troughs, have also been consistently reliable over time.


These factors paint a mixed picture. Whereas the yield curve and LEI indicate that a broader recession could still be looming, a resilient consumer and robust labor market tell the opposite story. The housing industry has essentially already fallen into recession and may be on the verge of recovery, which could lift the entire economy. New economic data can quickly change the narrative though.


Go deeper:


6. Are we in a recession?


While at times it may have felt like we were already in one, we believe an official recession has yet to begin. Our base case remains that we will have a relatively short and mild recession, but the odds have increased that we won’t get one at all. Despite the impact that high inflation and rates have had on consumer sentiment and corporate earnings, the labor market has been surprisingly resilient and continues to support the economy.


The likelihood of a recession rose sharply in recent months

The chart shows a line tracking the New York Federal Reserve’s probability of a recession within 12 months since 1962, using monthly data. It also shows when past recessions occurred and the 30% threshold that has been reached before every recession. The probability of a recession has risen shortly before each of the eight recessions shown on the chart. Before the 1970 recession the probability peaked around 42%. Before the 1973 recession the probability peaked around 68%. Before the 1980 recession the probability peaked around 94%. Before the 1981 recession the probability peaked around 95%. Before the 1990 recession the probability peaked around 33%. Before the 2001 recession the probability peaked around 46%. Before the 2008 recession the probability peaked around 42%. Before the 2020 recession the probability peaked around 38%. The probability has been increasing in recent months. It peaked around 71% in May 2023, and was 66% in July 2023.

Sources: Federal Reserve Bank of New York, Refnitiv Datastream. As of 7/31/23. Shaded bars represent U.S. recessions as defined by the National Bureau of Economic Research.

Instead of an official recession, what we may see is a continuation of a rolling recession, where parts of the economy contract and recover at different times. Housing had a slowdown deeper than many past recessions and has started to bounce back. Likewise, the semiconductor industry has recovered strongly from a sharp contraction in 2022. If certain sectors continue to go up while others go down, it increases the possibility of avoiding a broad recession.


Of course, other factors could potentially darken the near-term outlook. A weakening labor market or geopolitical shock — such as an escalation of the war in Ukraine — could quicken the timeline for a U.S. recession.


Go deeper:


7. How can you position a stock portfolio for a recession?


We’ve already established that equities often do poorly during recessions but trying to time the market by selling stocks is not suggested. So should investors do nothing? Certainly not.


To prepare, investors should take the opportunity to review their overall asset allocations, which may have changed significantly during the bull market, to ensure their portfolios are balanced and diversified. Consulting a financial advisor can help immensely since these are often emotional decisions for investors.


Through 10 declines, some sectors have finished above the overall market

The chart shows how many times each of the sectors in the S&P 500 have outpaced the index during the last 10 largest market declines between 1987 and 2023. Consumer staples outpaced 10 times; utilities and health care outpaced nine times; telecommunication services outpaced eight times; energy outpaced five times; materials outpaced four times; consumer discretionary, financials and information technology each outpaced three times; and industrials outpaced twice. The chart also shows that the sectors that beat the market index during declines, on average, had higher dividend yields than those that usually lagged the index during declines. Dividend yields for each sector were as follows: consumer staples 2.5%, utilities 3.4%, health care 1.7%, telecommunication services 5.7%, energy 3.8%, materials 2.0%, consumer discretionary 0.9%, information technology 0.8%, financials 1.8%, industrials 1.6%.

*In September 2018, the telecommunication services sector was renamed communication services, and its company composition was materially changed. The dividend yield shown is for the telecommunication services industry group, a subset of the newly constructed communication services sector. The communication services sector’s dividend yield was 0.8% as of 8/31/23.

Sources: Capital Group, FactSet. Includes the last 10 periods that the S&P 500 Index declined by more than 15% on a total return basis. Sector returns for 1987 are equally weighted, using index constituents from 1989, the earliest available data set. The 2022 bear market is still considered current as of 8/31/23 and is included in this analysis. Dividend yields are as of 8/31/23.

Not all stocks respond the same during periods of economic stress. In the eight largest equity declines between 1987 and 2022, some sectors held up more consistently than others — usually those with higher dividends such as consumer staples and utilities. Dividends can offer steady return potential when stock prices are broadly declining.


Growth-oriented stocks can still have a place in portfolios, but investors may want to consider companies with strong balance sheets, consistent cash flows and long growth runways that can better withstand short-term volatility.


Even in a recession, many companies may remain profitable. Focus on companies with products and services that people will continue to use every day such as telecom, utilities and food manufacturers with pricing power.


Go deeper:


8. How can you position a bond portfolio for a recession?


Fixed income is often key to successful investing during a recession or bear market. That’s because bonds can provide a measure of stability and capital preservation, especially when equity markets are volatile.


The market selloff in 2022 was unique in that many bonds did not play their typical safe-haven role. But in the seven previous market corrections, bonds — as measured by the Bloomberg U.S. Aggregate Index — rose four times and never declined more than 1%.


High-quality bonds have shown resilience when stock markets are unsettled

The bar chart shows returns for both the Bloomberg U.S. Aggregate Index and the S&P 500 Index during 10 recent stock market corrections. The periods include the Flash Crash in 2010, the U.S. debt downgrade in 2011, the China slowdown in 2015, the oil price shock in 2015-2016, the U.S. inflation and rates scare in early 2018, the global selloff in late 2018, the COVID-19 pandemic in 2020, the Russian invasion of Ukraine in early 2022, peak inflation in mid-2022 and aggressive rate hikes in late 2022. In all periods the S&P 500 declined at least 10% and fell by as much as 33.8%. In these same periods, the Bloomberg Barclays U.S. Aggregate Index had returns ranging from a loss of 6.9% to a gain of 5.4%.

Sources: Bloomberg Index Services Ltd., RIMES, Standard & Poor’s. Dates shown for market corrections are based on price declines of 10% or more (without dividends reinvested) in the S&P 500 with at least 50% recovery persisting for more than one business day between declines. Includes all completed corrections between 1/1/10 and 8/31/23. Returns are based on total returns in USD. Past results are not predictive of results in future periods.

Achieving the right fixed income allocation is always important. But with the U.S. economy entering a period of uncertainty, it’s especially critical for investors to focus on core bond holdings that can help provide balance to their portfolios. Investors don’t necessarily need to increase their bond allocation ahead of a recession, but they should review their fixed income exposure with a financial professional to ensure it is positioned to provide diversification from equities, income, capital preservation and inflation protection — what we consider the four key roles fixed income can play in a well-diversified portfolio.


Go deeper:


9. What are ways to prepare for a recession?


Above all else, investors should stay calm when investing ahead of and during a recession. Emotions can be one of the biggest roadblocks to strong investment returns, and this is particularly true during periods of economic and market stress.


If you’ve picked up anything from reading this guide, it’s probably that determining the exact start or end date of a recession is not only difficult, but also not that critical. What is more important is to maintain a long-term perspective and make sure portfolios are appropriately balanced to benefit from periods of potential growth, while being resilient enough to minimize losses during periods of volatility.


Go deeper:


Jared Franz is an economist with 18 years of industry experience (as of 12/31/2023). He holds a PhD in economics from the University of Illinois at Chicago and a bachelor’s degree in mathematics from Northwestern University.

Darrell R. Spence covers the United States as an economist and has 31 years of industry experience (as of 12/31/2023). He holds a bachelor’s degree in economics from Occidental College. He also holds the Chartered Financial Analyst® designation and is a member of the National Association for Business Economics.


Regular investing does not ensure a profit or protect against loss. Investors should consider their willingness to keep investing when share prices are declining.
 

The market indexes are unmanaged and, therefore, have no expenses. Investors cannot invest directly in an index.
 

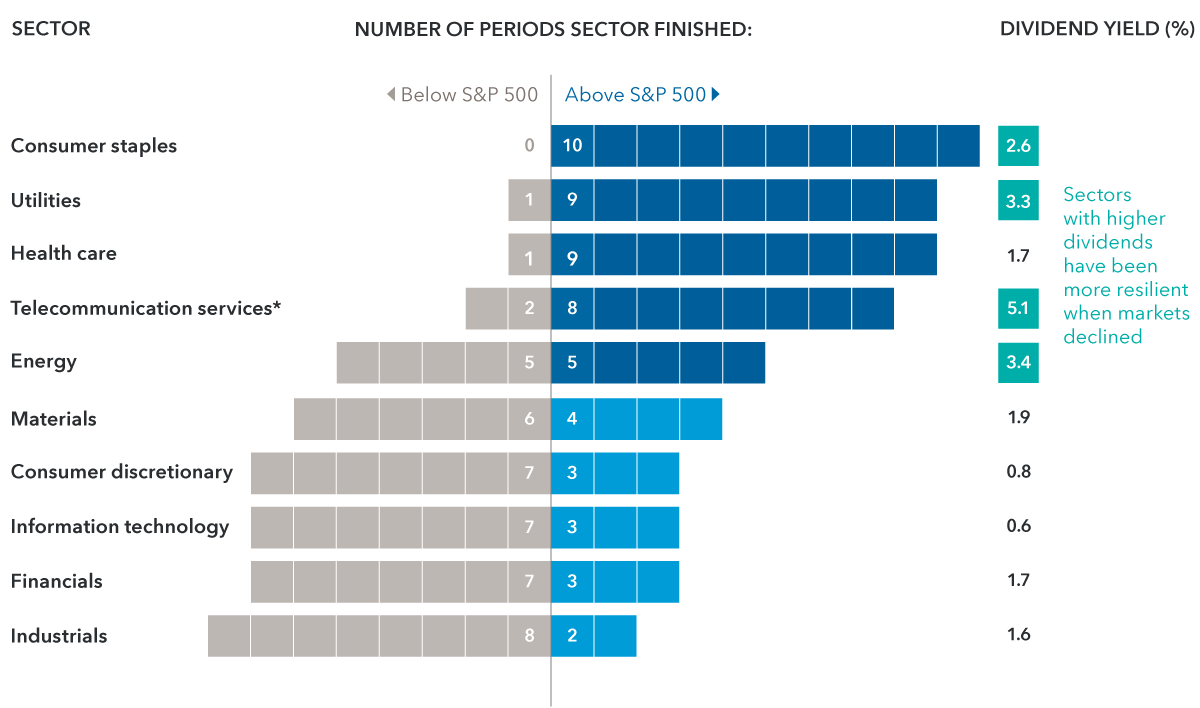
The S&P 500 Index is a market capitalization-weighted index based on the results of approximately 500 widely held common stocks. The S&P 500 is a product of S&P Dow Jones Indices LLC and/or its affiliates and has been licensed for use by Capital Group. Copyright © 2023 S&P Dow Jones Indices LLC, a division of S&P Global, and/or its affiliates. All rights reserved. Redistribution or reproduction in whole or in part are prohibited without written permission of S&P Dow Jones Indices LLC.
 

Bloomberg U.S. Aggregate Index represents the U.S. investment-grade (BBB/Baa and above) fixed-rate bond market. BLOOMBERG® is a trademark and service mark of Bloomberg Finance L.P. and its affiliates (collectively “Bloomberg”). Bloomberg or Bloomberg’s licensors own all proprietary rights in the Bloomberg Indices. Neither Bloomberg nor Bloomberg’s licensors approves or endorses this material, or guarantees the accuracy or completeness of any information herein, or makes any warranty, express or implied, as to the results to be obtained therefrom and, to the maximum extent allowed by law, neither shall have any liability or responsibility for injury or damages arising in connection therewith.
 

Bond ratings, which typically range from AAA/Aaa (highest) to D (lowest), are assigned by credit rating agencies such as Standard & Poor's, Moody's and/or Fitch, as an indication of an issuer's creditworthiness.

Our latest insights

Get the Guide to recessions

Never miss an insight

The Capital Ideas newsletter delivers weekly investment insights straight to your inbox.

Investments are not FDIC-insured, nor are they deposits of or guaranteed by a bank or any other entity, so they may lose value.

Investors should carefully consider investment objectives, risks, charges and expenses. This and other important information is contained in the fund prospectuses and summary prospectuses, which can be obtained from a financial professional and should be read carefully before investing.

Statements attributed to an individual represent the opinions of that individual as of the date published and do not necessarily reflect the opinions of Capital Group or its affiliates. This information is intended to highlight issues and should not be considered advice, an endorsement or a recommendation.

All Capital Group trademarks mentioned are owned by The Capital Group Companies, Inc., an affiliated company or fund. All other company and product names mentioned are the property of their respective companies.

Use of this website is intended for U.S. residents only. Use of this website and materials is also subject to approval by your home office.

American Funds Distributors, Inc.

This content, developed by Capital Group, home of American Funds, should not be used as a primary basis for investment decisions and is not intended to serve as impartial investment or fiduciary advice.