Global Equities
Categories
Target Date
Is passive truly the safer fiduciary choice for TDFs?
 Toni Brown, CFA
 John Doyle
October 20, 2020
KEY TAKEAWAYS
- Passive investments do not have inherently greater fiduciary protection than actively managed investments.
- Taking an active approach to target date selection can potentially lead to better economic outcomes for plan participants.
- Fees are an important — but not the only — consideration when selecting a target date fund provider. Plan sponsors should also evaluate a range of criteria.
Given the rapid acceptance of target date funds (TDFs) as the primary retirement investment strategy for U.S. workers, the choice of target date provider is now among the most important decisions for an investment committee.
The beauty of a TDF is its simplicity for participants. However, its underlying complexity can challenge committees tasked with assessing a TDF’s glide path design, risk/return profile and fee structure as part of fiduciary due diligence.
One of the considerations is whether the TDF should be actively or passively managed. In either case, appropriate due diligence must be conducted. When selecting a TDF provider, sponsors should remember:
- Passive management does not provide inherent fiduciary protection.
- Active management may lead to better participant outcomes.
Passive management does not provide fiduciary protection
Fiduciaries sometimes view passive strategies as “safer” choices out of concern over fees. Fees are an important consideration in the selection of a TDF provider but not the only one. What ultimately matters are economic outcomes for participants.
As such, fiduciaries should analyze how a target date series is structured to deliver the best value for participants. Some factors to consider include:
- The glide path design
- The ability to manage risk
- The potential to deliver above-average returns
No target date fund is completely passively managed
All target date providers make active asset allocation decisions when creating the glide path. This has a big impact on risk and return.
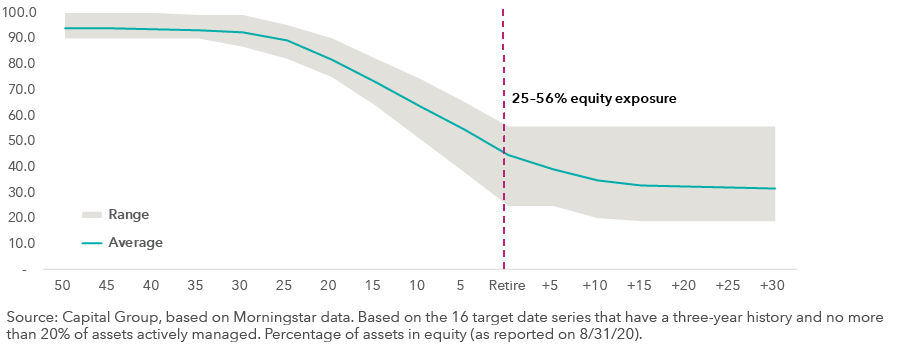
The chart below shows how TDFs composed of mostly passive underlying funds have a wide range of equity exposures at age 65, the age at which a participant is assumed to retire and begin taking withdrawals. Note the equity allocation at retirement ranges between 25% and 56%. Because asset allocation can drive results, fiduciaries should review the change in allocations along the glide path as the fund moves closer to its target date.
Equity exposure can vary widely in passive TDFs
Five questions for evaluating target date funds
- How is the glide path constructed?
Analyze how equity and fixed income work together along the glide path. - What are the needs of participants?
Balance the need for growth with the desire for volatility control relative to plan demographics. - What underlying funds are used in the series?
Review the long-term results of the underlying funds through market cycles. - What types of risk does the target date series exhibit?
Review key risk characteristics such as market, longevity, interest rate and sub-asset class risk. - How much do participants pay for the funds?
Determine the value received for the fees charged.
Active management may lead to better outcomes
Passive funds are based on indexes, which can become imbalanced. Consider:
- On 12/31/89, Japan (P/E: 51.9) was 59.8% of the MSCI EAFE (Europe, Australasia, Far East) Index.
- On 3/31/00, Information Technology (P/E: 63.1) was 32.2% of the S&P 500 Index.
Active equity funds can help mitigate the risk of asset bubbles by pursuing more defensive strategies in times of market stress.
Active bond managers can adjust with the market
Bond funds that are selective in their investment decisions can potentially take index-differing positions in sector exposure, credit quality, yield and duration to avoid, for example, style drift.
The share of the Bloomberg Barclays U.S. Aggregate Index in U.S. Treasuries has increased significantly, rising from 25% in December 2008 to 37% in August 2020. Active bond managers can also adjust duration in anticipation of changes in interest rates.
Two screens may help identify strong underlying funds
Our research reveals active funds sharing two key traits generally have strong results. These include:
- High manager ownership
- Low fees
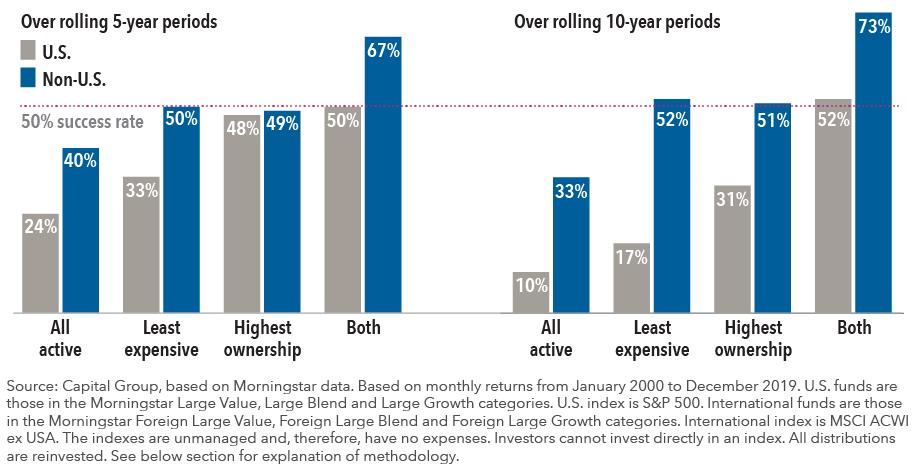
Over the last 20 years, at least half of the actively managed U.S. and non-U.S. large-cap equity funds ranked in the best quartile of expense ratio and manager ownership outpaced their respective indexes over rolling five- and 10-year periods.
Select equity funds meeting two criteria have mostly beaten indexes
Percentage of rolling periods in which groups of actively managed large-cap funds outpaced indexes, net of fees
Conclusion
Choosing a passive TDF provider does not offer inherent fiduciary protection. Sponsors should also consider factors such as the glide path, investment process and the value participants receive for the fees charged.
Taking an active approach to target date selection can help sponsors meet their fiduciary responsibilities while facilitating sound and productive retirement savings for their workers.
Learn more about
S&P 500 Index is a market capitalization-weighted index based on the results of approximately 500 widely held common stocks. MSCI All Country World ex USA Index is a free float-adjusted market-capitalization weighted index that is designed to measure equity market results in the global developed and emerging markets, excluding the United States. The index consists of more than 40 developed and emerging market country indexes. The market indexes are unmanaged and, therefore, have no expenses. Investors cannot invest directly in an index. Past results are not predictive of results in future periods.
Least expensive quartile was calculated using annual report net expense ratio (NER) for all observed Morningstar categories for the 20-year period indicated. For funds with missing expense ratios, gaps between two available data points were filled in using linear interpolation. Linear interpolation is a statistical method used to estimate the values between two known data points in a time series. Highest manager ownership quartile was calculated using weighted averages of Morningstar screens of manager holdings at the firm level. Each fund was assigned the weighted average of its firm manager holding. Funds without values were excluded from the quartile rankings. The combination of least expensive NER and highest manager ownership quartiles was the result of a cross-section of the two screens. Only those funds with both the lowest expense ratios and the highest manager ownership were included.
The database built to represent the universe of both large-cap domestic and large-cap foreign funds drew from Morningstar's U.S. Open-End Large Value, Large Blend and Large Growth U.S. and Foreign categories, with live and dead funds combined to eliminate survivorship bias. For live funds, only the oldest share class was used. The oldest share class designation used in the screening process does not reflect the recent Morningstar methodology change for funds incepted prior to 12/31/2015, as it is based on a previously existing database of Morningstar fund identifiers. Funds incepted after that date are identified with Morningstar’s new methodology. For dead funds with multiple share classes, the median monthly returns were used. If a sales charge had been deducted, results would have been lower. For fee-related illustrations that include dead funds with multiple share classes, the median expense ratios were used. We searched Morningstar’s database for large-cap actively managed funds that were in both the lowest quartile ranked by expense ratio and the highest quartile ranked by manager ownership at the firm level. Past results are not predictive of results in future periods.
Morningstar data ©2020 Morningstar, Inc. All rights reserved. The information contained herein: (1) is proprietary to Morningstar and/or its content providers; (2) may not be copied or distributed; and (3) is not warranted to be accurate, complete or timely. Neither Morningstar nor its content providers are responsible for any damages or losses arising from any use of this information. Past performance is no guarantee of future results.
Our latest insights
-
-
Economic Indicators
-
-
Demographics & Culture
-
RELATED INSIGHTS
Never miss an insight
The Capital Ideas newsletter delivers weekly insights straight to your inbox.
Investments are not FDIC-insured, nor are they deposits of or guaranteed by a bank or any other entity, so they may lose value.
Investors should carefully consider investment objectives, risks, charges and expenses.
This and other important information is contained in the prospectuses and summary prospectuses, which can be obtained from a financial professional and should be read carefully before investing.
Statements attributed to an individual represent the opinions of that individual as of the date published and do not necessarily reflect the opinions of Capital Group or its affiliates. This information is intended to highlight issues and should not be considered advice, an endorsement or a recommendation.
All Capital Group trademarks mentioned are owned by The Capital Group Companies, Inc., an affiliated company or fund. All other company and product names mentioned are the property of their respective companies.
Use of this website is intended for U.S. residents only.
Capital Client Group, Inc.
This content, developed by Capital Group, home of American Funds, should not be used as a primary basis for investment decisions and is not intended to serve as impartial investment or fiduciary advice.
Statements attributed to an individual represent the opinions of that individual as of the date published and do not necessarily reflect the opinions of Capital Group or its affiliates. This information is intended to highlight issues and should not be considered advice, an endorsement or a recommendation.