In early 2025, municipal bonds hit a bump. The typically steady fixed income sector delivered positive results, but notably lagged its taxable counterparts, creating one of the most unusual environments in recent memory.
While a second-half rally in long-dated munis hinted at recovery, returns through November for the Bloomberg Municipal Bond Index still trailed the Bloomberg U.S. Aggregate Bond Index by over 3%. This marks one of the largest benchmark deviations in years and presents a compelling opportunity for investors seeking tax-efficient income.
Several technical and structural factors contributed to this divergence. Early in the year, muni issuance surged more than 16% compared to the same period last year as issuers faced rising project costs and accelerated new deals. Lower prices were needed to clear that supply, leading to weaker total returns than comparable taxable bonds. Perceived political risk was also a factor, from uncertainty around the impact of tariffs to fears that new leadership in Washington could threaten the municipal bond federal tax exemption.
These and other factors have led to a steeper muni curve relative to the Treasury curve. This underscores the valuation gap and signals potential for a catch-up phase. Historically, such wide gaps have often preceded strong results as fundamentals reassert themselves.
The muni yield curve has steepened relative to the U.S. Treasury curve
Sources: Capital Group, Bloomberg as of 11/30/25. U.S. Treasury represented by Bloomberg U.S. Treasury Index. Muni AAA Curve represented by BVAL (Bloomberg Valuation Service) Municipal AAA Yield Curve (Callable).
The muni market provided some green shoots in the second half of 2025. October saw municipal bonds post their second-best monthly result of the year and their strongest October since 1995. Over the full year to date through November, issuance reached $535 billion — a nearly 12% increase year over year. This uptick in supply was met with more robust demand, as muni fund flows remained positive for the month, totaling about $56 billion through November year-to-date, amounting to $7.6 billion more than the same period in 2024. The combination of manageable supply and strong investor inflows helped absorb new issuance and supported the market’s ongoing normalization. Investor interest was driven by waning political risk, elevated absolute yields and anticipation of further rate cuts amid moderate supply.
This momentum in flows, alongside the technical backdrop, reinforces the case for munis to potentially outpace taxable fixed income sectors in the months ahead. Seasonal demand and reinvestment flows are expected to exceed new issuance in the second half of the year — potentially accelerating normalization.
Major benchmark deviations like those seen this year have often preceded strong results — 2010, 2013, 2016, 2019 and 2020 all saw robust muni rallies after similar dislocations. The current gap, which began in early 2025, ranks among the widest in decades — signals considerable catch-up potential if past patterns hold.
After challenging years, munis have bounced back
Sources: Capital Group, Bloomberg, Morningstar. As of November 30, 2025. Data reflect the last five calendar years when the Bloomberg U.S. Aggregate Index outpaced the Bloomberg Municipal Bond Index and the municipal bond index’s excess return over the aggregate index in the following two years.
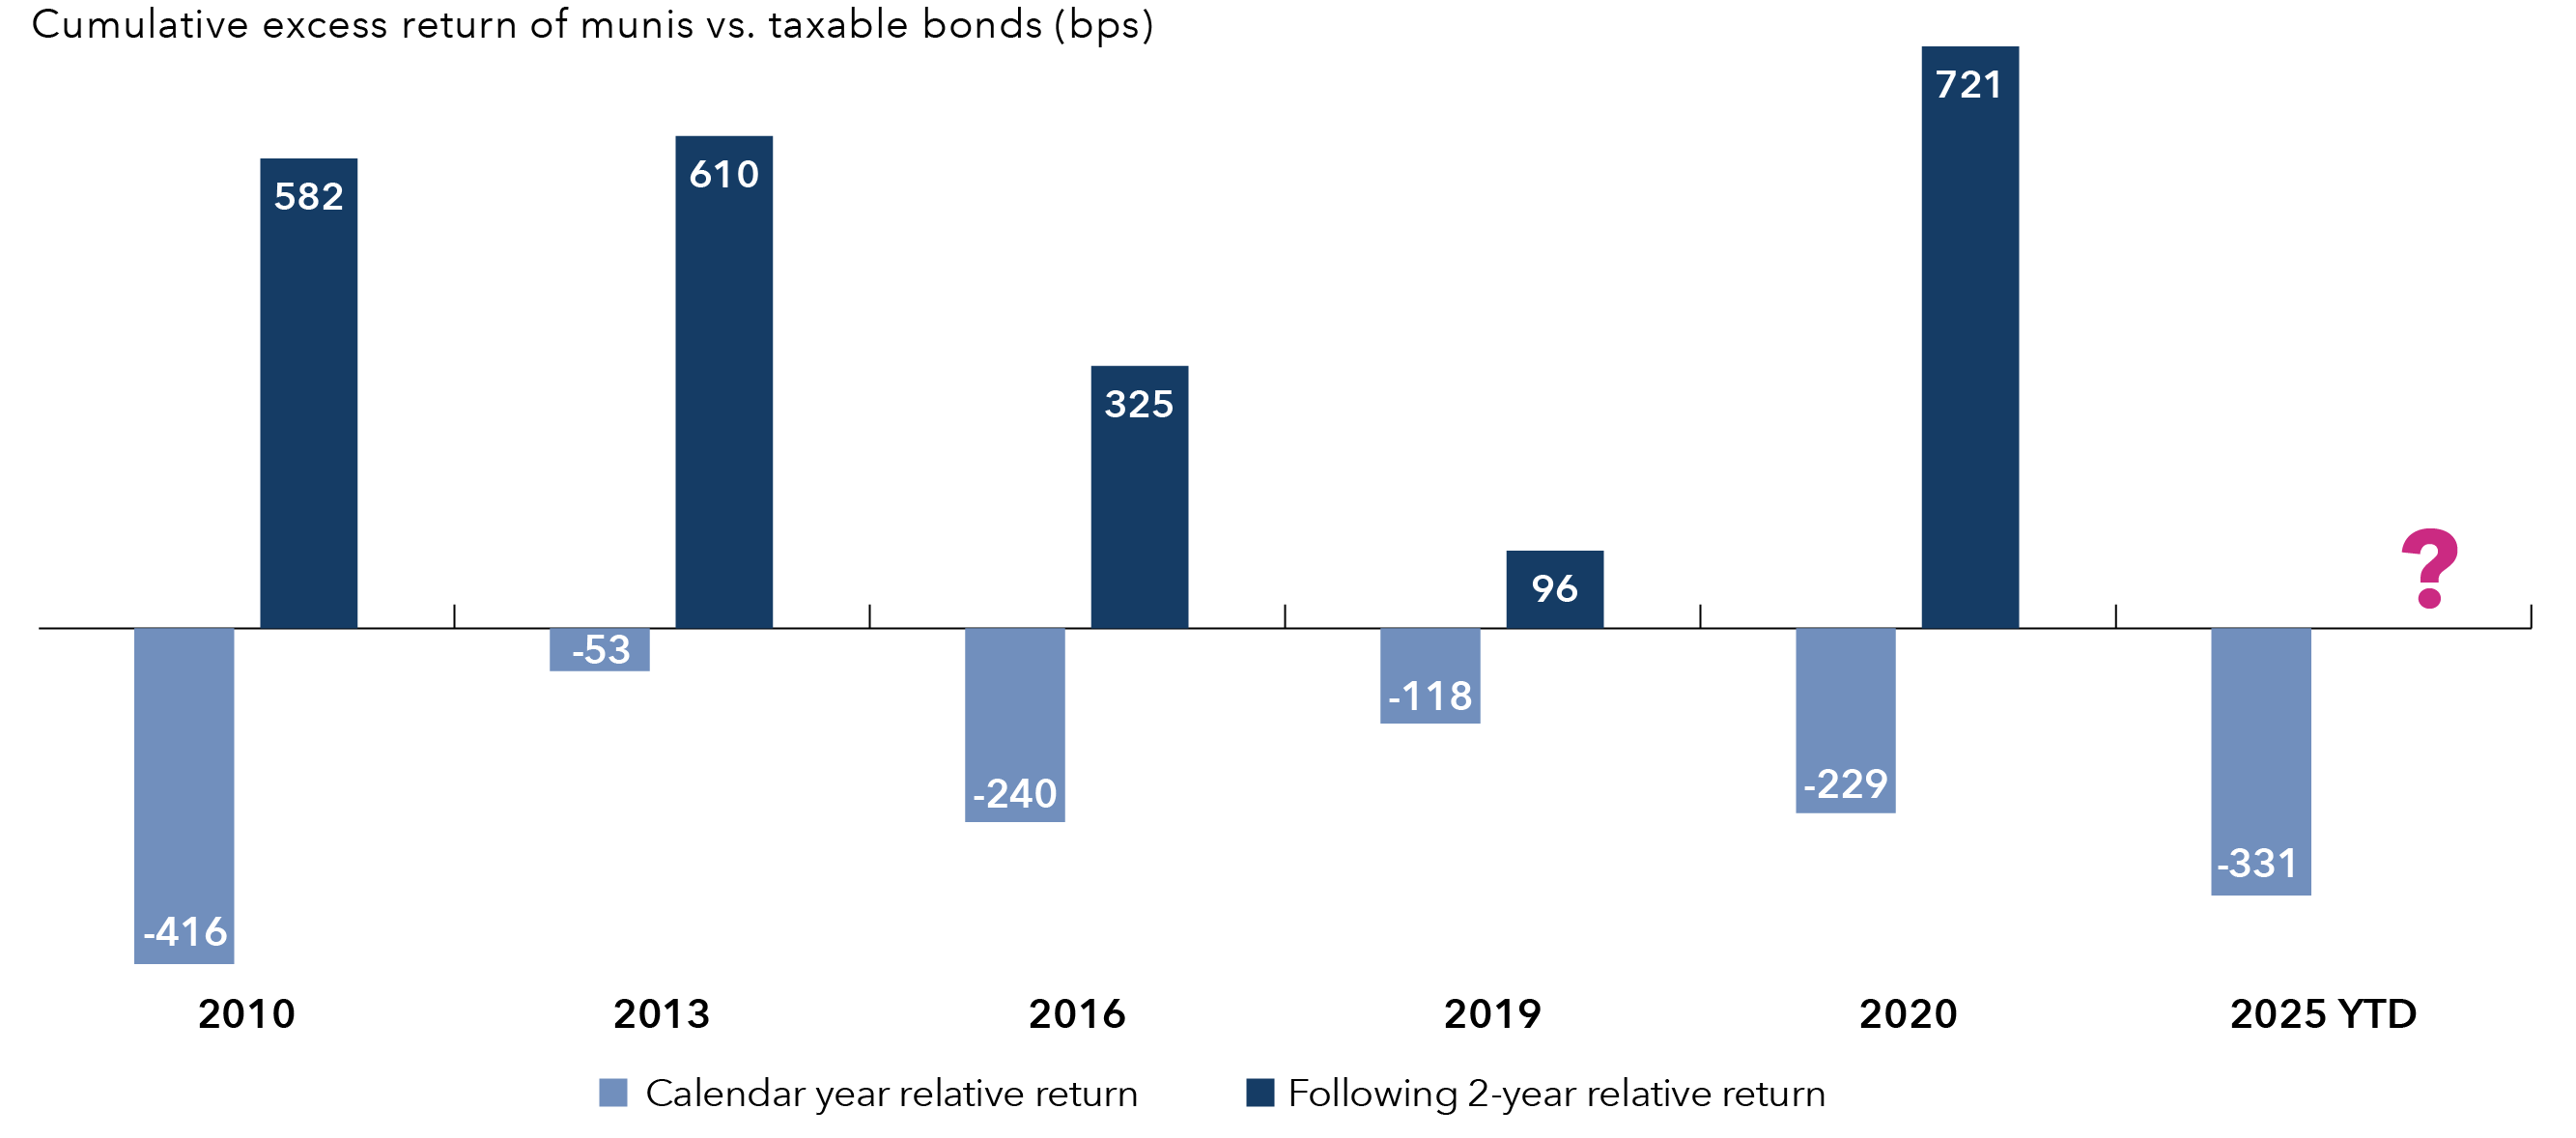
That early 2025 dislocation was driven by technical factors — not a deterioration in issuer fundamentals. Most municipal issuers remained solid. State and local governments reported record tax revenues, defaults were rare and overall credit quality stabilized. Recent legislation preserving the tax-exempt status of munis also removed a major policy risk. However, not all issuers are equally positioned. The end of COVID-era stimulus makes assessing individual issuer fundamentals more critical than ever. Those that used federal aid to bolster reserves or invest in infrastructure are in stronger shape, while those that relied on stimulus for recurring expenses now face renewed budget pressure.
In some sectors, selectivity is crucial. For example, hospitals have delivered positive results year to date, yet credit fundamentals remain mixed across issuers. The impact of consolidation varies, with some hospital systems benefiting from increased scale and operational efficiencies, while others face challenges related to integration and local market dynamics. Additionally, political risk is elevated as policymakers consider potential reductions in Medicaid and other federal subsidies, which could affect revenue streams for certain issuers.
The education sector has also delivered positive results this year, but credit quality varies widely. Some issuers in this sector may be exposed to policy changes at the federal level, including potential adjustments to funding and subsidies. Shifts in enrollment trends and state budget priorities may also influence the financial health of some education-related issuers. Colleges will be fighting a long-term demographic headwind as the number of college-age students declines over the next decade. Competing budget priorities could also result in less money allocated to higher education for states that have burned through excess reserves from fiscal stimulus.
Active management can play a notable role in navigating risks in these sectors, with disciplined credit selection and yield curve positioning helping to avoid pitfalls and identify opportunities.
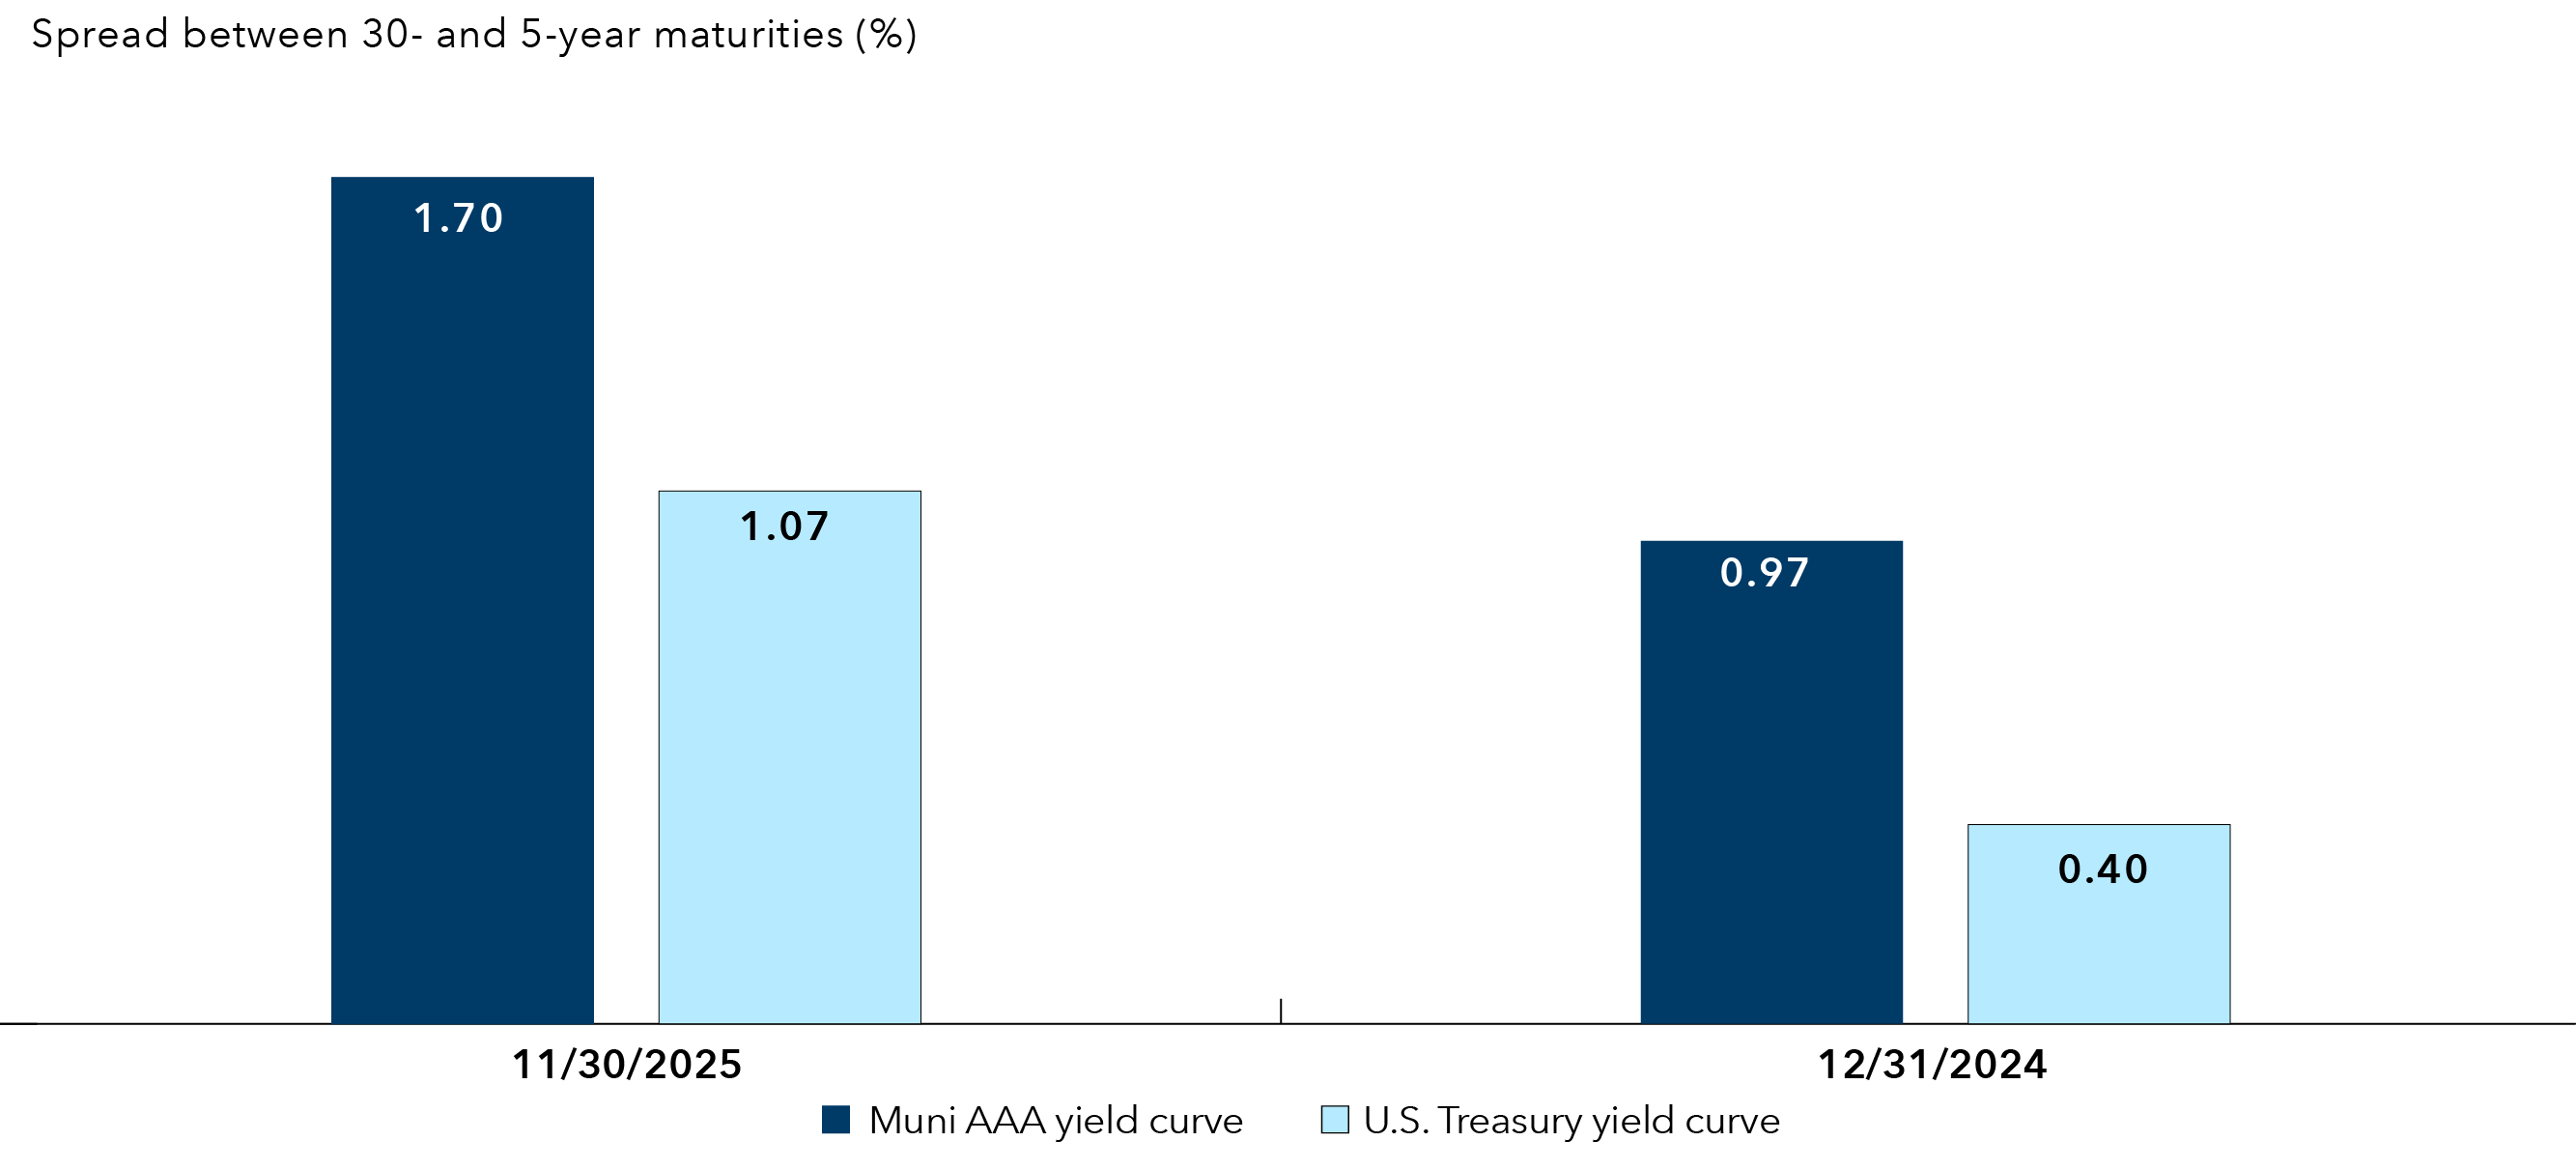
The steepness of the municipal yield curve relative to Treasuries continues to provide compelling relative value. Our managers have positioned portfolios with greater relative exposure to longer dated bonds, which may be beneficial as yield curves potentially converge.
To capture attractive yields, our managers focus on investment-grade bonds (BBB/Baa and above) with maturities of 10 to 20 years. For those seeking greater total return potential, our managers consider longer duration high-yield strategies as the market has increasingly rewarded duration exposure.
While sectors like higher education and health care require caution, we’re finding opportunities in toll roads, transportation and single-family housing — areas with solid fundamentals and attractive relative value.
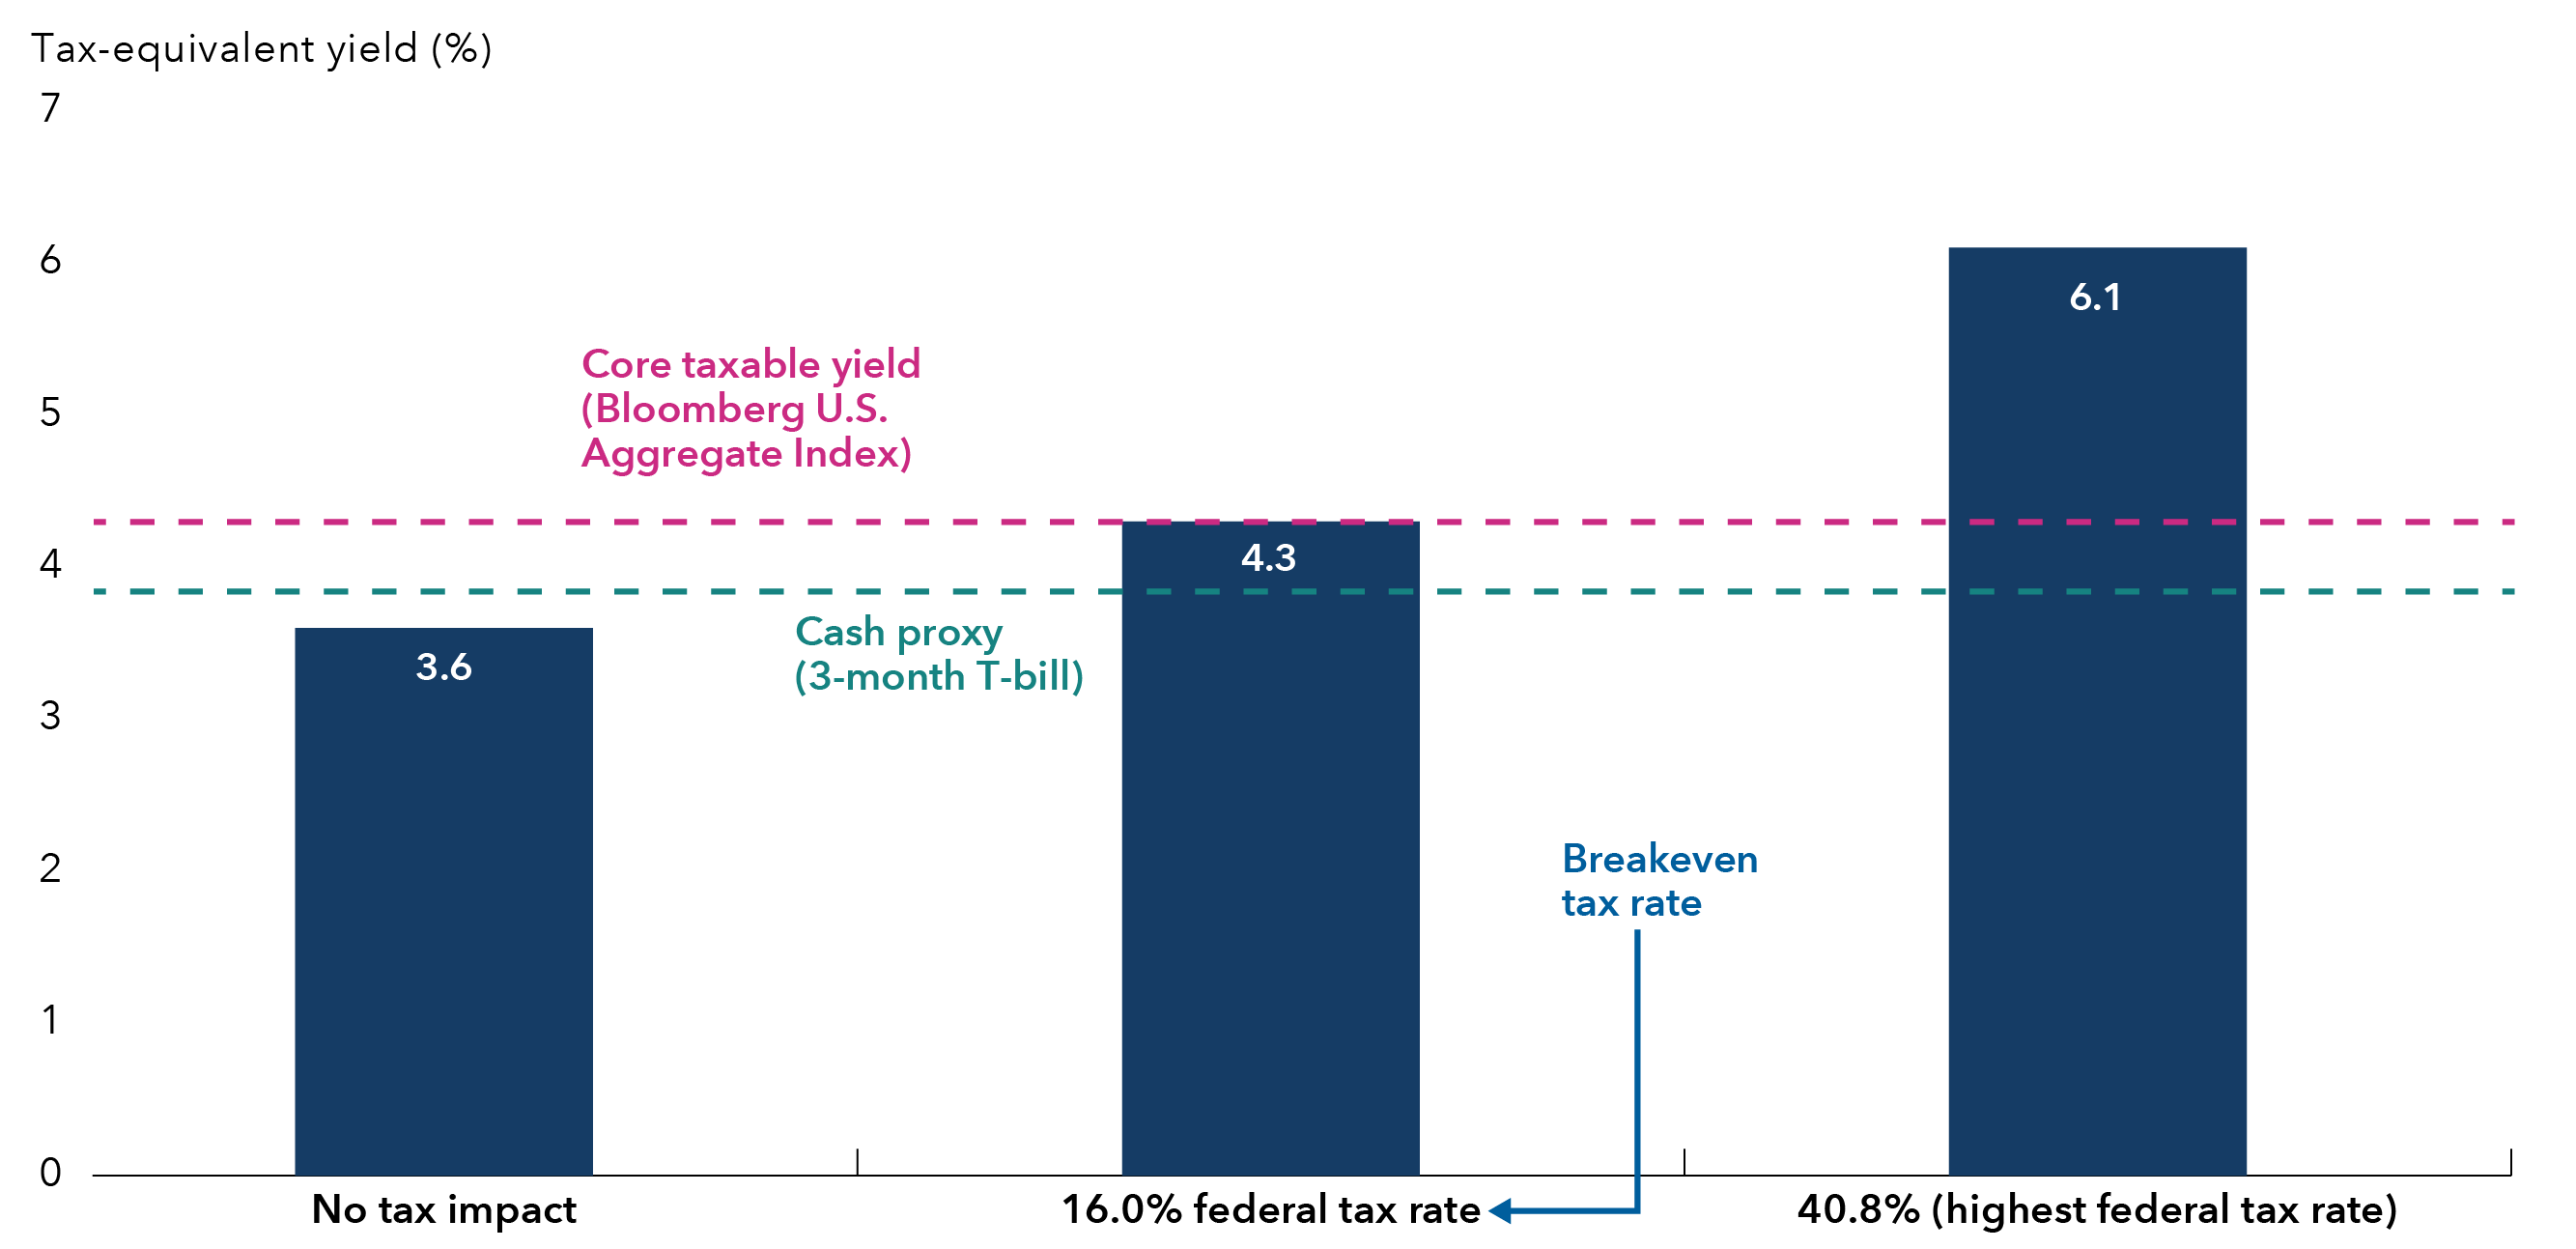
Yields are now in the top quartile of their historical range. For investors in the highest federal tax bracket, taxable-equivalent yields for core municipal bonds (as measured by the Bloomberg Municipal Bond Index) have reached 6.1%, while those with an effective federal tax rate of 16% can capture taxable equivalent yields of 4.3%. The breakeven tax rate for munis to surpass comparable Treasury yields has fallen, widening the appeal beyond traditional high-tax investors.
Many investors may find stronger after-tax income in munis
Sources: Capital Group, Bloomberg. As of November 30, 2025. Tax equivalent yield calculation is yield to worst divided by [1-(federal tax rate)]. The federal tax rate of 40.8% reflects the highest income tax rate of 37% and Medicare tax rate of 3.8%, respectively. The after-tax, or tax-equivalent, yield of a municipal bond measures how its income compares to that of a taxable bond. In other words, it answers: What yield would a taxable bond need to offer to match the after-tax income of this municipal bond?
Short-duration munis also stand out — delivering 2.82% tax-exempt yields (4.76% taxable-equivalent for the highest federal tax bracket) as of November 30, 2025, based on the Bloomberg Municipal Short 1-5 Years Index — making them attractive compared to cash alternatives.
The sharp benchmark deviation between municipal bonds and taxable fixed income has created a rare and compelling environment. While technical pressures have weighed on results, market fundamentals remain solid, and the steep yield curve offers attractive relative value. Active management, particularly with an emphasis on credit selection and yield curve positioning, remains central to how our managers approach the current municipal market environment. By targeting sectors and credits with care and responding to yield curve dislocations, we believe investors who own municipal bonds may be well positioned to benefit as the sector recovers and the valuation gap narrows.
Past results are not predictive of results in future periods.
Bloomberg U.S. Aggregate Index represents the U.S. investment-grade fixed-rate bond market.
Bloomberg Municipal Bond Index is a market value-weighted index designed to represent the long-term investment-grade tax-exempt bond market.
The Bloomberg Municipal Short (1-5) Index is a component of the Bloomberg Municipal Bond index.
Bond ratings, which typically range from AAA/Aaa (highest) to D (lowest), are assigned by credit rating agencies such as Standard & Poor's, Moody's and/or Fitch, as an indication of an issuer's creditworthiness.
The return of principal for bond portfolios and for portfolios with significant underlying bond holdings is not guaranteed. Investments are subject to the same interest rate, inflation and credit risks associated with the underlying bond holdings.
Income from municipal bonds may be subject to state or local income taxes and/or the federal alternative minimum tax. Certain other income, as well as capital gain distributions, may be taxable. The Tax-Exempt Bond Fund of America will not invest in bonds subject to the federal alternative minimum tax.
A spread is the difference between the yield of a bond and the yield of a similar maturity Treasury bond.
Duration measures a bond’s sensitivity to changes in interest rates. Generally speaking, a bond's price will go up 1% for every year of duration if interest rates fall by 1% or down 1% for every year of duration if interest rates rise by 1%.
Yield to worst is the lowest yield that can be realized by either calling or putting on one of the available call/put dates, or holding a bond to maturity.
The Capital Ideas newsletter delivers weekly insights straight to your inbox.