 Timothy Ng
Defined Contribution
Categories
Interest Rates
Why duration still offers value in an investment-led expansion
KEY TAKEAWAYS
- Sticky inflation and a less orthodox Federal Reserve under Chair Warsh pushed markets to price a wider distribution of policy outcomes, including a higher probability to renewed rate hikes.
- Debt-financed AI infrastructure investment poses upside risks to growth and Treasury supply, though productivity gains and the global nature of the buildout may limit U.S. inflation pressures.
- Current yields, attractive carry and roll, and compelling valuations support a long-duration bias even without near-term policy easing.
The quarter began with investors focused on geopolitical risk and the possibility that conflict in the Middle East would deliver a sustained energy-driven inflation shock. As tensions eased, that concern faded, but it was quickly replaced by a different set of worries. Core inflation prints remained sticky while the Fed's reaction function became less certain under new Chair Kevin Warsh, leading the markets to raise the probability that the next meaningful policy move could be a hike rather than a cut.
At the same time, the rates market shifted its attention toward the scale and financing of the artificial intelligence buildout. Investors became increasingly worried about increased corporate issuance, and whether the heavy investment would sustain above-trend economic growth and keep inflation elevated. That combination lifted Treasury yields to recent highs and pushed spreads wider on tech related corporate bonds. In our Rates Team’s view, however, the market may be treating several distinct risks as though they all point in the same direction. The result is a valuation opportunity in high-quality, longer-maturity bonds.
A quarter defined by changing concerns
The easing of Middle East tensions could remove an important near-term tail risk. Lower geopolitical risk should reduce the chance of an acute oil shock but may not restore confidence in the disinflation process. A run of sticky inflation readings suggested that progress toward the Fed’s objective could remain uneven, particularly in categories where prices are directly boosted by the AI buildout.
The June Federal Open Market Committee (FOMC) meeting added to that caution. Policymakers reaffirmed its commitment to price stability, reopening the door to a potential tightening cycle if inflation remained stubbornly above their target. By emphasizing that inflation risks remained alive and that policy would respond if necessary, the Fed reminded investors that cuts were not guaranteed and that hikes could return to the distribution of outcomes. Markets responded by raising rate-hike probabilities and pushing bond yields higher.
That repricing has been reinforced by a broader concern about capital formation. The largest technology companies are planning substantial spending on data centers, semiconductors, power infrastructure and related capacity. Because a portion of that spending may be financed in the bond market, investors worry that heavier corporate issuance will meet already-large sovereign supply. The fear is not only technical. If investment spending keeps demand strong, some worry it could delay the cooling in inflation that would benefit longer-maturity bonds.
A heavy AI buildout is not necessarily bad for inflation
The bond supply concern is real. More issuance can raise the yield investors require, particularly when balance-sheet capacity is constrained and the market is already absorbing elevated government borrowing. But the macroeconomic effects of the AI investment cycle are more nuanced than a simple “more capex, more inflation, higher yields” framework implies.
First, investment that raises productivity can be disinflationary over time. If firms can produce more output with the same labor and capital inputs, unit costs can fall even while real activity remains healthy. Stronger productivity would allow the economy to grow faster without generating the same degree of wage and price pressure. The near-term construction of data centers may be resource intensive, but the eventual payoff could expand productive capacity and lower the inflation rate consistent with a given pace of growth.
Second, the current inflation problem appears concentrated in areas like food and energy rather than appearing uniformly broad. Sticky inflation readings matter, but they have not necessarily signaled a generalized reacceleration across the entire consumption basket. When inflation is isolated in a limited number of categories, the hurdle for a durable shift back to accelerating inflation is higher. It also means that strong investment spending does not automatically translate into economy-wide pricing power.
Inflation pressures appear concentrated, not broad-based
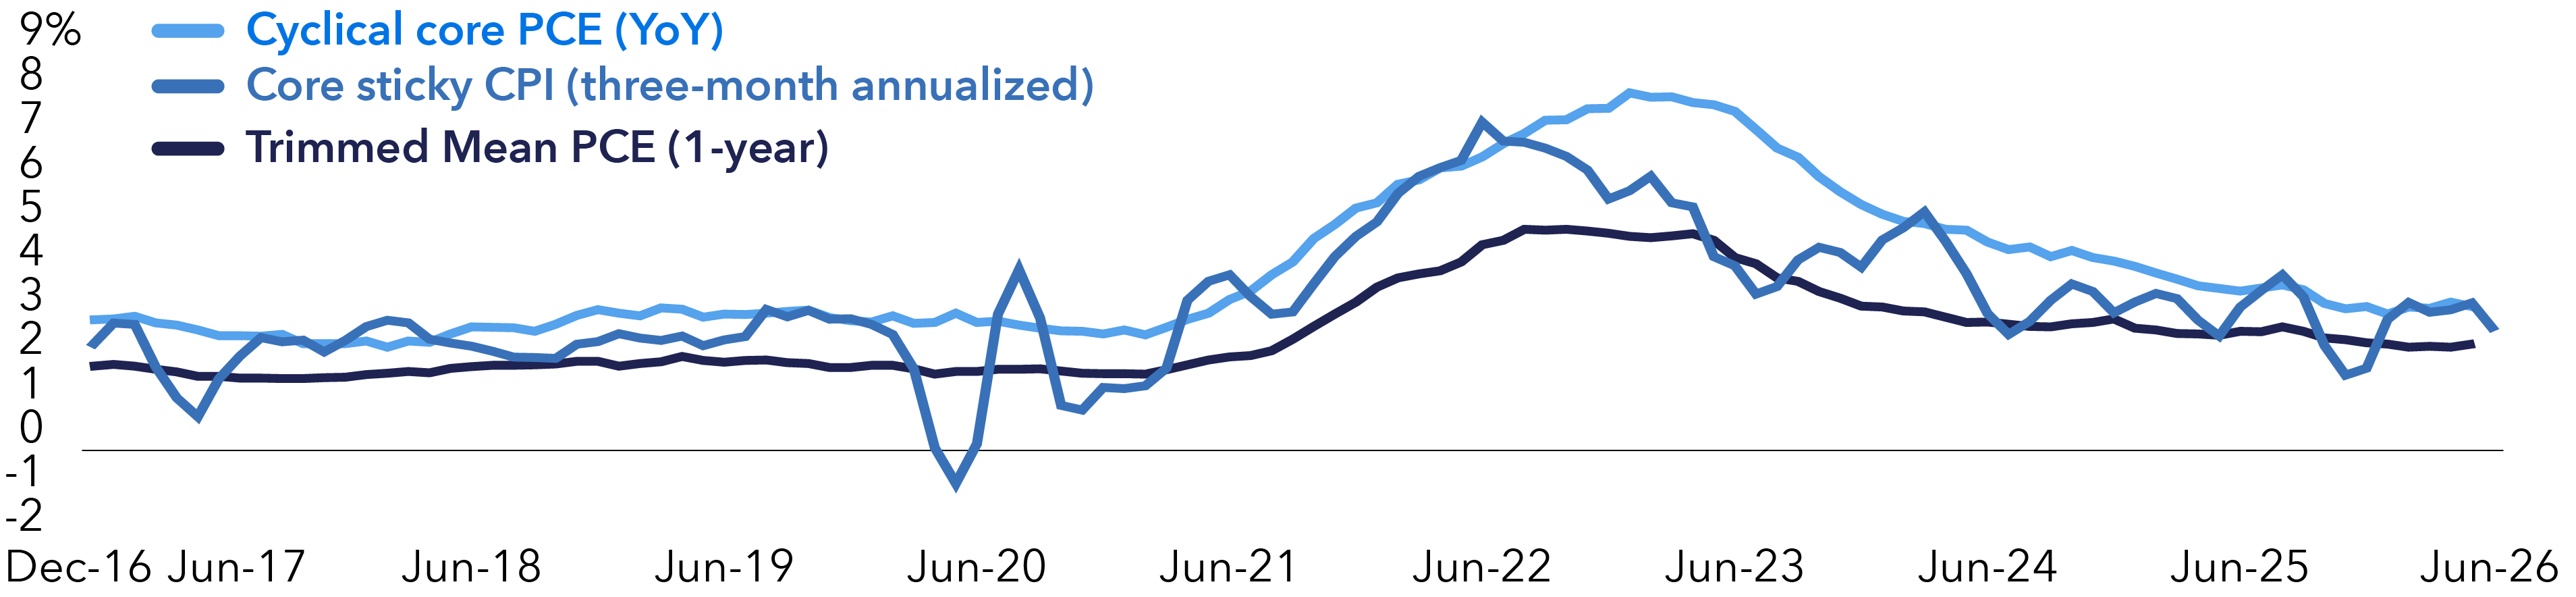
Sources: U.S. Federal Reserve Banks of Atlanta, San Francisco and Dallas. As of 6/30/26. Core Sticky CPI (three-month annualized) is the Atlanta Fed Core Sticky-Price Consumer Price Index, measured as a three-month annualized rate. Cyclical Core PCE (YoY) is the San Francisco Fed Cyclical Core Personal Consumption Expenditures Price Index, measured as a year-over-year change. Trimmed Mean PCE (1-year) is the Dallas Fed Trimmed Mean Personal Consumption Expenditures Inflation Rate, measured on a 12-month basis.
Third, not every dollar of AI-related capital expenditure is directly accretive to U.S. activity. A meaningful share of the supply chain sits abroad, including semiconductor fabrication, equipment production and other imported inputs. Some spending therefore leaks into foreign production rather than becoming a one-for-one boost to U.S. demand. This global footprint can mute the effect on domestic growth, labor utilization and inflation, even if headline corporate investment numbers remain large.
The timing also matters. Markets tend to capitalize announced spending immediately, while the actual economic impulse arrives over several quarters and may be offset by depreciation, displacement of other projects or weaker spending elsewhere. Corporate supply can pressure yields in the short run, but it does not follow that the full buildout should be treated as a permanent increase in the neutral rate.
The supply impact could be more structural for the yield curve. As technology companies increasingly use the corporate bond market to finance the AI-buildout, and rely on long-dated bond issuance, long-end yields have moved higher and the curve has steepened. If this trend continues, the markets will price term premium higher which should contribute to a structurally steeper yield curve.
Valuations compensate investors for uncertainty
The case for owning duration begins with valuation. Current yields provide substantial carry, and an upward sloping curve offers the potential for positive appreciation (roll) as bonds age. That income potential can create a cushion against modest further increases in yields and can reduce the reliance on an immediate rally to generate returns.
History is also encouraging. When bond valuations have reached similarly attractive levels, subsequent returns have skewed positive, even when the path was volatile and the timing of the policy turn was uncertain. The key point is not that yields cannot rise further. They can. It is that investors are being paid more generously to hold duration than they were through much of the post-global-financial-crisis period, and the starting yield is an important driver of medium-term total return.
Forward bond returns have historically tended to skew positive around today's yield levels
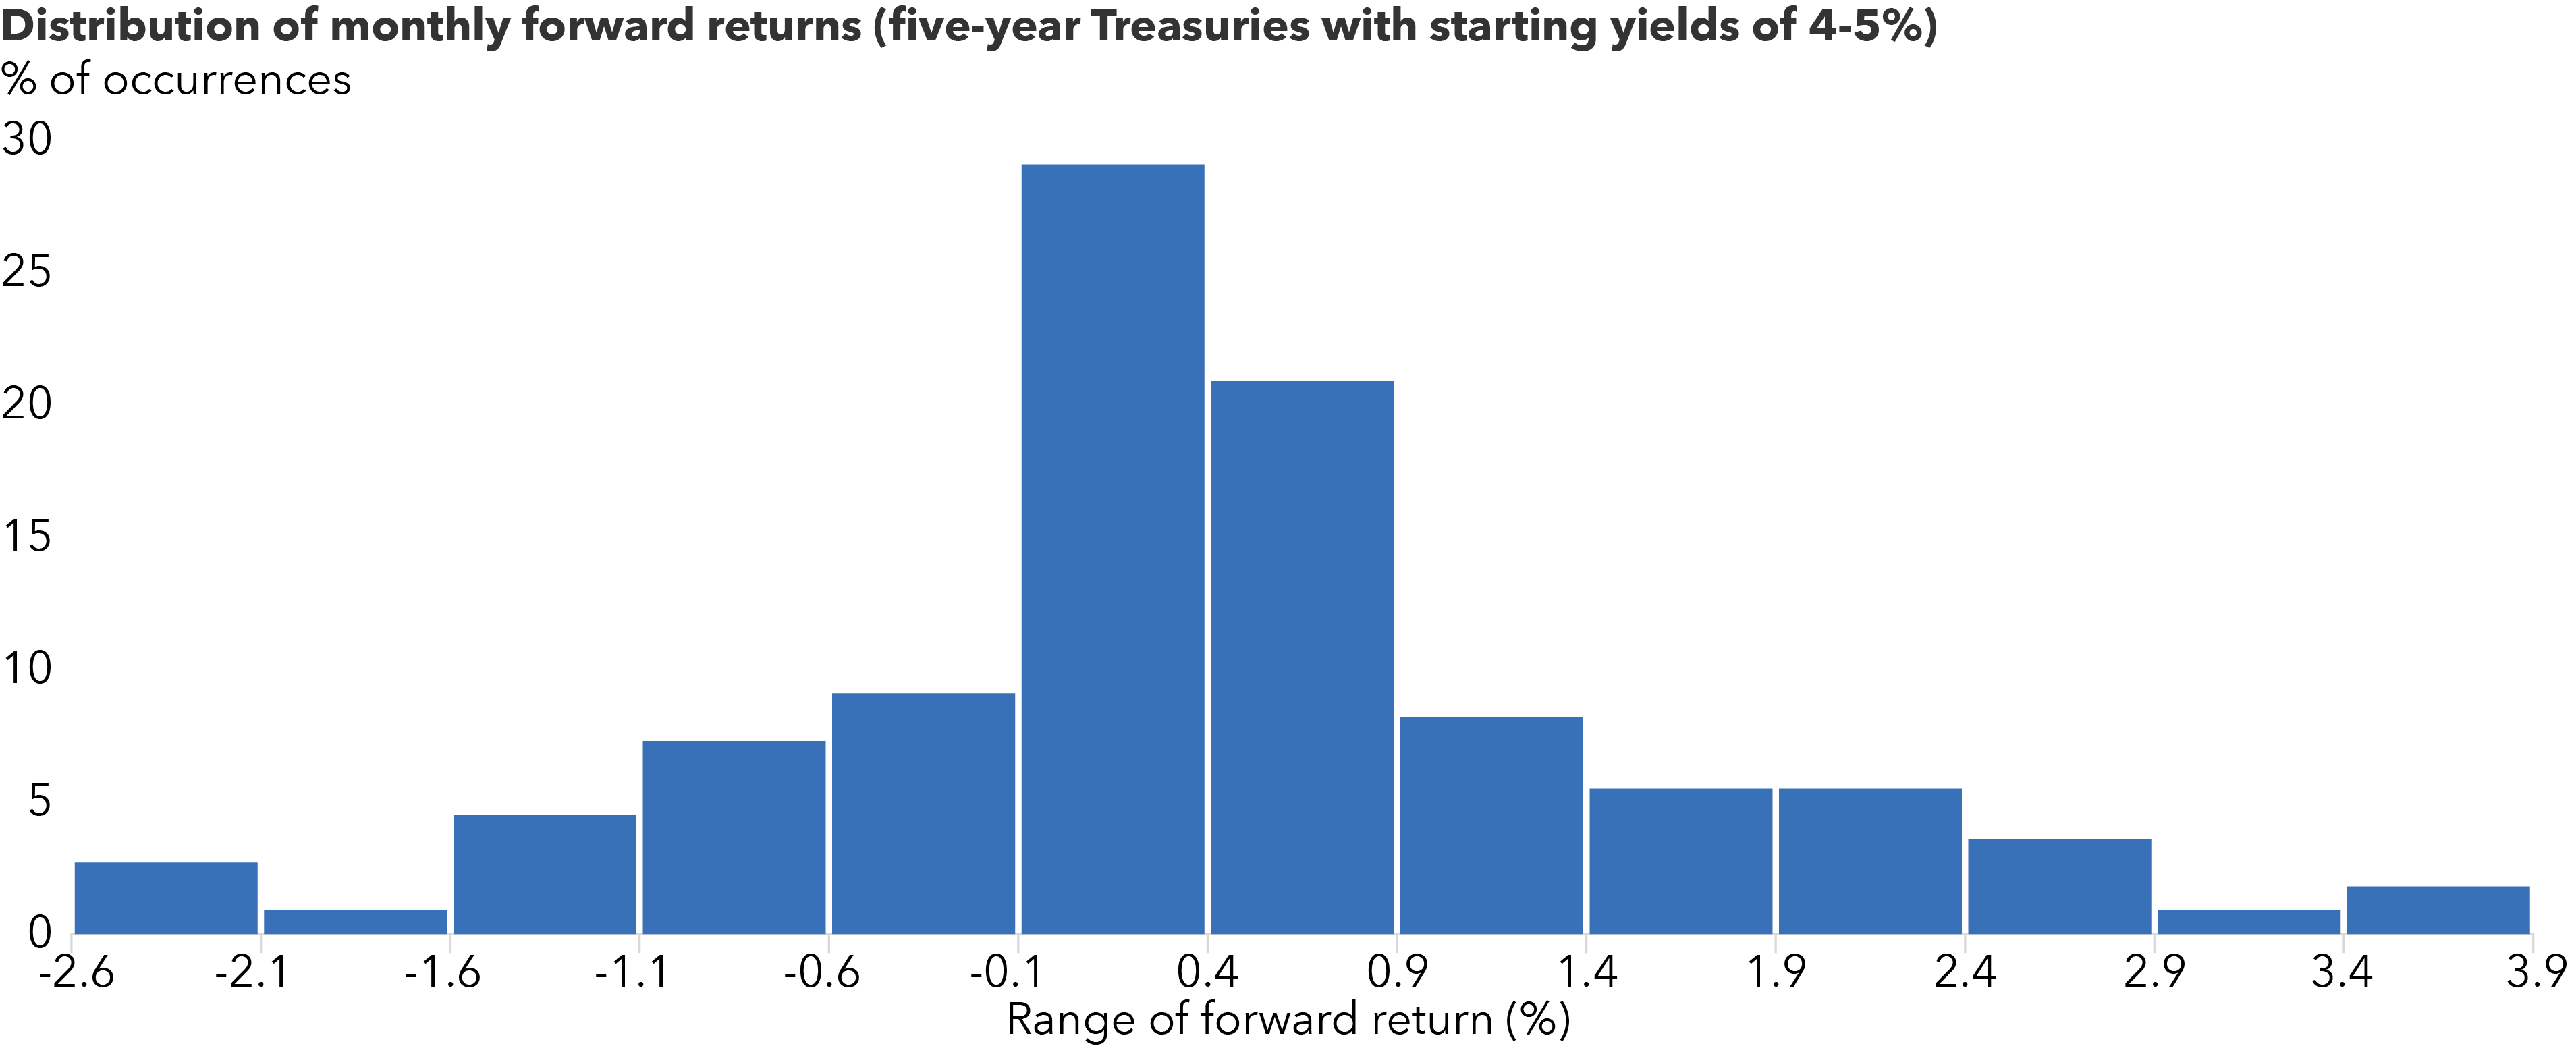
Sources: Capital Group, Federal Reserve Bank of St. Louis (Federal Reserve Economic Data – FRED). As of 6/30/26. Historical monthly returns are based on a reconstructed 5-year U.S. Treasury return series using data from FRED starting in 1962. Observations were filtered to 110 periods when the starting 5-year Treasury yield was between 4% and 5%. For each qualifying month, the subsequent one-month total return was calculated and grouped into return buckets to create the distribution shown. Past results are not predictive of future outcomes.
High real yields are particularly notable. They embed a demanding combination of resilient growth, heavy supply and a restrictive policy stance. For those expectations to be realized, several things must go right at once: productivity gains must fail to relieve inflation, investment must remain strongly additive to domestic demand, the labor market must avoid meaningful cooling and the Fed must ultimately validate the market’s more hawkish path. That is possible, but it is a high bar.
The Fed is not on a one-way road to hikes
The June meeting was hawkish as the Fed reaffirmed its commitment to its 2% target; the July meeting was dovish as policy rates were left unchanged. The policy outlook remains two-sided. It is unclear if the Fed will, under Warsh’s new leadership, address sticky inflation with higher interest rates, tighter balance sheet policy or both, and its new policy of providing no forward guidance adds to the uncertainty. Meanwhile, the Fed is also watching labor demand, financial conditions and the cumulative effect of restrictive real rates. A few sticky inflation prints can keep cuts at bay, but they do not by themselves establish a new hiking cycle, particularly if they are not broadly driven.
This distinction matters for duration. Investors do not need the Fed to cut quickly for longer-maturity bonds to generate positive returns. Stable policy, moderate nominal growth or a decline in term premium could all support returns. Duration would also regain its traditional hedging value if the investment cycle disappoints, corporate issuance becomes more difficult to absorb or the labor market weakens more sharply than expected.
The market has moved from pricing a relatively benign easing cycle to assigning more weight to a renewed tightening scenario. That repricing has improved forward returns. In our Rates Team’s view, the distribution of outcomes is now more balanced than market pricing suggests: inflation may remain sticky, but productivity, global supply chain leakage and falling wage growth all argue against treating higher rates as inevitable.
Wage growth has continued to moderate from post-pandemic highs
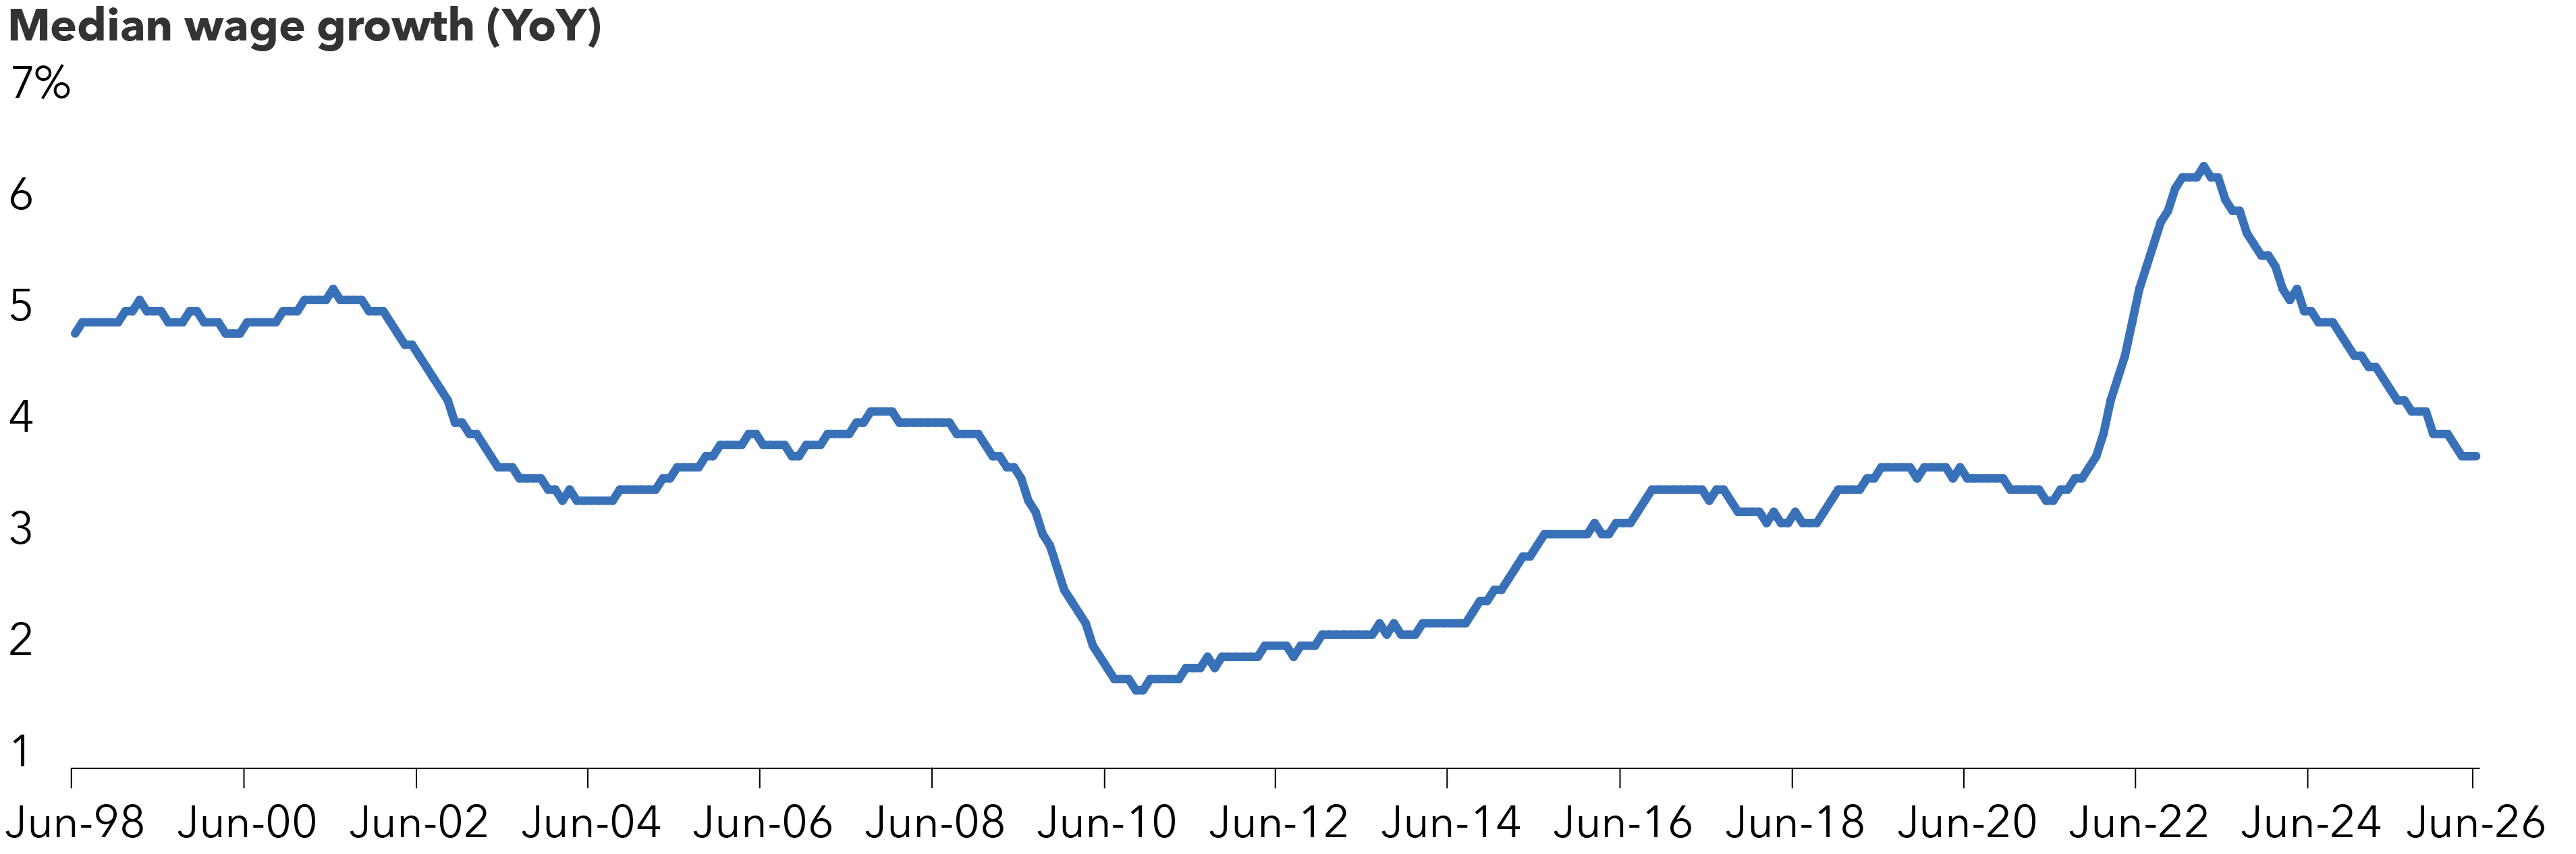
Source: Federal Reserve Bank of Atlanta. As of 6/30/26. Figures shown represent the Atlanta Fed’s Wage Growth Tracker, which is a measure of the nominal wage growth of individuals. The tracker reports the median percent change in the hourly wage of individuals observed 12 months apart.
Why our Rates Team favors long duration
Our Rates Team favors long duration because it offers both income and convexity at a time when macro uncertainty is high. Carry and roll are attractive, valuations have historically been associated with positive forward bond returns and the policy path is not definitively moving toward hikes. The AI buildout may keep volatility elevated and create periodic supply-driven selloffs, but those episodes can improve entry points rather than invalidate the strategic case.
The central question is whether debt-financed investment creates a lasting, broad-based inflation problem. We are not convinced that it does. If AI spending raises productivity, if inflation remains concentrated and if part of the investment impulse accrues outside the United States, the effect on domestic rates should be more muted than the market fears. Against that backdrop, today’s yields provide meaningful compensation for patience.
Bond markets are unlikely to move in a straight line. Sticky data or stronger issuance calendars can still push yields higher in the near term. But long-term investors do not need perfect timing. With real yields elevated and the Fed retaining flexibility in both directions, high-quality duration remains an attractive source of carry and source of portfolio diversification in a downside growth scenario.
The U.S. Rates Team approaches interest rate research using a four-factor framework across economic fundamentals, policy fundamentals, valuations and technicals to arrive at recommended positioning for fixed income portfolios across duration, yield curve and inflation expressions. The views of individual portfolio managers and analysts may differ.
Learn more about
A spread over Treasuries is the difference between the yield of a bond and the yield of a similar maturity Treasury bond.
Duration measures a bond’s sensitivity to changes in interest rates. Generally speaking, a bond's price will go up 1% for every year of duration if interest rates fall by 1% or down 1% for every year of duration if interest rates rise by 1%. When an investor talks about “owning duration,” this means that they have exposure to interest rate risk.
In simple terms, bond “carry” is equal to coupon income minus the cost of funding.
Fixed income “roll” is the capital gain earned on a bond as it approaches maturity, assuming the yield curve remains unchanged. Typically, as a bond gets closer to its maturity date, its yield declines, forcing its price to increase, which then allows investors to sell it for more than they purchased it for while collecting coupon income.
Real yield refers to the return on an investment after accounting for inflation -- it is the nominal yield adjusted to reflect the erosion of purchasing power due to inflation.
Convexity measures how a bond’s price sensitivity to interest-rate changes evolves as yields move. Higher-convexity bonds tend to benefit more from declining yields than they are hurt by equivalent increases in yields.
Core inflation is a measure of the rising cost of goods and services that excludes food and energy items.
Sticky inflation refers to sustained increases in wages and prices of certain consumer goods that usually don't change frequently or dramatically.
An "inflation print" refers to new inflation data releases.
Our latest insights
-
-
-
Artificial Intelligence
-
Artificial Intelligence
-
Interest Rates
RELATED INSIGHTS
-
-
-
Market Volatility
Don’t miss out
Get the Capital Ideas newsletter in your inbox every other week
Investments are not FDIC-insured, nor are they deposits of or guaranteed by a bank or any other entity, so they may lose value.
Investors should carefully consider investment objectives, risks, charges and expenses.
This and other important information is contained in the fund prospectuses and/or summary prospectuses, which can be obtained from a financial professional and should be read carefully before investing.
Statements attributed to an individual represent the opinions of that individual as of the date published and do not necessarily reflect the opinions of Capital Group or its affiliates. This information is intended to highlight issues and should not be considered advice, an endorsement or a recommendation.
All Capital Group trademarks mentioned are owned by The Capital Group Companies, Inc., an affiliated company or fund. All other company and product names mentioned are the property of their respective companies.
This content, developed by Capital Group, home of American Funds, should not be used as a primary basis for investment decisions and is not intended to serve as impartial investment or fiduciary advice.
Capital Client Group, Inc.
Use of this website is intended for U.S. residents only.