Artificial Intelligence
Categories
Interest Rates
5 charts to consider if worried about rising rates
 John Queen
 Anmol Sinha
October 14, 2026
Don't miss our latest insights.
Bond yields have been rising again. While today’s environment may be inducing some flashbacks to 2022, investors should consider a broader historical context when facing a fresh period of rising rates.
Today’s higher yield environment is driven by several factors. Higher energy prices, supply dynamics, a rise in bond yields globally, a reassessment of underlying growth and a more hawkish tilt from the Federal Reserve (Fed) are among those factors. The Fed hiked rates in September for the first time in more than three years in response to inflation remaining persistently above its target. These forces have led bond yields higher – and bond prices lower.
Will it get worse for bond investors or will prospects improve? We see five considerations for evaluating portfolios.
1. Starting conditions matter when assessing potential impact
Not every period of rising rates is the same. Their catalysts, rate paths – and importantly – impact on markets can vary widely. When the Fed began raising rates in 2022 in response to sharp inflation, very low starting yields offered little income to offset falling prices. Today’s drivers and starting point are very different.
In 2026, multiple factors are playing into higher rates. The Middle East conflict and rising energy prices have left headline inflation elevated and have driven inflation concerns. But underlying core inflation is not surging like in 2022. We see several factors suggesting that inflation could remain sticky but not accelerate meaningfully: moderating wage growth, low savings rates, contained shelter inflation and limited breadth of subsectors showing inflation pressures. Importantly, inflation expectations have largely remained well anchored.
Part of the rise in U.S. yields has also been driven by robust supply from AI hyperscaler issuance, as well as rising global yields in regions including the U.K., Europe and Japan, many of which are more energy-price sensitive than the U.S. or have other idiosyncratic challenges. Markets have been recalibrating the level of U.S. yields, in part reflecting a reassessment of where real rates should be, given a surprisingly resilient U.S. economy.
With all these factors at play and a more hawkish tone from the Fed, markets have also aggressively repriced expectations for higher rates early on. As October began, three to four additional hikes were priced into markets in the next year – more than the one to two additional hikes the Fed has projected through 2027. That means for bond prices to take an additional hit, expectations would have to rise beyond the market’s projection for Fed Funds rates to approach 5%. On top of that, higher starting yields today can offer a meaningful cushion to offset adverse price impacts, a feature notably missing in the lead-up to 2022, as yields were near all-time lows.
The market has already priced in rate hikes well beyond what the Fed has projected
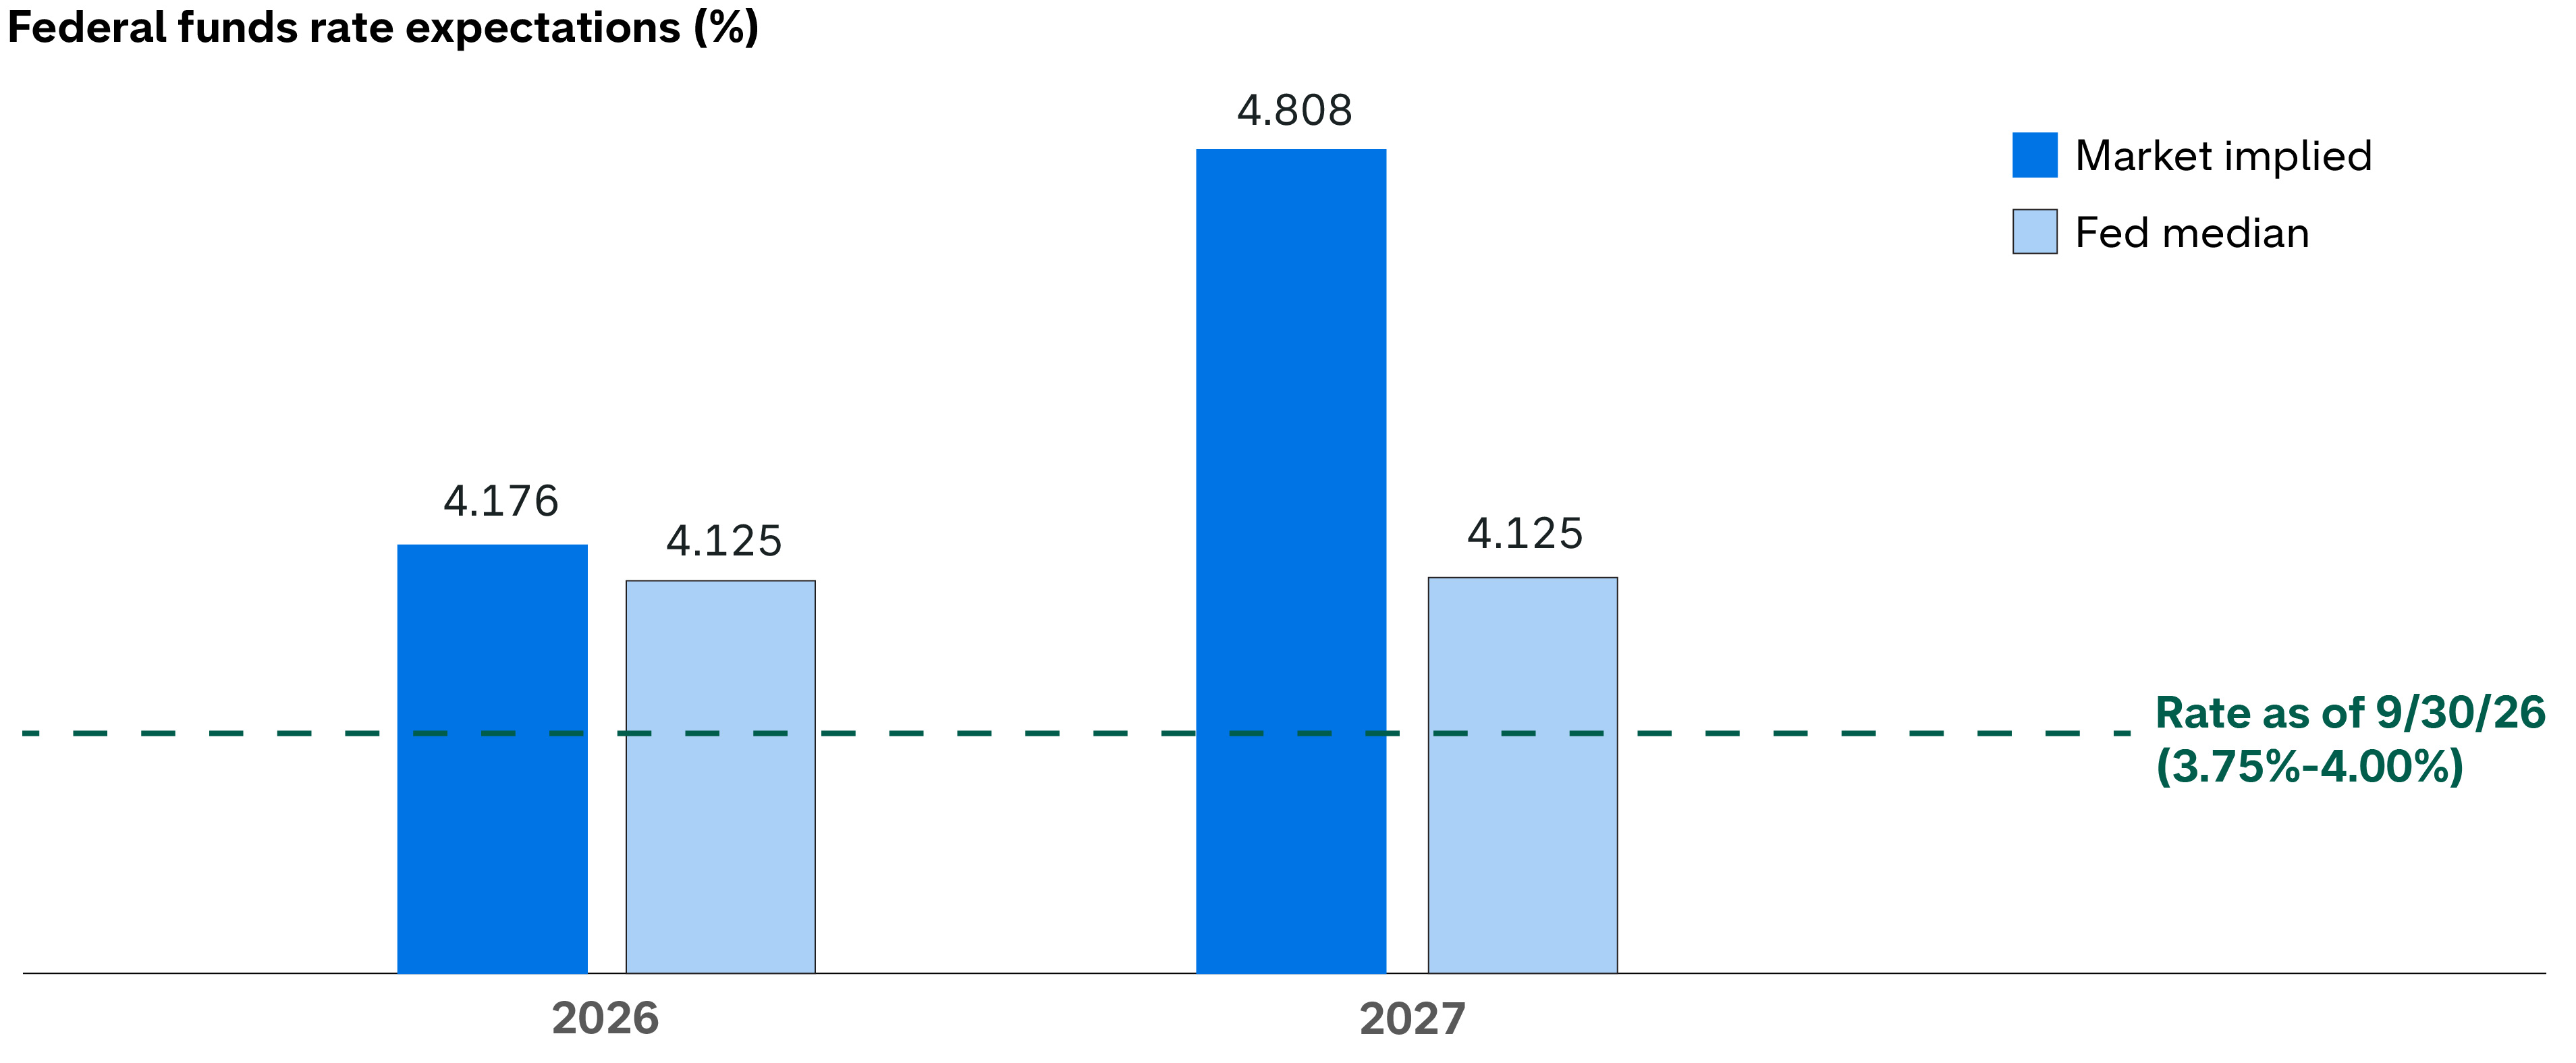
Sources: Bloomberg, Federal Reserve. As of 9/30/26. The federal funds rate shown is the midpoint of the upper and lower bounds of the Federal Reserve’s target range for the federal funds rate. Market-implied federal funds rates are derived from federal funds futures pricing and reflect market expectations. These expectations are subject to change and may differ from actual Federal Reserve decisions.
2. Yields may hit a ceiling: nominal GDP
While no one can be sure how high yields might climb, history can be instructive. The relationship between 10-year Treasury yields and nominal GDP has been meaningful. Historically, nominal GDP has served effectively as a cap on yield. The rationale may be intuitive: over time, investors are not typically paid more for lending to the government than the returns they gain from investing in the economy.
Historically, nominal GDP has served as a ceiling for the 10-year Treasury yield
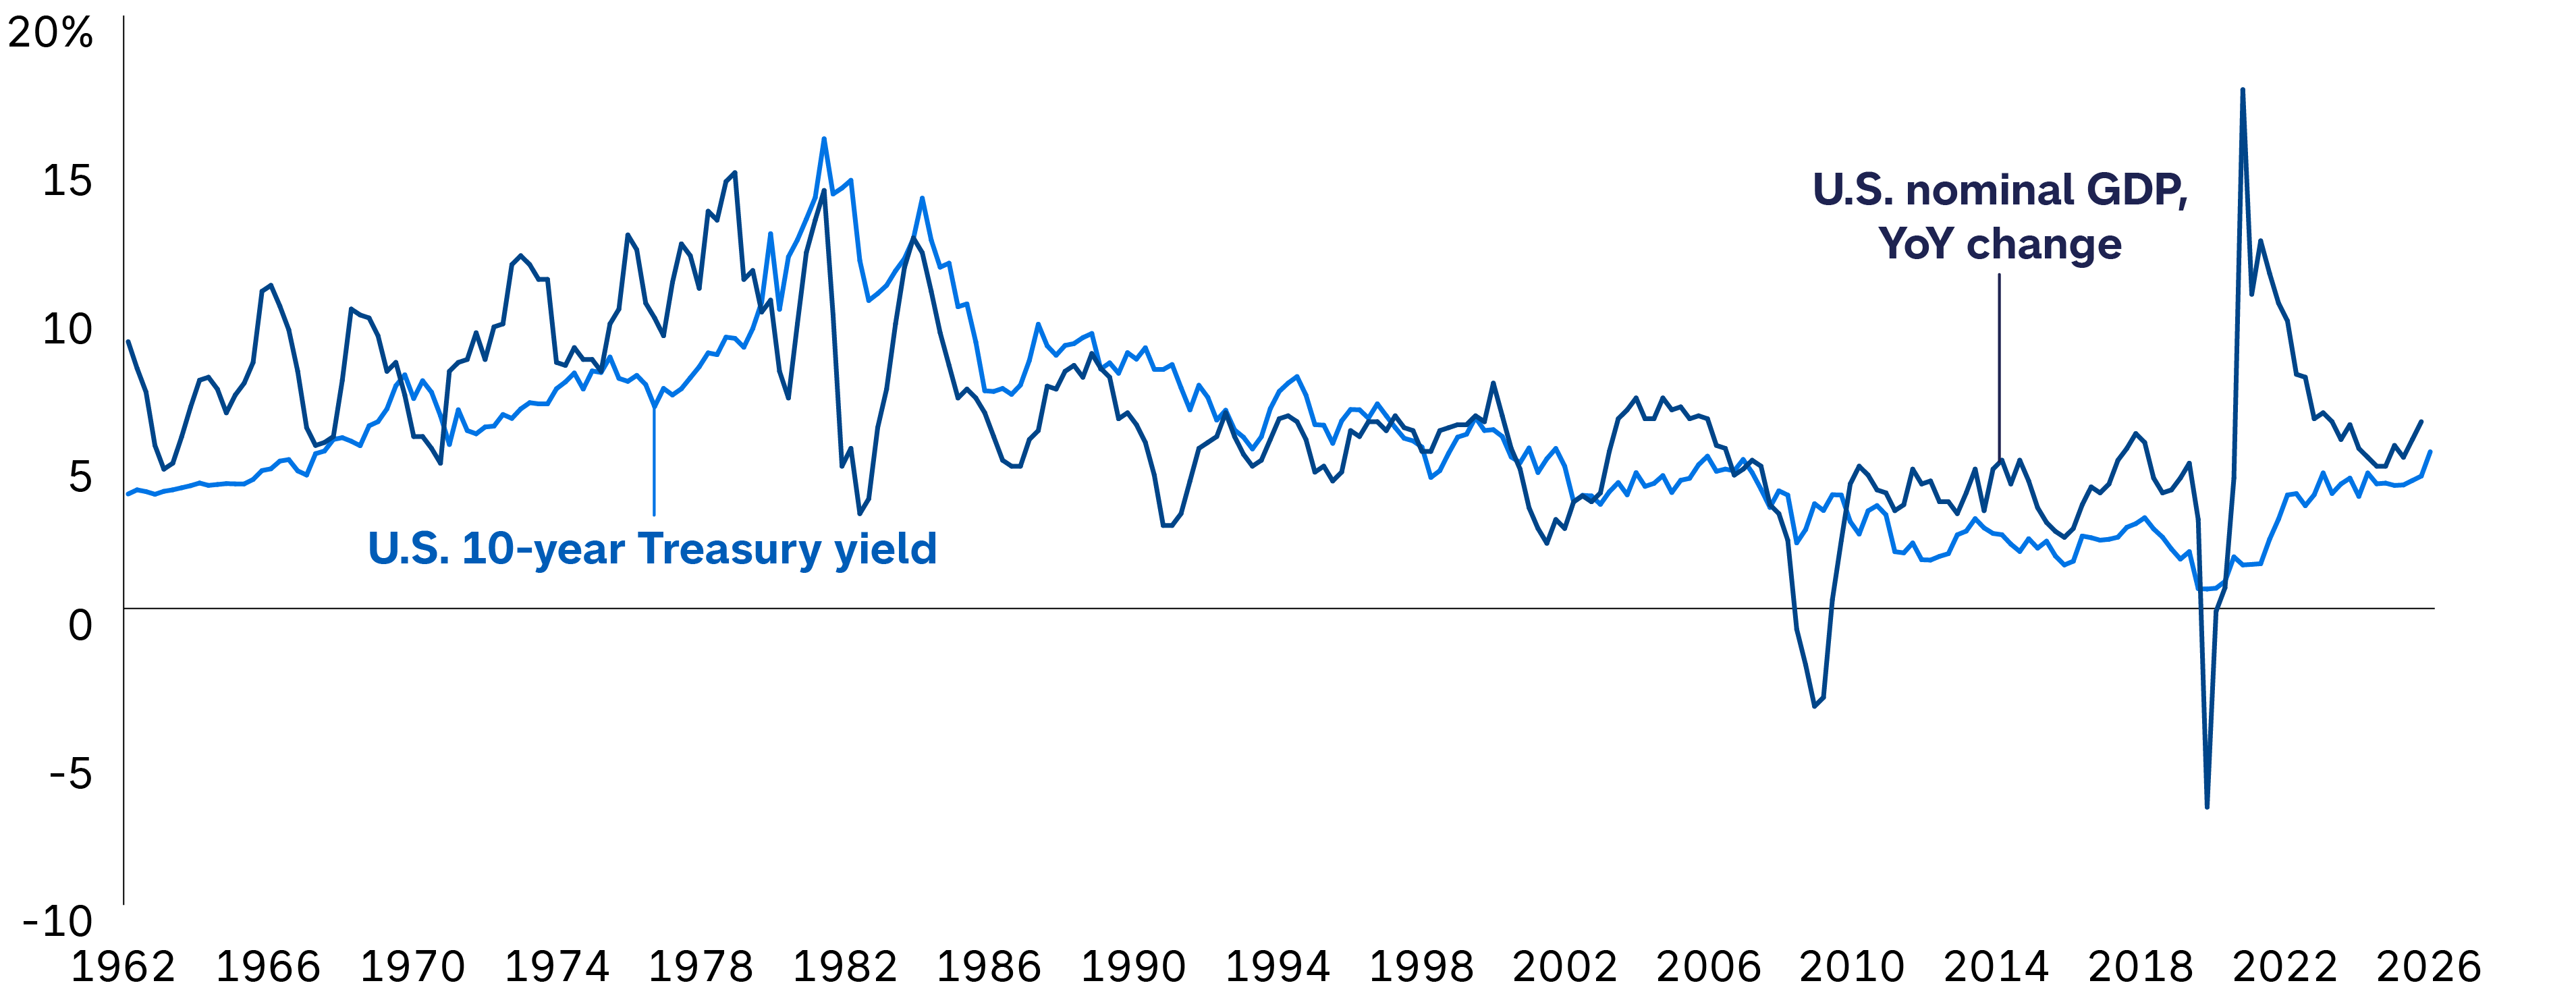
Source: Bloomberg. As of 9/30/26.
So, GDP growth estimates help to determine where yields may settle. Precise predictions can be challenging, but some back-of-the-envelope math may at least help anchor ranges. For example, real underlying trend growth recently has been just below 2%, according to CBO estimates. However, AI has boosted many economists’ projections. So if that drifts up to 2.5-3%, with persistently elevated inflation remaining around 2.5-3%, that could produce nominal GDP growth of roughly 5-6%. With the 10-year yield already in the range of 5-5.5% in late September, this estimate – if the relationship holds – would imply that yields may not have much farther to rise from here.
3. Focus on long-term asset allocation potential – not market timing
As an investor, calling a market high or low is often incredibly tempting. It’s also incredibly difficult. Getting it right may provide higher short-term returns, but staying invested – and avoiding imperfect timing – has historically proven to be a better approach. The day-to-day noise of oil prices or other near-term factors driving interest rates higher one day and lower the next should not distract investors from the asset allocation signal: starting yields imply forward return expectations rarely experienced in nearly a generation.
As mentioned, today’s yields have already priced in significant Fed rate hikes. These starting yields put investors in a position to possibly earn significant income and offer meaningful return potential over time. Consider the 5.56% yield to worst for the Bloomberg U.S. Aggregate Index at the end of September. In the range of 4-6%, the historical average 5-year forward returns were 5.5% over the past 25 years. As the chart below shows, even the worst forward 5-year return in this range of starting yields was still +3.5% annualized. History suggests the risk-reward has skewed in investors’ favor as the range of outcomes has been narrower.
At current starting yields, forward returns have historically been strong
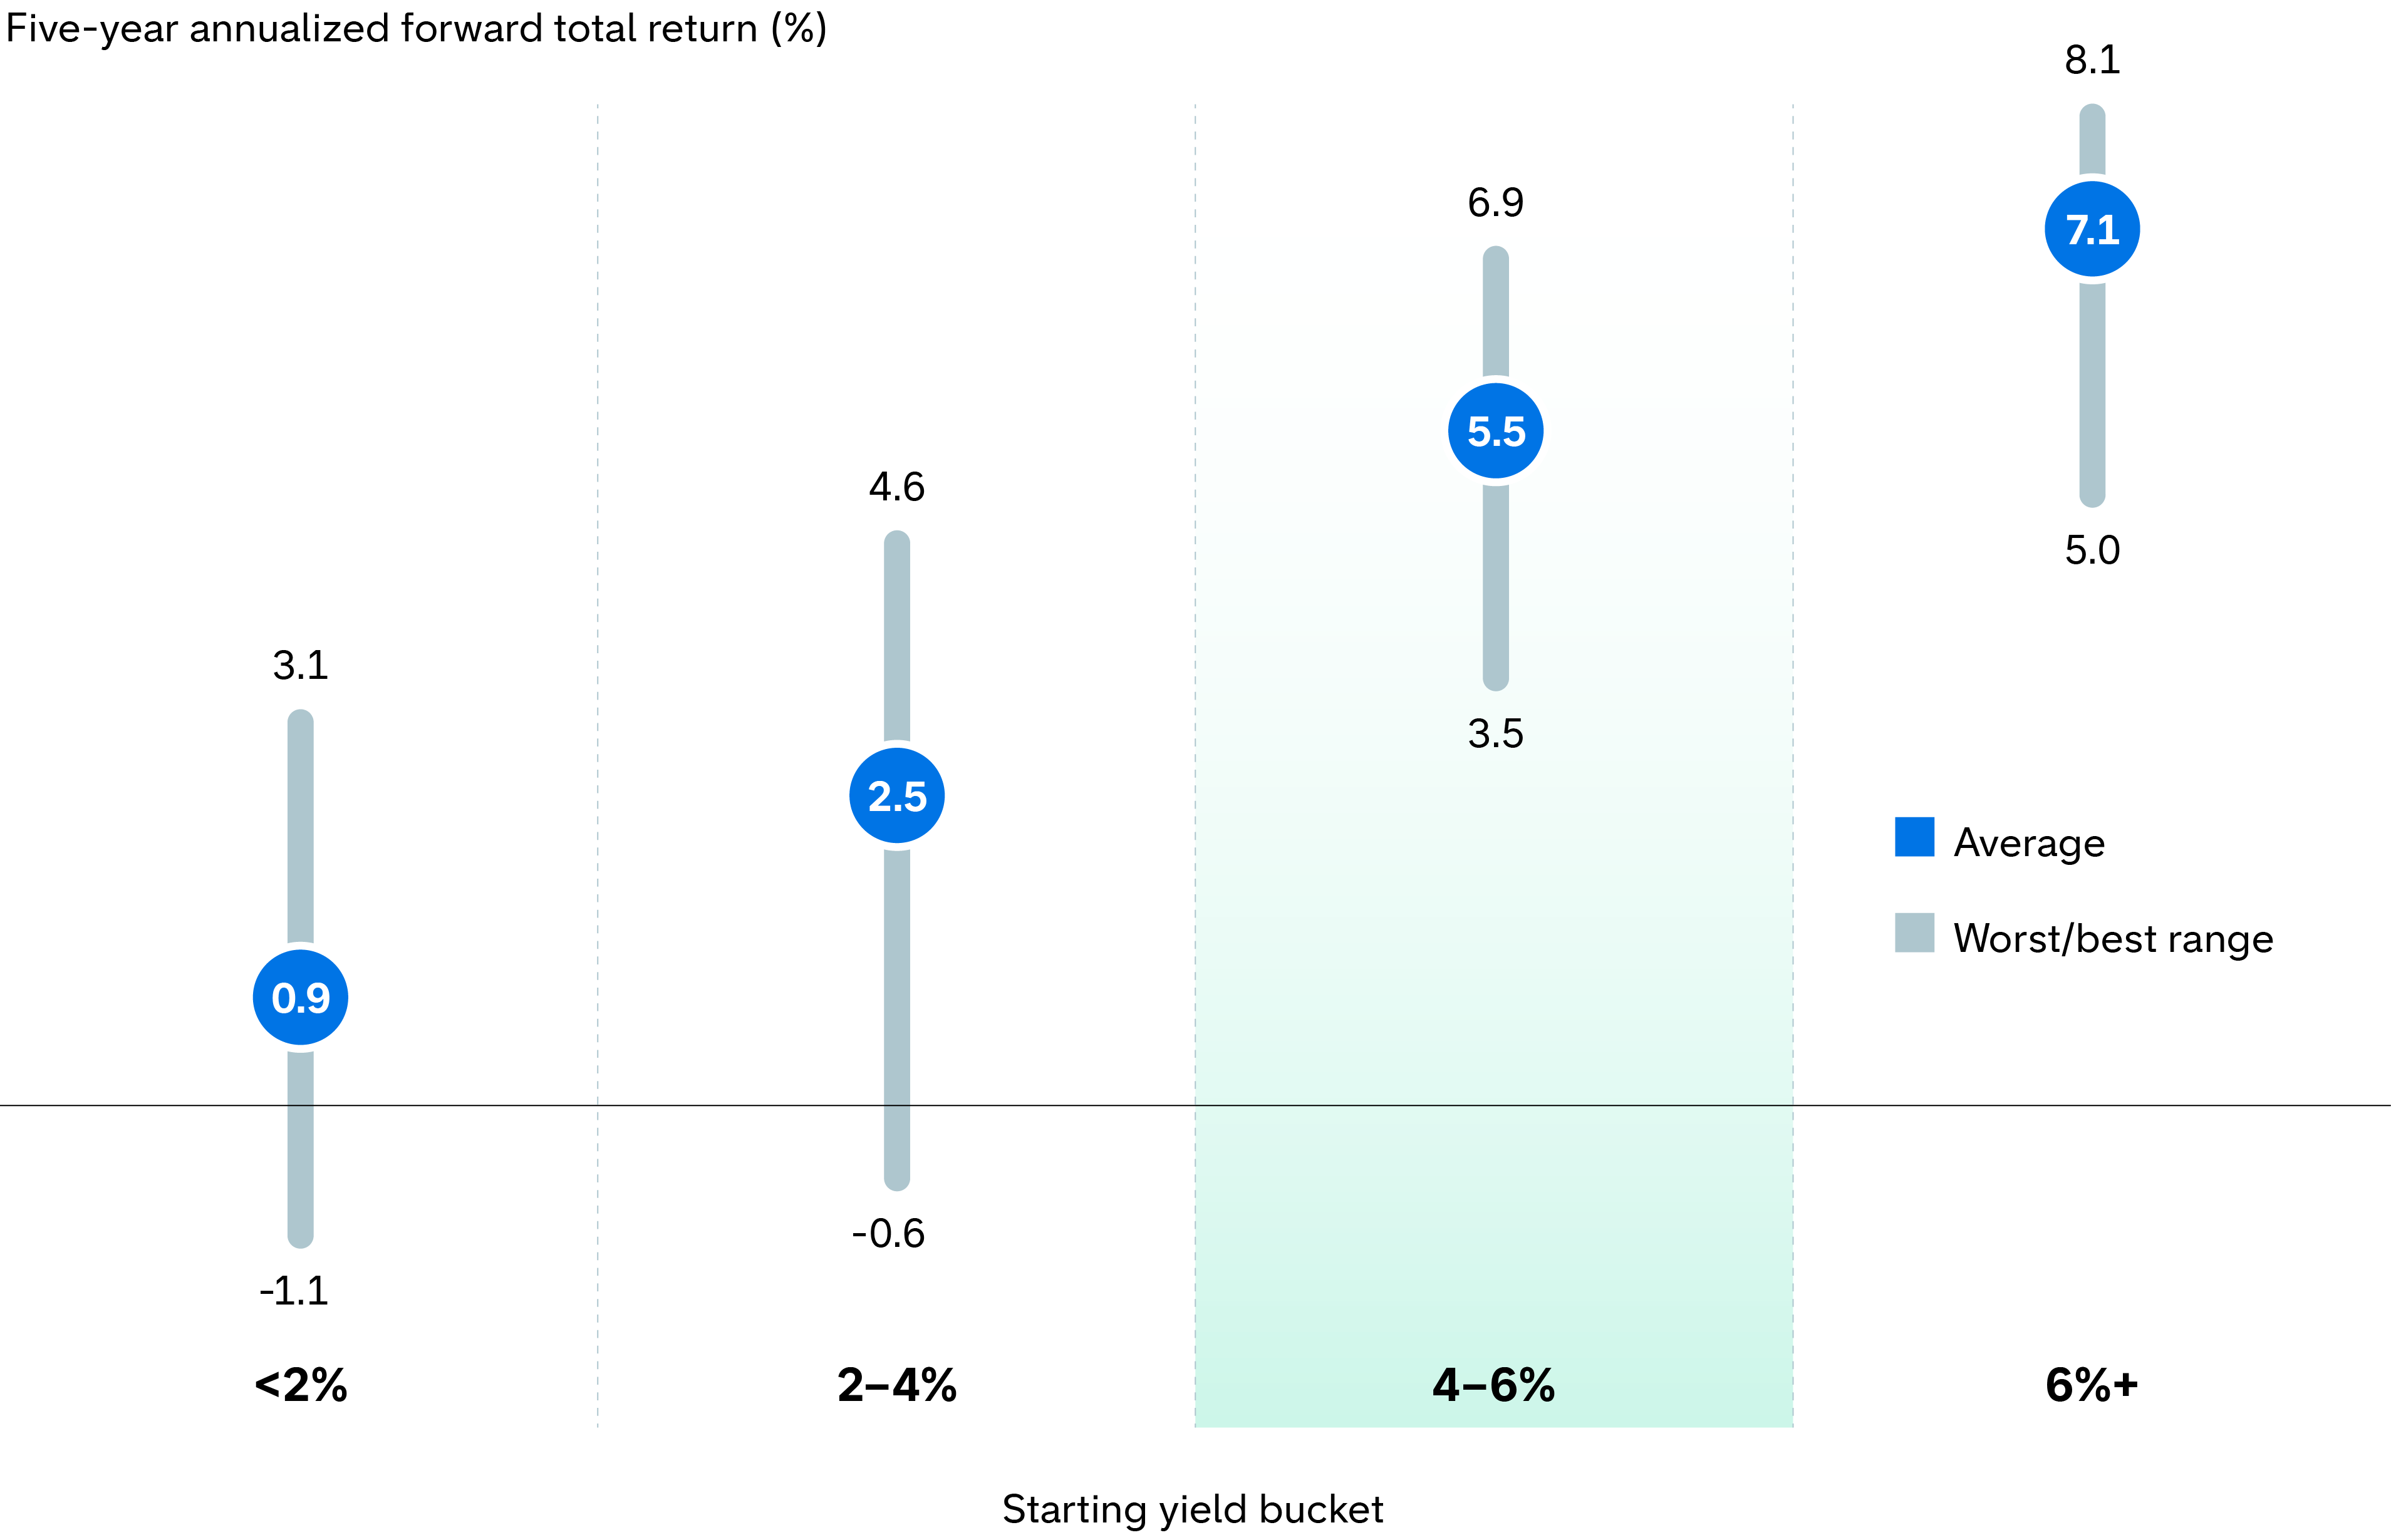
Source: Capital Group, Bloomberg, Bloomberg Index Services Ltd. As of 9/30/26. Return data shown for the Bloomberg U.S. Aggregate Index since 1991.
It’s also worth noting that these starting yields imply attractive forward returns even if rates don’t fall. If rate hike expectations hold, investors can earn a historically robust level of income potential across sectors. If recession risk rises and the Fed pivots to cuts, investors could earn price appreciation on top of the strong income, implying even higher total bond returns.
4. Consider how rates rising further may improve the risk-reward for owning duration
Varying sector dynamics result in varying outcomes in rising rate environments. Duration is a key factor to consider. Take corporate bonds: While investment-grade (BBB/Baa and above) bonds have less credit risk than high-yield bonds, their interest rate sensitivity is the opposite. Because investment grade is a higher duration sector than high yield, investment-grade bonds are likely to fare worse when rates rise, holding other factors equal.
Somewhat counterintuitively though, higher starting yields may actually improve the appeal of having interest rate sensitivity in portfolios. Not only are income levels higher, but yields would also have to subsequently rise meaningfully to offset the adverse price impact from rising rates and tip total returns negative.
The graphic below provides some color on key fixed income sectors and what bond math dictates. It shows how much yields would have to rise from current levels for the sectors to break even, where price decline offsets the income earned over the subsequent 12-month period. Given the extent to which interest rates have already risen and how much farther they would have to rise before a negative return could potentially occur over a 12-month horizon, the risk-reward dynamics may be favorable for extending duration.
Bond sectors have varying breakeven levels for rising rates – and upside potential if they fall
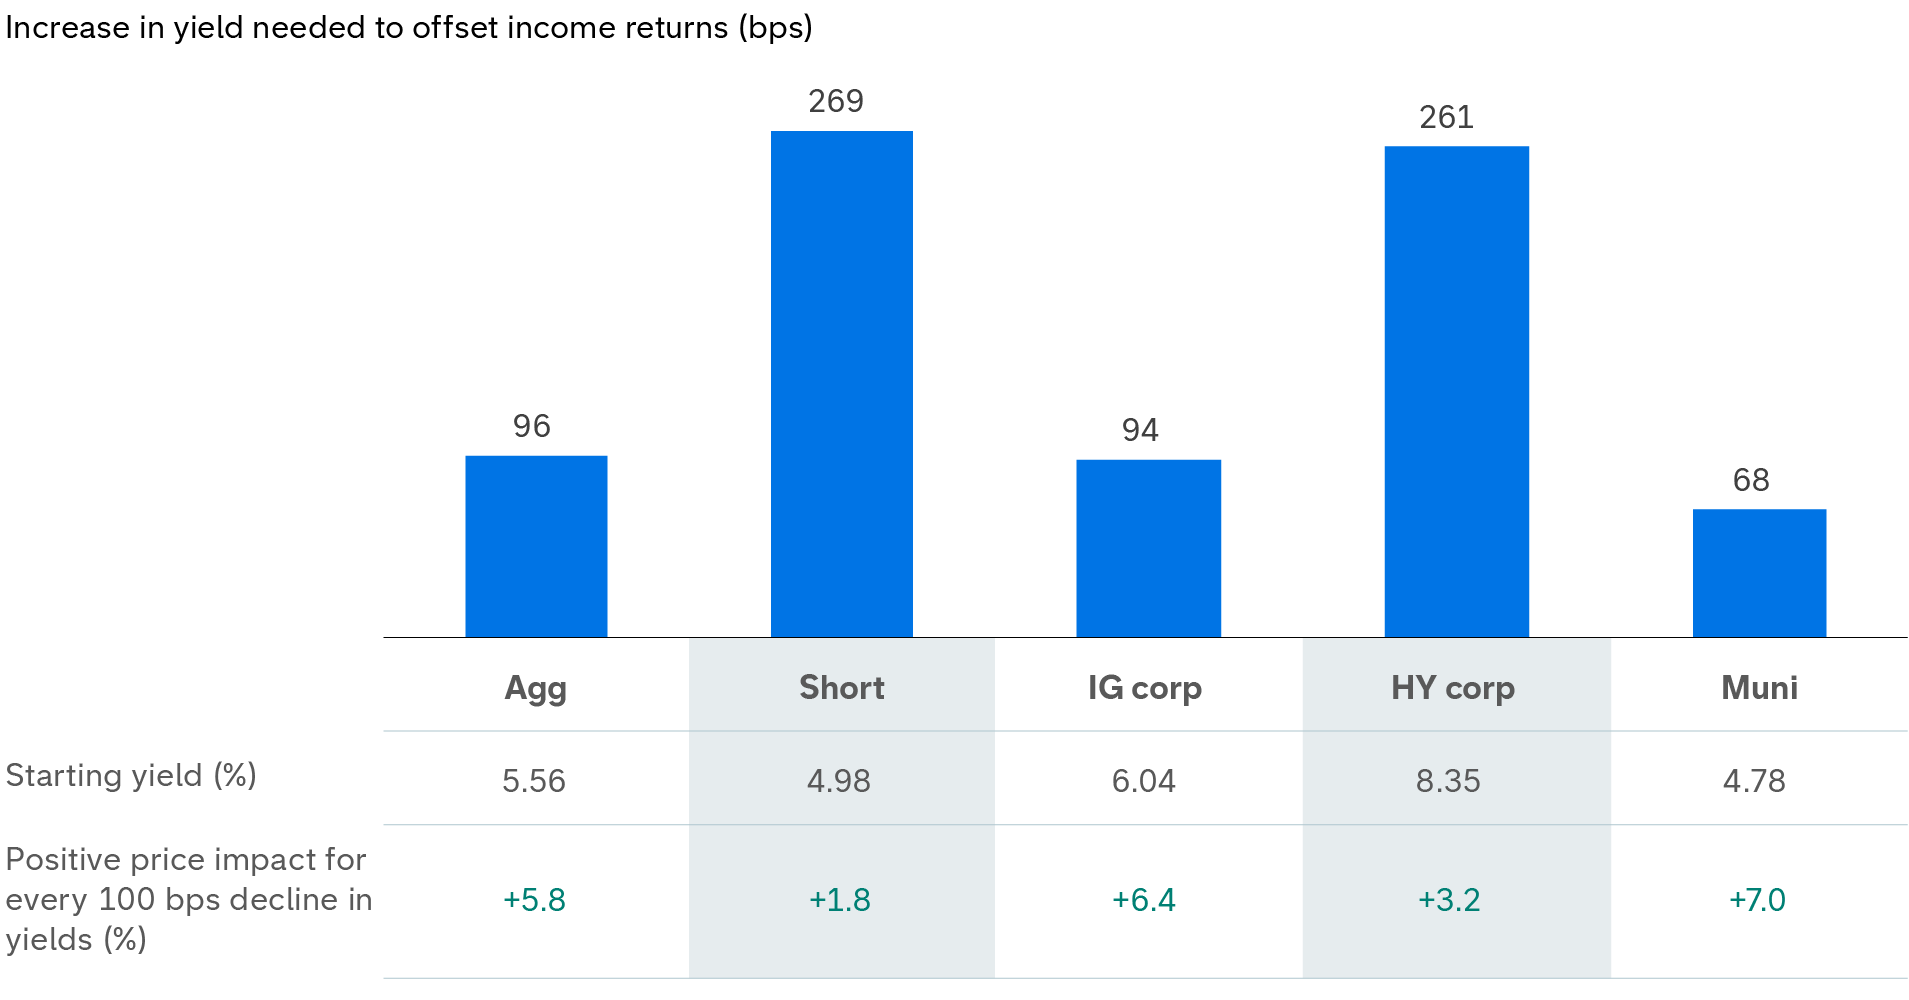
Sources: Capital Group, Bloomberg Index Services Ltd. As of 9/30/26. Labels above represent indexes as follows: Agg is the Bloomberg U.S. Aggregate Index, Short is the Bloomberg U.S. Government/Credit (1-3 Years) Index, IG Corporates is the Bloomberg U.S. Corporate Investment Grade Index, HY corporates is the Bloomberg U.S. Corporate High Yield 2% Issuer Capped Index, and Muni is the Bloomberg Municipal Bond Index. Yields shown are yield to worst.
In addition, greater interest rate sensitivity can be advantageous during a negative growth or other shock if the Fed cuts rates. The Fed has historically cut interest rates meaningfully lower – in some cases to zero or near it in past cycles to help buffer adverse economic conditions. A higher yield environment implies greater room for the Fed to cut, leading to stronger diversification potential through price gains. Investors should weigh whether the potential negative impact of rising yields on a bond fund’s price outweighs the potential positive impact of having additional income and stronger diversification over time from extending duration.
Given the room the Fed has to cut, especially if the market expectations for rate hikes match reality, duration could prove valuable in a growth shock or other adverse economic environment.
5. Worried about bonds providing diversification? Look at inflation rates.
Thinking back again to 2022, fixed income investors were particularly dismayed to see bonds not only suffering deep losses but doing so alongside a rout in stocks. One key role of fixed income that motivates investors to own bonds is their track record of providing diversification from equity volatility. So what went wrong then – and more importantly, how can investors be vigilant in the future to minimize exposure to a painful positive correlation?
Inflation may hold the key. When inflation is rising rapidly, it has negative impacts not only on bonds but the broader macroeconomic environment. Consumers become strained and spending may decline. Businesses see profit margins thin as their input costs rise. This leads to worsening corporate earnings and stock prices may begin to decline as inflation roars. Looking from 1990, meaningfully higher inflation – over 4% – has corresponded with higher stock-bond correlations:
Stock-bond correlations hold up when inflation is at or below 4%
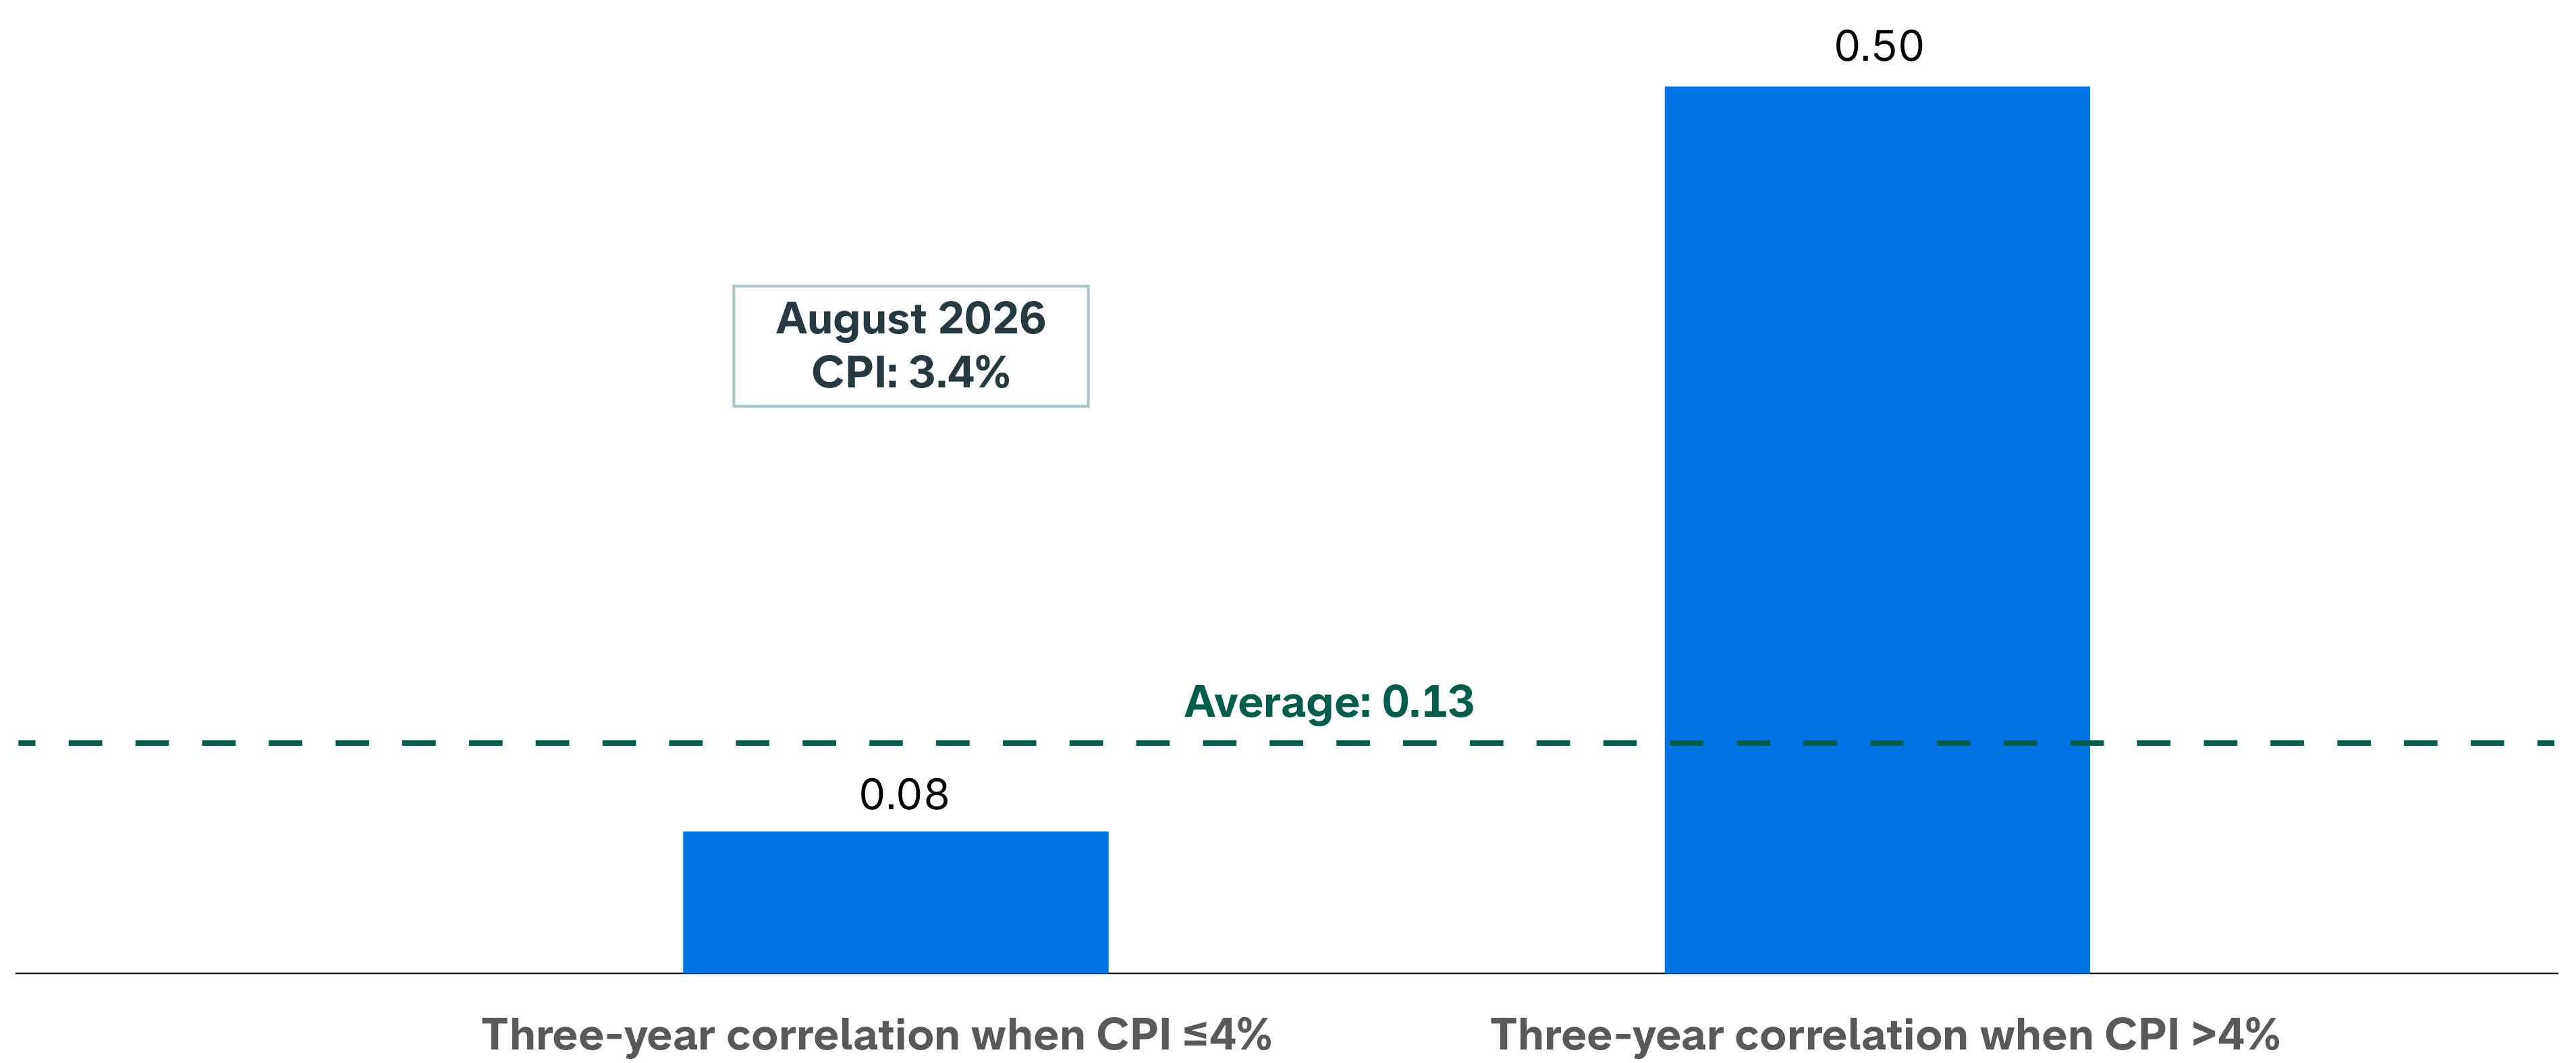
Sources: Capital Group, Bloomberg, Bloomberg Index Services Ltd, Bureau of Labor Statistics, Morningstar. Data from 1/1/90 through 9/30/26, calculated monthly. Correlations above shown between the U.S. Bloomberg Aggregate Index and the S&P 500 Index. CPI, the Consumer Price Index, represents inflation shown over a 12-month period.
The correlation between stocks and bonds jumps dramatically when the Consumer Price Index (CPI) is rising by more than 4%. Is that where inflation is headed today? Our assessment is that inflation may remain sticky at currently elevated levels but is unlikely to accelerate meaningfully higher for the reasons discussed earlier.
What these considerations tell us about today’s rising rates
While bond investors have endured losses year-to-date, considering these five factors may provide some comfort when looking ahead.
- The factors driving rates higher, like higher oil prices, larger corporate bond issuance, higher global yields, and even a recalibration of underlying trend growth, are different than what occurred in 2022.
- The 10-year Treasury yield is already edging up to projected nominal GDP, which has historically served as a ceiling for rates.
- Starting yields today imply high and attractive forward returns potential. In this range of starting yields historically, even the worst forward 5-year return has been positive.
- Current starting yields are high enough that rate expectations would have to shift meaningfully from here – in some cases by nearly another 100 basis points – to expect a negative total return over the next 12 months.
- The inflation rate, while elevated, remains below levels at which historical stock-bond correlation has risen sharply.
As long-term investors, we stress the importance of staying invested amid spates of market volatility. Trying to time the market can be dangerous, no matter how tempting. Markets move quickly and often unexpectedly. The asset allocation opportunity over the medium-term horizon may be a signal worth emphasizing, rather than the day-to-day noise of interest rate swings.
Learn more about
GDP refers to gross domestic product.
CBO refers to the Congressional Budget Office.
CPI refers to the Consumer Price Index -- a monthly Bureau of Labor Statistics measure of how prices that consumers pay change over time.
Correlation measures how two variables move in relation to each other.
Forward returns are an investment's returns expected over a future time period.
Past results are not predictive of results in future periods.
The market indexes are unmanaged and, therefore, have no expenses. Investors cannot invest directly in an index.
Duration measures a bond’s sensitivity to changes in interest rates. Generally speaking, a bond's price will go up 1% for every year of duration if interest rates fall by 1% or down 1% for every year of duration if interest rates rise by 1%.
Hyperscalers are large-scale cloud service providers that offer computing power and storage to organizations and individuals globally.
Bloomberg U.S. Aggregate Index represents the U.S. investment-grade fixed-rate bond market.
Bloomberg U.S. Corporate Investment Grade Index represents the universe of investment-grade, publicly issued U.S. corporate and specified foreign debentures and secured notes that meet the specified maturity, liquidity and quality requirements.
Bloomberg U.S. Corporate High Yield Index covers the universe of fixed-rate, non-investment-grade debt.
Bloomberg U.S. Corporate Bond Index measures the investment grade, fixed-rate, taxable corporate bond market. It includes U.S. dollar-denominated securities publicly issued by U.S. and non-U.S. industrial, utility and financial issuers.
Bloomberg U.S. Corporate High Yield 2% Issuer Capped Index covers the universe of fixed-rate, non-investment-grade debt. The index limits the maximum exposure of any one issuer to 2%.
Bloomberg Municipal Bond Index is a market value-weighted index designed to represent the long-term investment-grade tax-exempt bond market.
S&P 500 Index tracks the stocks of around 500 primarily large-cap, U.S. based companies.
Our latest insights
-
-
Interest Rates
-
World Markets Review
-
Economic Indicators
-
RELATED INSIGHTS
-
Artificial Intelligence
-
Economic Indicators
-
Don’t miss out
Get the Capital Ideas newsletter in your inbox every other week
Investments are not FDIC-insured, nor are they deposits of or guaranteed by a bank or any other entity, so they may lose value.
Investors should carefully consider investment objectives, risks, charges and expenses.
This and other important information is contained in the fund prospectuses and/or summary prospectuses, which can be obtained from a financial professional and should be read carefully before investing.
Bond ratings, which typically range from AAA/Aaa (highest) to D (lowest), are assigned by credit rating agencies such as Standard & Poor's, Moody's and/or Fitch, as an indication of an issuer's creditworthiness.
There have been periods when the results lagged the index(es) and/or average(s).
The indexes are unmanaged and, therefore, have no expenses. Investors cannot invest directly in an index.
Bloomberg Index Services Limited. BLOOMBERG® is a trademark and service mark of Bloomberg Finance L.P. and its affiliates (collectively "Bloomberg"). Bloomberg or Bloomberg's licensors own all proprietary rights in the Bloomberg Indices. Neither Bloomberg nor Bloomberg's licensors approves or endorses this material, or guarantees the accuracy or completeness of any information herein, or makes any warranty, express or implied, as to the results to be obtained therefrom and, to the maximum extent allowed by law, neither shall have any liability or responsibility for injury or damages arising in connection therewith.
Each S&P Index ("Index") shown is a product of S&P Dow Jones Indices LLC and/or its affiliates and has been licensed for use by Capital Group. Copyright © 2026 S&P Dow Jones Indices LLC, a division of S&P Global, and/or its affiliates. All rights reserved. Redistribution or reproduction in whole or in part is prohibited without written permission of S&P Dow Jones Indices LLC.
Statements attributed to an individual represent the opinions of that individual as of the date published and do not necessarily reflect the opinions of Capital Group or its affiliates. This information is intended to highlight issues and should not be considered advice, an endorsement or a recommendation.
All Capital Group trademarks mentioned are owned by The Capital Group Companies, Inc., an affiliated company or fund. All other company and product names mentioned are the property of their respective companies.
This content, developed by Capital Group, home of American Funds, should not be used as a primary basis for investment decisions and is not intended to serve as impartial investment or fiduciary advice.
Capital Client Group, Inc.
Use of this website is intended for U.S. residents only.